
An interesting pattern has been developing since 2018.
Gold’s price broke higher starting in September 2018 running ~ 75% higher over the next 23 months.
Silver broke higher in price starting in March 2020 running ~ 150% higher over the next 5 months.
Interest rates (US 30 year Treasury yield) broke higher starting in August 2020 and ran ~ 100% higher, from 1.20% to 2.40%, over the next 7 months.
Gold and silver led the way with bond yields / interest rates following higher.
Over the past 6 years, the pattern of spiking interest rates, as bonds are sold, and spiking gold and silver prices, as gold and silver are increasingly bought, has been firmly reestablished harking back to that 1970s pattern.
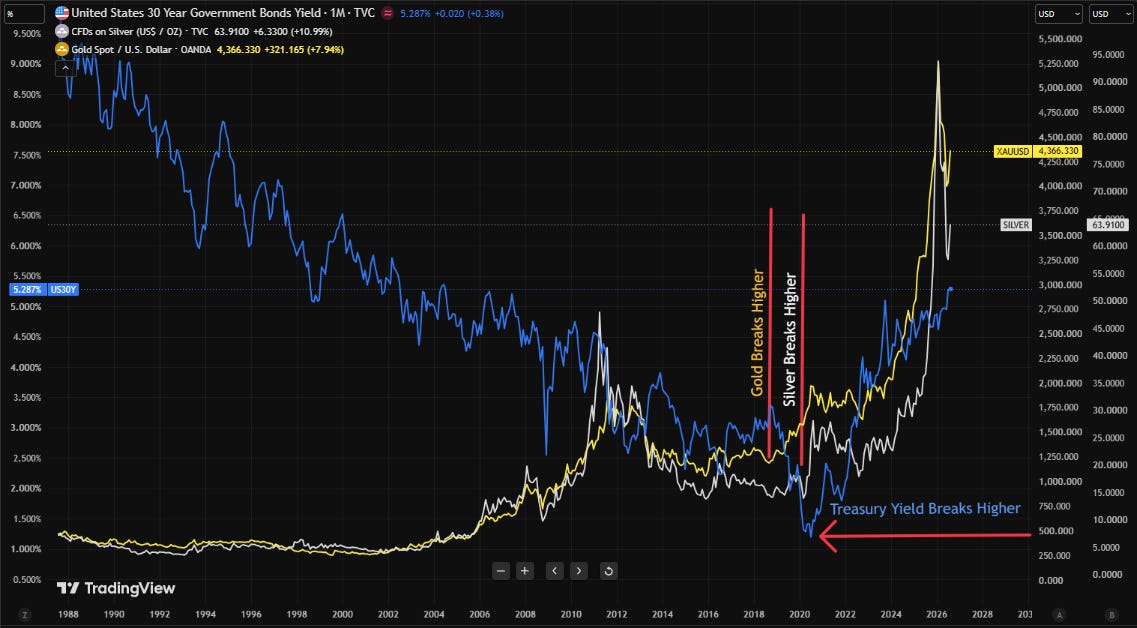
Figure 1 - Gold And Silver Prices vs 30 Year US Treasury Yield (blue line) - 1988 To 2026; data source: TradingView.com
Gibson’s Paradox where interest rates run higher with the price level (instead of the rate of price inflation) is reappearing again.
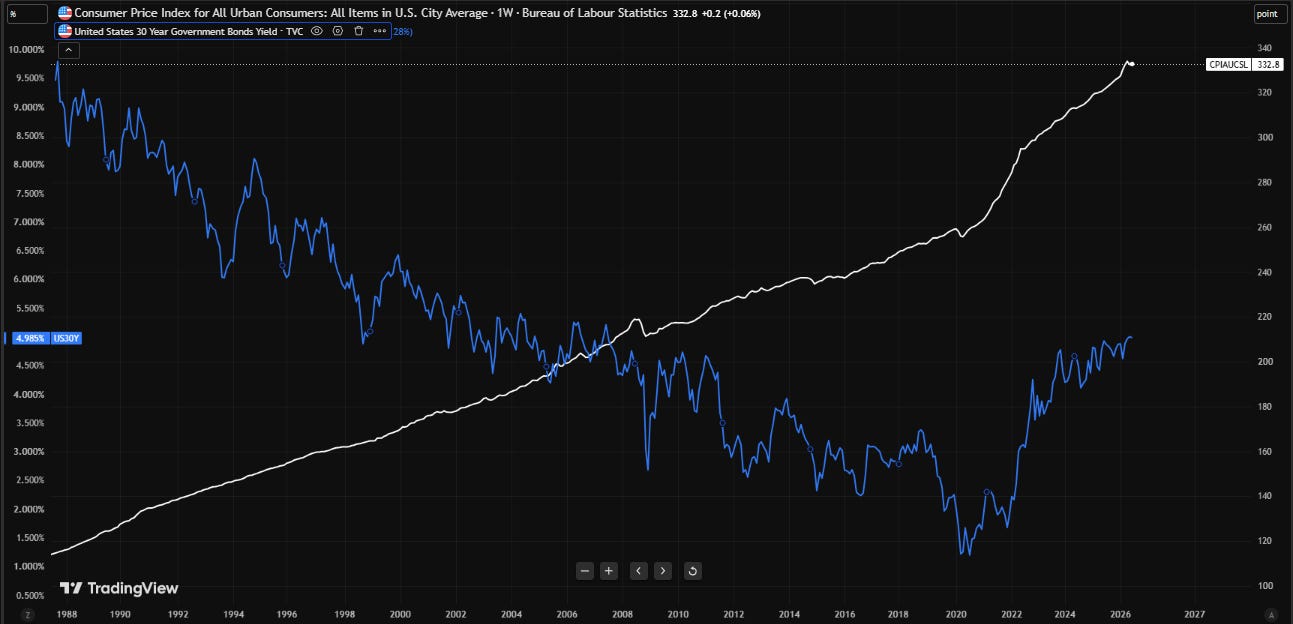
Figure 2 - Consumer Price Index Urban (white line) vs US 30 Year Treasury Yield (blue line) - 1988 To 2026; data source: TradingView.com
The pattern established with the creation of the London Bullion Market Association in 1987 of secularly lower interest rates with subduing of gold and silver’s price reaction appears to be coming undone.
As the $300 trillion (T) debt tower built by central banks and bullion banks over the last 40 years is burning down, expect food and energy to join gold and silver’s price run with a brutal impact as currency crises start to abound.
We’ve seen this show before and it is still early days.
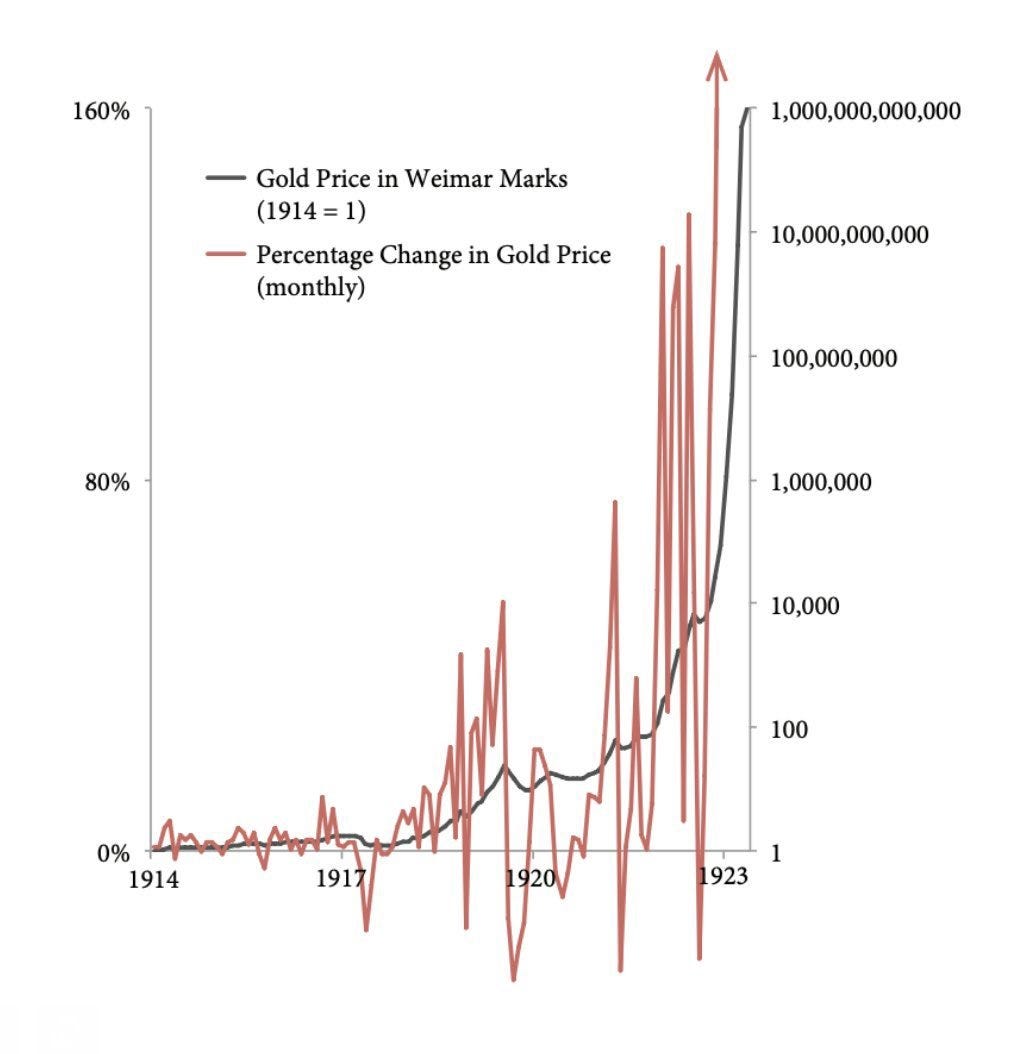
Figure 3 - Gold Priced In Weimar Republic Marks (black) And Monthly Price Change (red) 1914 to 1923
This Substack noted last week that two jets carrying Iranian assets including gold flew from Abu Dhabi, UAE to Iran.
This week, President Trump called the UAE’s President to check in and discuss developments taking place in the Middle East Region.

Last week after the Iranian assets were flown to Iran, Treasury Secretary Scott Bessent said the world this week would see economic isolation measures imposed on Iran “like the world has never seen before.”
This Substack has been tracking the increasing global shortage of diesel fuel.
Today, the difference in the price of a barrel of diesel vs the price of a barrel of crude oil, called the crack spread, reached the highest level in history at over $102 / bbl.
Diesel is in intensifying shortage globally and is leading the price of crude oil higher.
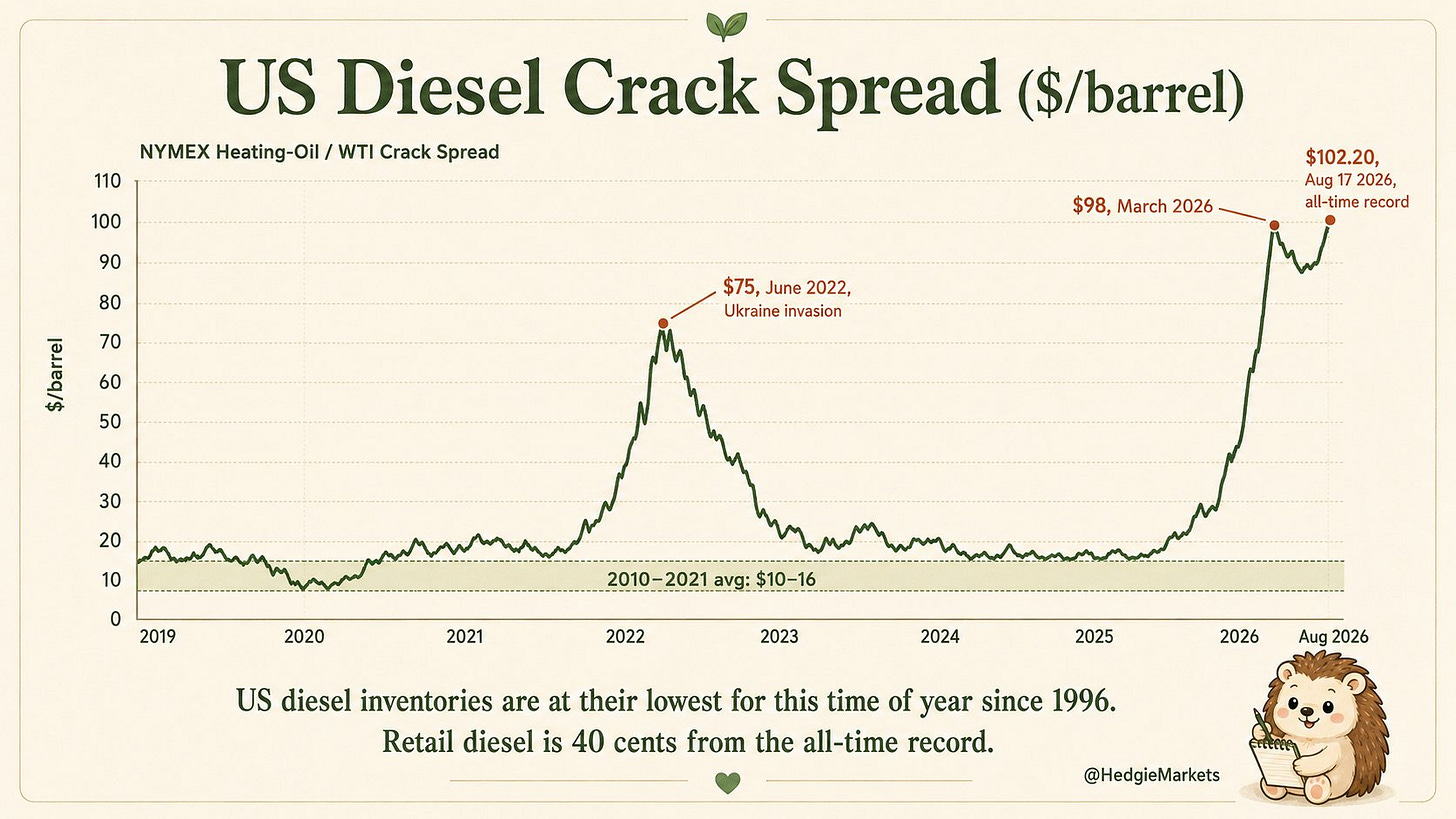
Figure 4 - US Diesel Crack Spread 2019 to 2026; source: @hedgiemarkets / x.com
Expect wildly volatile oil and petroleum fuel markets as the diesel and petroleum product shortage intensifies globally.
Best regards,
David Jensen
This post is public so feel free to share it with your contacts.

Comments
Nothing yet. Say the first thing.
Sign in to join the conversation.