
Jason Zweig wrote recently about the hidden costs of leveraged ETFs, specifically the financing cost associated with the total return swaps these ETFs utilize in order to get some multiple of a reference asset’s daily return. That cost isn’t broken out or included in an ETF’s expense ratio. Instead, it’s netted against the swaps’ gains or losses, similar to how transaction costs are handled.
Jason gave a few examples to illustrate how large these hidden costs can be. He also referenced research that professor Hendrik Bessembinder had conducted that found “frictions”, including swap financing costs, burned up half a percentage point of returns per month.
Long levered single stock ETFs underperform by an average of 0.79% per month, with 0.26% attributable to daily rebalancing and 0.53% to frictions.
(“Returns to Constant Leverage Strategies: General Principles and Application to Levered Single-Stock ETFs” by Hendrik Bessembinder; Oct. 12. 2025)
I’ve never really spent much time on these products, which are geared to speculators not investors. Nonetheless, Jason’s article and professor Bessembinder’s research piqued my interest and so I decided to try to estimate the swap financing costs incurred by the largest daily single-stock ETF — the $7.9 billion Direxion Daily TSLA Bull 2x ETF — over its lifetime.
To do so, I pored through the ETF’s periodic filings, compiling the swap terms. As Jason explained, swap financing typically consists of a base rate (i.e., in this case, the Secured Overnight Financing Rate, or SOFR) and a spread, both variable. Here’s an example from the Direxion ETF’s most recent quarterly filing.
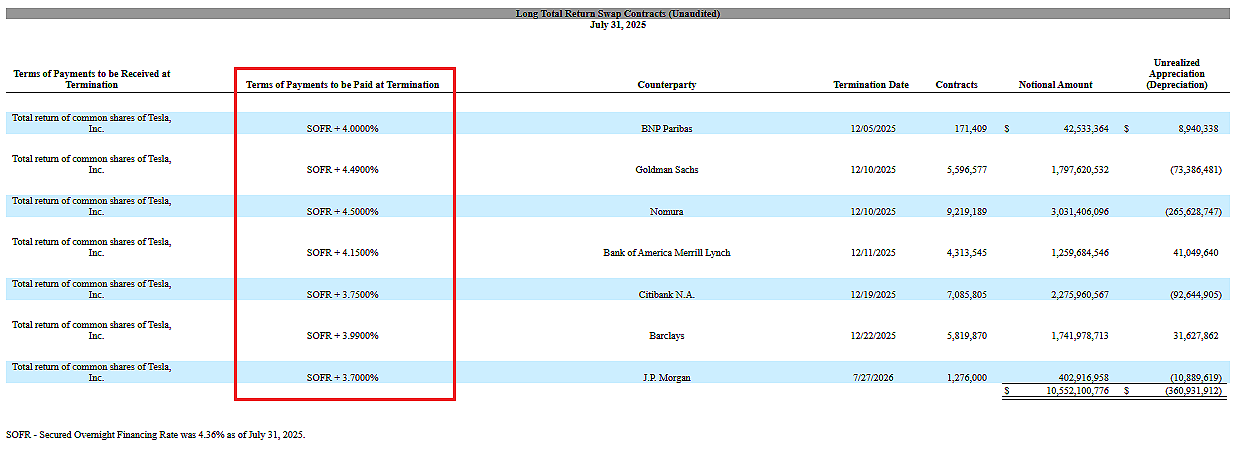
As of July 31, 2025, SOFR stood at 4.36% per year while the spreads on these swaps ranged (depending on the counterparty and other factors) from 3.7% to 4.5%, bringing the all-in cost of each swap to around 8.06% to 8.86% per year.
Here’s what the Direxion ETF’s average annual swap financing rates looked like from its Aug. 2022 inception through July 31, 2025 broken down by its component pieces (base rate and spread):
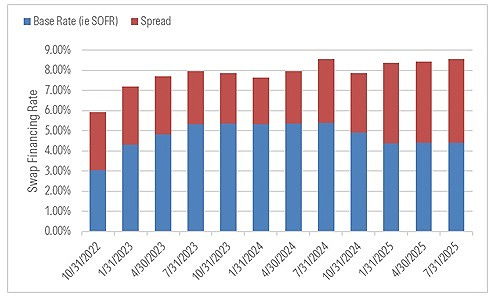
The all-in rate rose from around 6% per year from its early days to about 8.6% annually in July 2025. What drove that? The base rate, SOFR, climbed around 1.3 percentage points, reflecting tighter monetary policy and other macro factors. The spread widened by the same amount, the increase likely owing to balance-sheet constraints among swap counterparties as the ETF grew larger. That is, diseconomies of scale.
What did that look like in dollar terms? Here are my ballpark estimates of the ETF’s swap financing costs based on the financing terms it disclosed (i.e., the above rates) and its daily net assets (to which those rates would have been applied).
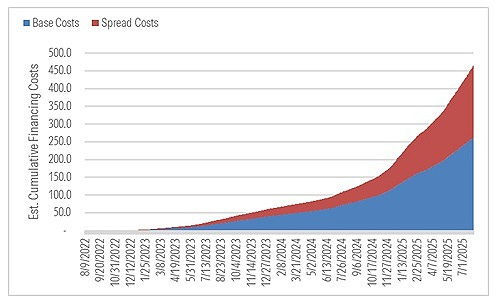
All told, I estimate the ETF incurred around $466 million in swap financing costs from inception through July 31, 2025, $204 million of that being spread-related costs.
To put those figures into perspective, here are the financing costs expressed as a percentage of the ETF’s average daily net assets from inception through July 31, 2025. (The ETF has an Oct. 31 fiscal year-end, explaining why I measured over the periods ended Oct. 31, the more-recent period ended July 31, 2025 excepted.)
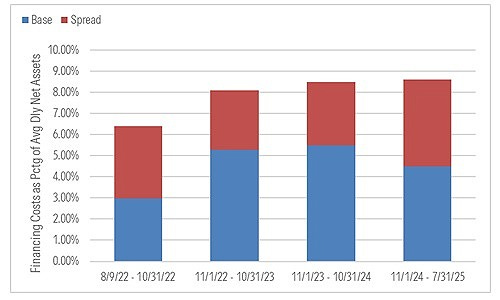
All-in, the swap financing costs accounted for 6.40% to 8.60% of the fund’s average daily net assets over its lifetime, with the price tag rising as time went on. If we focused just on the spread component, the annual cost ranged from 3.00% to over 4.10% of the ETF’s average daily net assets. Taken together with the ETF’s 0.95% expense ratio, the spread costs alone would push the annual fee close to 5% per year based on the most recently-reported swap financing terms.
These are all estimates. I can’t know what swap financing costs the ETF actually incurred because that data isn’t reported (which is ill-advised in my personal view; these costs should be a standard part of the expense ratio, but I digress). Yet, precision of my numbers aside, it sure looks like it’s costing speculators an arm and a leg.
Yes, those speculators might just shrug. The all-in swap costs worked out to around two to four basis points of assets each day on average, which for someone gambling in a 2x daily single-stock ETF is probably what a mosquito bite feels like to an elephant. However, those costs can mount quickly - you spend a month each year trading something like this Direxion ETF and you’re looking at 0.35% in spread costs alone.
I guess I could be persuaded this was no-harm/no-foul if investors in ETFs like the Direxion ETF were seeing decent results in dollar terms even after all fees had been spoken for. But that’s not been the case. Here’s the pre-fee investment income and gains (losses) the Direxion ETF reported for each fiscal period, compared to its stated fees as well as the all-in estimated swap costs.
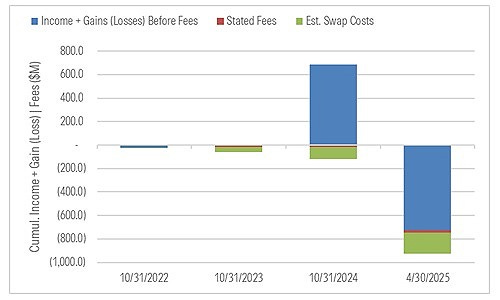
From its Aug. 2022 inception through Apr. 30, 2025 (the date of the most recent semi-annual report), Direxion reported that the ETF had lost a cumulative $67 million before fees. Once you deduct the $43 million in cumulative fees the ETF levied as well as the roughly $330 million in cumulative swap financing costs it incurred, you’re looking at around $440 million in total lifetime losses.
Maybe that’s all water under the bridge if the ETF delivered on its goal of generating twice Tesla’s return on a given day (before fees), the way it’s meant to do. Yet, it struggled to do that, as the arithmetic average of the ETF’s daily up- and downside capture ratios versus Tesla itself attests. (Note that until Apr. 2024, the ETF had a 1.5x daily TSLA return target, and so I’ve broken out the average capture ratios for both the period before and after it went to 2x.)
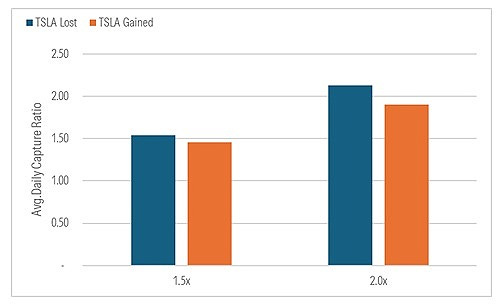
On Tesla’s down days, the ETF captured a bit more than its daily target (1.54x of Tesla’s loss, on average, while it was a 1.5x ETF, and 2.13x while it was a 2x ETF) but on Tesla’s up days it captured less than its daily target (1.46x when it was a 1.5x ETF and 1.90 when it was a 2.0x ETF). From the ETF’s inception through July 31, 2025, Tesla was essentially flat while the ETF lost 53% of its value on a total return basis, not only because of volatility decay but also the steep embedded costs here.
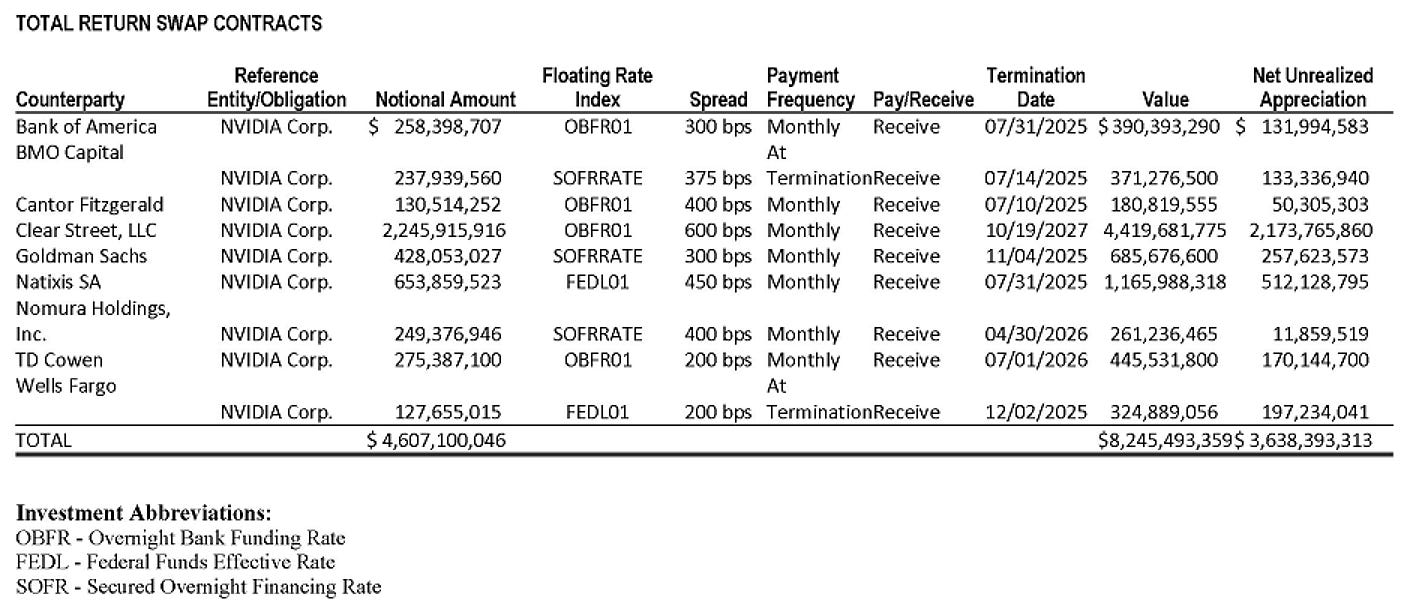
Is this an anomaly? Judging from professor Bessembinder’s research, it would seem not. Indeed, you don’t have to look too far for other examples like this one. For instance, here are the most recently-reported swap terms for the second-largest leveraged single-stock ETF by net assets, GraniteShares 2x Long NVDA Daily ETF. Back of the envelope, it works out to a roughly 9.1% all-in financing rate.
And here are the terms for the third-largest, T-Rex 2x Long MSTR Daily Target ETF. All-in, it works out to a 20.7% swap financing rate at a 1600+ basis point spread.

Stench is thick. Breathe through your mouth.
The views and opinions expressed in this blog post are those of Jeffrey Ptak and do not necessarily reflect those of Morningstar Research Services or its affiliates.
No posts
Comments
Nothing yet. Say the first thing.
Sign in to join the conversation.