
This article is too long for email. You’ll need to read it in your browser or in the Substack app.
It seems that every few weeks, a new article or video on the literacy crisis goes viral. Whether this is a video on YouTube, an article in The Atlantic, or a post on Substack, the message tends to be more or less the same. Americans are reading less; college students struggle to read whole or difficult texts; early childhood education is in decline.
Two years ago, I made one of these videos. If you’ve seen any of my content online before, this is likely the video you’ve seen: ‘Why everyone stopped reading.’ Shortly after making that video, I decided to take another look at the issue, dealing less with anecdotes and the history of reading education and looking at how American students’ literacy levels are faring in the modern education system.1
I am including these videos in the introduction of this article for a few reasons. First, to show that I played some role in establishing the narrative that there is a literacy crisis. Second, to highlight how, in that second video, I discovered that some of the figures cited in discussions of the literacy crisis are unsupported or rely on a misinterpretation of the relevant data. Third, to allow you to see exactly what I said several years ago. That third point is particularly important, as I have come to believe that the literacy crisis is more complex than I previously understood, and so near the end of this article I’ll be explicitly correcting some of my previous claims. Most of them I still stand by—but there are a few important errors that I need to correct.
In this article, I am going to defend two claims. First, the data about literacy in the United States are being handled irresponsibly. Sometimes this is due to insufficient sourcing; other times it is due to combining statistics from multiple studies and drawing erroneous conclusions. Second, there is no single ‘literacy crisis.’ Instead, there are multiple problems facing American culture: early childhood education, adult literacy rates, and sustaining a literate (and literary) culture. Treating these as a single crisis will not allow us to adequately address each problem.
As best as I can gather, many of the statistics cited in discussions of the literacy crisis are found on a web page from the National Literacy Institute (NLI). This website has been updated recently; when I made the video ‘The American Literacy Crisis, Explained,’ the information was slightly different.
The key claims we need to focus on are:
On average, 79% of U.S. adults nationwide are literate in 2024.
21% of adults in the US are illiterate in 2024.
54% of adults have a literacy below a 6th-grade level (20% are below 5th-grade level).
Low levels of literacy costs (sic) the US up to 2.2 trillion per year (sic).
34% of adults lacking literacy proficiency were born outside the US.
Elsewhere on that same page, the NLI makes another claim: ‘130 million adults are now unable to read a simple story to their children.’
These numbers have been widely shared. For instance, the Academic Credentials Evaluation Institute, Inc. (ACEI) repeats these numbers, and they explicitly say, ‘According to the National Literacy Institute…’ to introduce them. NLI is being treated as an authority on American literacy rates.
On the ACEI page, they write:
According to the National Literacy Institute, about 79% of U.S. adults are considered fully literate, while 21% are functionally illiterate, meaning they struggle with everyday reading tasks. Even more striking, over half of adults read below a sixth-grade level…
Now consider Iran, a country currently in the global spotlight. Despite economic and political differences, Iran’s adult literacy rate is around 88–90%, with youth literacy reaching nearly 99%, according to World Bank and global education data.
Reading this page, you would conclude that Iran has a substantially higher literacy rate than the United States. In youth literacy in particular, they have seemingly achieved near-universal literacy, while the United States lags behind.
Note, however, that NLI does not have youth literacy statistics on its page. You can also look at their page and see that they provide no sources or definitions. We are not told where these numbers come from, and we are not told what ‘literacy’ even means.
We are going to look at this problem in more detail in a moment. But first, we should ask: what does the National Literacy Institute do? Here is the entirety of their About page:
The NLPDC is a collaboration of literacy service providers, foundations, businesses, School Districts and other community partners committed to the goal of equipping, at a proficient level, children with the life skills of reading, writing, and communication.
The NLPDC will galvanize these organizations around a shared vision of a city-wide network of high quality early literacy resources that are accessible, collaborative, integrated, and well supported.
In order to accomplish these goals, the NLPDC will gather, share and use the latest research to inform its partners, expand funding opportunities for high quality service providers, promote successful strategies and develop evaluation systems to measure progress and success.
NLPDC produces academic achievement results quickly, without the need for long process analysis. We have a history of success in schools and districts of all sizes, from large urban districts to rural and remote schools. We help our customers build their own capacity for effective instruction by laying a foundation of research-based knowledge, supporting the use of proven tools, and developing leadership.
The NLPDC supports Women and Minority Owned Businesses. We embrace diversity, equity and equality for all services.
There is an immediate discrepancy here—what is the NLPDC? That is the acronym for the National Literacy Professional Development Consortium, which is NLI’s original (and legal) name. This name better reflects what the NLI does: they provide literacy services and professional development for teachers and other clients. Note that they ‘gather, share and use the latest research’—what they do not do is research literacy rates themselves.
This means that the numbers they cite are either (i) made up, or (ii) from another source. Unfortunately, the NLI does not provide any source information on the page I linked above. Later in this piece, I will go through some of the claims and show the sources that I found.
This is a real problem because the claims on a single NLI page appear to contradict themselves. If the United States has a 79% adult literacy rate, then how is it possible that 130 million adults struggle to read a simple story to their children? There are roughly 267 million adults in the United States—so, 130 million is approximately half of US adults. Half of US adults cannot read a simple story to their children, we are told, but we have a 79% literacy rate—how can this be?
I have previously emailed NLI to ask about their sourcing and methodology. I never received a reply.
When I noticed the discrepancy on NLI’s website, I started to look for alternative sources. Another website, World Population Review (WPR), has a slick-looking infographic and searchable database of literacy rates by country. According to this website, the United States has a 99% literacy rate. This would make us comparable to Germany and Japan, though we would still be in the mid-30s in the global rankings; this is partly because some countries, such as North Korea, Uzbekistan, and Norway, report a literacy rate of 100%.
This set off some alarm bells. First, the discrepancy between NLI and WPR is severe—one of them has to be wrong. Second, the literacy rate of 99% seems a little bit too clean, especially given that many countries’ literacy rates involve decimal points. Something seemed off.
Fortunately, WPR does list sources, though they do not give definitions or explain their methodology. Here are the sources that the WPR cites:
Literacy rate, adult total (% of people ages 15 and above) - World Bank
4.6.2. Adult literacy rate, population 15+ years, both sexes - UNESCO Institute for Statistics (UIS)
Countries with the highest literacy rate - US Career Institute
(You may notice that some of these are the same sources that were cited by the ACEI.)
I looked at all of these sources, and here is what I found:
The World Bank contains no data for the United States.
CIA World Factbook was sunset in February 2026, but in an archived version of the page from late 2025, I found that the CIA World Factbook contains no data for the United States.
UNESCO Institute for Statistics contains no data for the United States.
Our World in Data contains no data for the United States.
US Career Institute reports that the United States has a literacy rate of 99%.
But there are two problems. First, US Career Institute is not a research organization, and their findings are presented as an infographic. Second, US Career Institute lists their sources, but they are, with one exception, the same sources as cited by WPR.
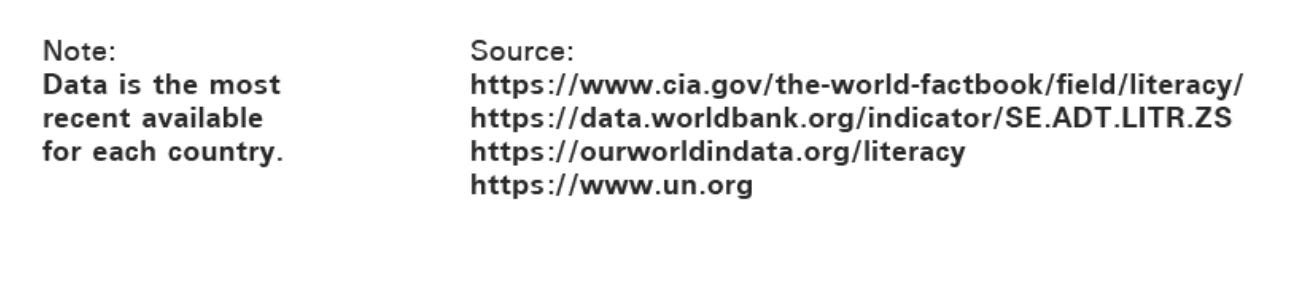
The one additional source they cite is simply https://www.un.org. They cited the entire UN webpage.
Something has gone terribly wrong.
I’ve also emailed WPR to ask them about their sources—so far, I have not heard back.
I still wanted to know where that 99% figure comes from, and I had one lead: the US Career Institute cites ‘the UN.’ This took some time to find, but I eventually found a Human Development Report from 2007/2008. There is a section of that report on literacy rates, and I found this passage on page 226:
Many high-income countries, having attained high levels of literacy, no longer collect basic literacy statistics and thus are not included in the UIS data. In calculating the HDI, a literacy rate of 99.0% is assumed for high-income countries that do not report adult literacy information.
That clean 99% figure we have for the US and some other countries is an assumption made by the UN, as they admit that we don’t have good data on literacy rates in rich countries. Basically, once a country reaches a certain level of educational attainment and overall wealth, they stop tracking literacy at the level the report is interested in.
The 99% figure comes from a survey of the lowest level of adult literacy. A literate adult, according to that report, is defined as someone over the age of 15 ‘who can, with understanding, both read and write a short simple statement on his/her everyday life.’ But the United States does not do this sort of research, as most countries with a high enough GDP no longer feel the need to track the rate of adults who read and write a simple sentence. Thus, the UN team made an assumption.
This is the origin of the claim that we have a 99% adult literacy rate in the United States.
But in that same report, there is a separate table of figures for those who ‘lack literacy skills.’ A person is defined as lacking literacy skills if they score at ‘level 1 on the prose literacy scale of the International Adult Literacy Survey. Most tasks at this level require the reader to locate a piece of information in the text that is identical to or synonymous with the information given in the directive.’
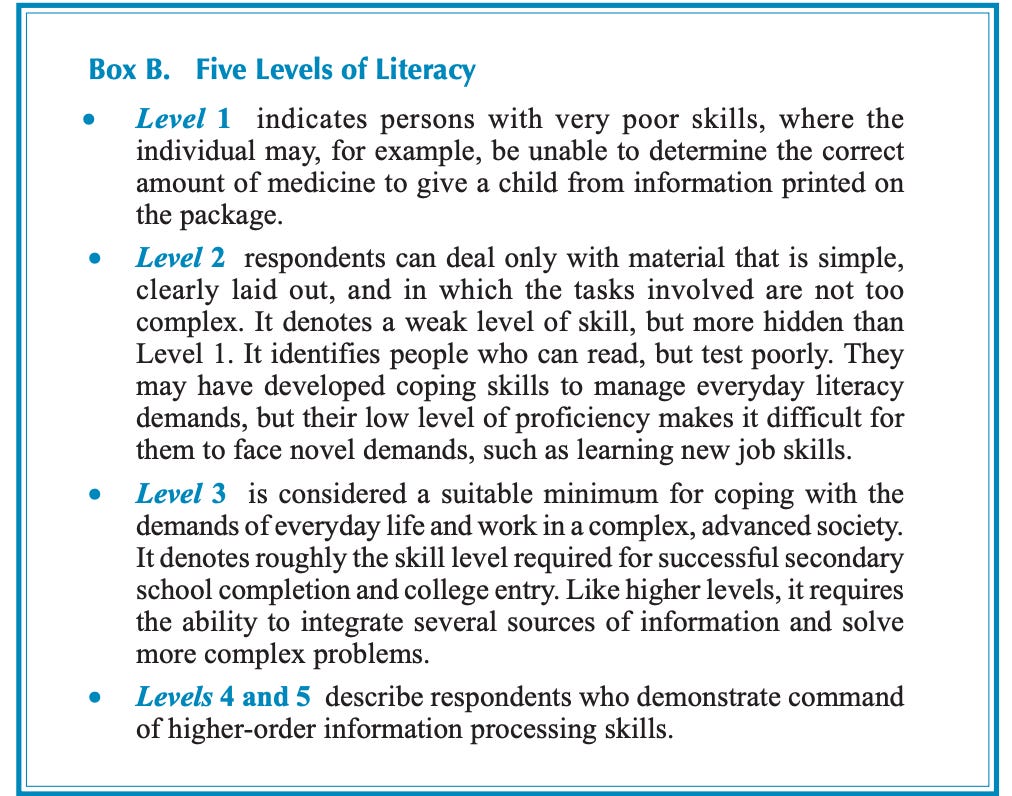
If you look there, you will find that as of 1994, 20% of adults in the United States were said to lack literacy skills, defined as possessing skills at a level 1 on the International Adult Literacy Survey (IALS). The IALS introduced a five-point scale for literacy. In a summary of the findings published by OECD, we have some nice descriptions of these levels.
Notice that even if you score at Level 1, you may be able to read, but you have ‘very poor skills.’
From this brief investigation, we can draw a few lessons.
First, definitions matter. ‘Literacy’ is not a single phenomenon; as we’ll see below, most literacy research focuses on levels of literacy, not an all-or-nothing claim about being literate or illiterate.
Second, you cannot compare literacy rates if you’re using different definitions. The ACEI (via NLI) says that the United States has a 79% adult literacy rate and Iran has an 88-90% literacy rate. I believe that this is measuring the United States by a stricter definition than Iran: the United States is being evaluated on the population possessing literacy skills, while Iran is being evaluated on meeting the minimal definition of literacy.
Third, make sure to read the sources and check the definitions. If someone is citing literacy statistics, it is critical that you ask them to provide the sources and definitions. NLI provides no sources, and WPR’s sourcing is so irresponsible that I would no longer trust them for any sort of information.
Fourth, literacy research is difficult. We’ll see more of this below, but I need to stress this point again and again. Given the varying definitions of literacy, the diversity of the populations studied, and the inherent difficulties of drawing conclusions about a population of 300 million people, it is difficult to find reliable data on literacy rates in the United States.
So far, we’ve seen that some of the data used in discussions of literacy are either (i) mishandled or (ii) inappropriately sourced. I have not shown that anything on either the NLI or WPR sites is strictly speaking wrong. But we can now look at those claims from NLI again and say a bit more. This will also allow us to identify the particular sources that (I believe) NLI is drawing from.
This can be disputed simply by asking for a definition—since the NLI gives no definition of ‘literate’ and ‘illiterate,’ there is no reason to take the claim particularly seriously. And since they give no source, you could assume that it is simply made up.2
However, I believe I have found the source for this particular claim: a report from the National Center for Education Statistics.
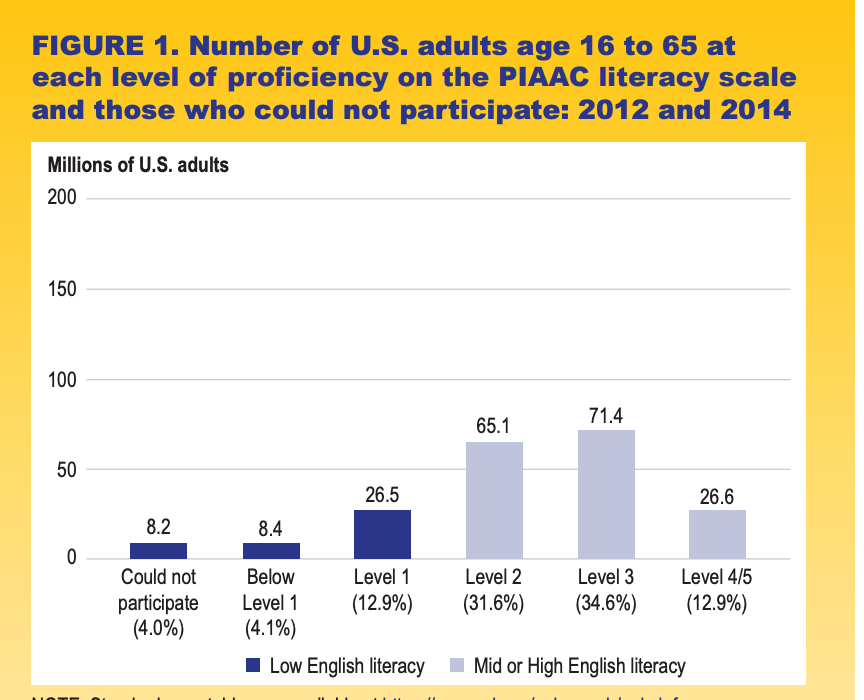
This report draws on data from the Program for the International Assessment of Adult Competencies (PIAAC), which was a successor to the IALS. While the IALS had a five-point scale, the PIAAC split Level 1 literacy into Level 1 and ‘Below Level 1’. If you add the numbers for Level 1, Below Level 1, and those who could not participate, you get 21%.
NCES describes the findings in this way:
Four in five U.S. adults (79 percent) have English literacy skills sufficient to complete tasks that require comparing and contrasting information, paraphrasing, or making low-level inferences—literacy skills at level 2 or above in PIAAC (OECD 2013). In contrast, one in five U.S. adults (21 percent) has difficulty completing these tasks (figure 1). This translates into 43.0 million U.S. adults who possess low literacy skills: 26.5 million at level 1 and 8.4 million below level 1, while 8.2 million could not participate in PIAAC’s background survey either because of a language barrier or a cognitive or physical inability to be interviewed. These adults who were unable to participate are categorized as having low English literacy skills, as is done in international reports (OECD 2013), although no direct assessment of their skills is available.
But notice that there are a few complications here. First, we are including adults who possess ‘a cognitive or physical inability to be interviewed’ in the group having low literacy skills. We are also only tracking literacy in English. If you could not participate due to a language barrier or disability, then you were automatically categorized as possessing low literacy skills.
So, to get to the 21% figure, we are including immigrants who do not know English, people with severe cognitive and physical disabilities, and more.
This is not to say that we shouldn’t care about the literacy skills of immigrants or those with disabilities—we clearly should. But if you are surveying a population that does not speak English or possesses some severe disability, then of course you should expect higher rates of illiteracy in English.
There is another problem: NLI is reporting outdated data. The report I cited is from 2019, not 2024. If we look at the more recent PIAAC results from 2023, we actually find a different number. Unfortunately, the comparable figure in the 2023 study is 28%. However, there were methodological changes to the survey. These include switching to tablets for the survey, expanding the background survey to include languages other than English, and a response rate low enough to trigger a mandatory nonresponse bias analysis. You can read the Technical Notes for more details.
In sum, NLI’s claim has a few problems:
It is outdated—I don’t know why NLI wouldn’t use the most recent data, as it supports the literacy crisis narrative.
It conflates ‘at or below Level 1’ with ‘illiterate,’ which is not the definition used in the study. In fact, NCES says ‘adults classified as below level 1 may be considered functionally illiterate in English.’ That would mean the 2019 illiteracy rate was closer to 8%, not 21%, and that’s still counting those unable to participate.
It includes those who do not speak English (whom we would expect not to be literate in English) but does not state that this is English literacy.
It includes those who possess cognitive or physical disabilities severe enough to prevent them from participating in the survey.
This claim comes from a real statistic, but I have been unable to find sources to support the exact claim that 54% of adults have literacy below a 6th-grade level. (I have found other sites repeating the claim, but I have not found anyone defending the claim.)
I did find the 54% statistic in a document from the Barbara Bush Foundation: Assessing the Economic Gains of Eradicating Illiteracy Nationally and Regionally in the United States. That document says that ‘According to a recent study from the Department of Education, roughly half of U.S. adults, aged 16 to 74 years old — 54% or 130 million people — lack literacy proficiency.’ The report mentioned in that claim is, again, the PIAAC.
By ‘lack proficiency,’ they mean scoring below Level 3 on the PIAAC. So, we’re now dealing with multiple definitions:
Baseline literacy: the ability to write and read simple sentences in everyday life.
Functional literacy: scoring at least Level 1 on the PIAAC.
Being proficient: scoring at least Level 3.
But there is no mention of grade levels in the PIAAC. NLI took the 54% statistic and mapped it to grade levels.
Here’s what the PIAAC FAQ says about grade-level mappings:
The PIAAC skills results (i.e., proficiency levels) do not specifically correspond to measures such as grade levels at school. The PIAAC proficiency levels have a use-oriented conception of competency and focus on describing what types of tasks adults at each level can typically do and their ability to apply information from the task to accomplish goals they may encounter in everyday life; for example, identifying a job search result that meets certain criteria. PIAAC is not designed to measure specific outcomes of schooling, including what students would be expected to learn in a particular grade or skills they would be expected to have mastered before progressing to a higher grade level, such as the ability to read or comprehend a particular text or use certain subskills like alphabetics and vocabulary. Additionally, grade-level equivalents may be unsuitable for characterizing the skills of adults, who often have uneven skill development across different areas.
That number, however, also seems to map onto another claim from NLI.
This 130 million figure has now been transposed to talk about the ability to read simple stories. Since no definition of ‘simple story’ is provided, this is impossible to evaluate. However, if we allow ourselves to temporarily talk about grade levels, I think many kids who don’t read at a sixth-grade level can read simple stories; many kindergartners manage to do it. But perhaps those stories are too simple.
They don’t say, and I can’t know.
However, since the 130 million adults number includes those who possess Level 2 literacy, which includes the ability to read (but, as the OECD notes, to test poorly), this claim is overly broad and false as stated.
This is once again from the Barbara Bush Foundation. They write:
This analysis finds that getting all U.S. adults to at least a Level 3 of literacy proficiency would generate an additional $2.2 trillion in annual income for the country. That is 10% of the gross domestic product.
This is a modeled counterfactual—it is an estimate of income we could make, not costs we presently incur.
I am not going to assess this claim, as I do not possess the relevant knowledge in economics or statistics to evaluate the methodology. I invite someone more knowledgeable than me to check the report and see if the numbers hold up.
To sum up this section: NLI is taking data from multiple sources, presenting it without sourcing, misdescribing the data, and contradicting the sources’ definitions. This is reckless, irresponsible behavior from an organization that claims to care about literacy.
So far, I have focused on popular presentations of literacy data. We’ve seen that most of these presentations are seriously misleading. Do we conclude from that that there is no literacy crisis? Are we doing just fine?
We need to make some distinctions before we answer those questions. So far, we’ve talked about the ‘literacy crisis,’ but we haven’t said what we mean.
We can distinguish between three related problems:
The overall literacy rates. These numbers are not as bad as NLI and the like say, but there is surely room for improvement.
Problems in literacy education. So far, we haven’t discussed this at all.
Building and sustaining a literate culture. This includes getting college students and other adults to read books.
This point is often overlooked—in fact, I overlooked it in my first video on the literacy crisis. I tried to draw a link between whole language learning and the problem of college students not reading books; while there is something to that story, as whole language learning is a discredited methodology for teaching kids to read, it was at best unhelpful to treat these two problems as the same problem. More likely, it hinders our ability to find real solutions to each of the problems.
For (1), my current verdict is that the United States is doing…okay, but that we have substantial room for improvement. The PIAAC uses a 500-point scale, and we can compare the United States to other countries by looking at average scores in the most recent assessment. We can find this in an OECD report on the PIAAC.
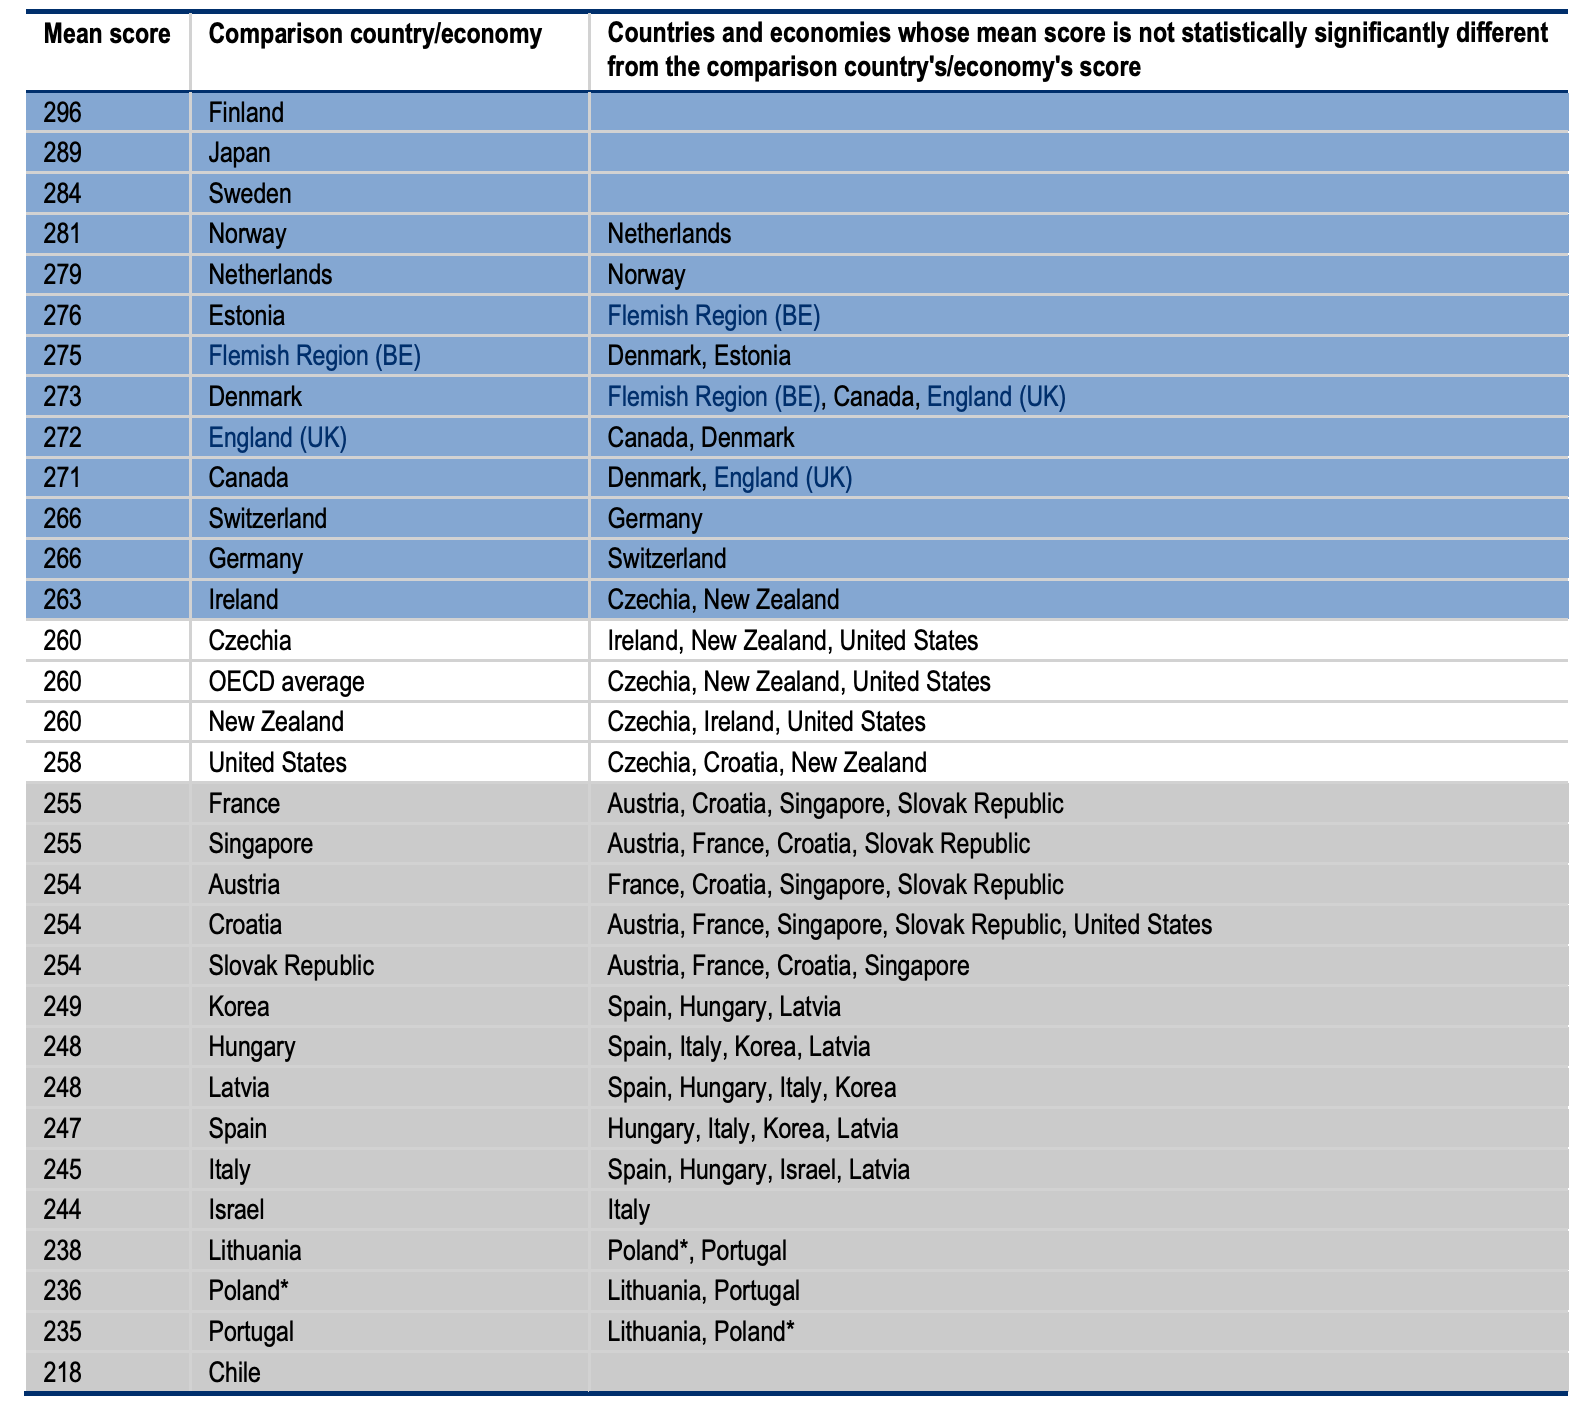
Looking at this table, you will see that the United States is at the OECD average, and that we are not statistically significantly different from Czechia, Ireland, and New Zealand. We are behind some countries that we might consider our peers, like Germany and England, and we are significantly behind Finland, Japan, Sweden, and Norway, all of whom scored over 280.
What is troubling is that, when you compare the 2012/2014 cycle of the PIAAC with the 2023 data, you’ll see that our score went down. Our scores went down primarily in the lowest levels of literacy—so, as with many things in the United States, it is a problem of inequality.
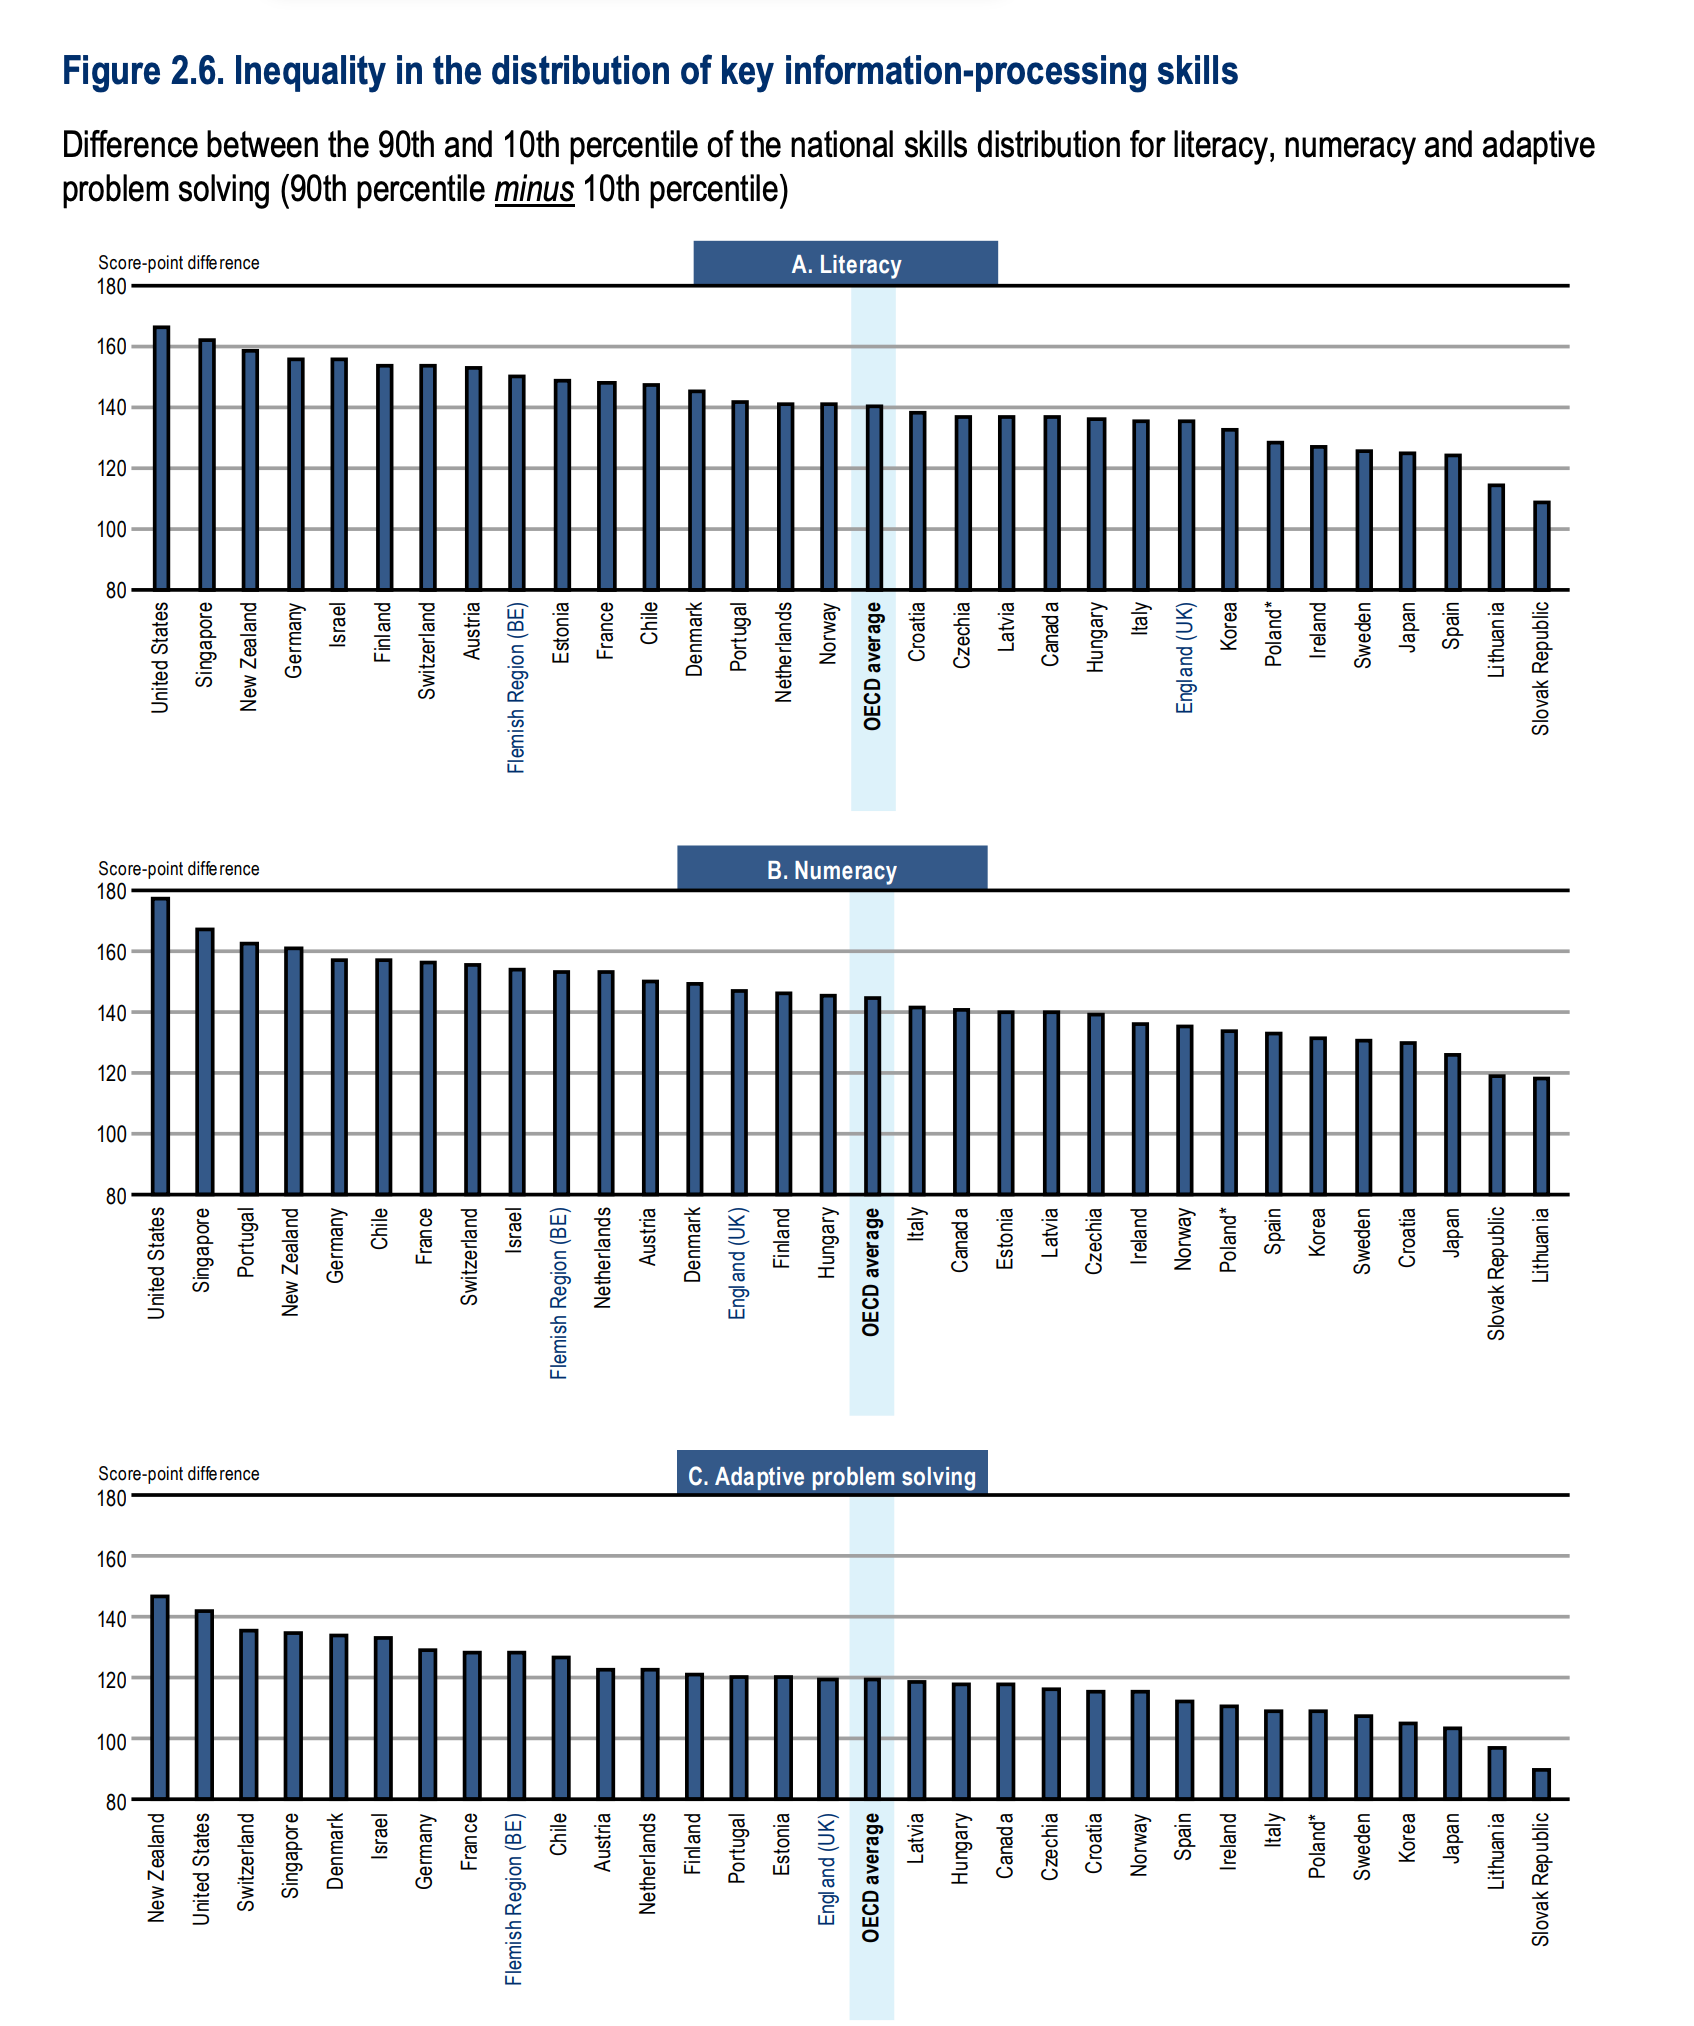
In sum, American literacy is getting worse, but it is getting worse primarily because the gap between highly skilled readers and struggling readers is growing.
For (2), we need to look at other data. While early childhood literacy will surely have an impact on adult literacy, treating it as a separate problem is useful due to the number of available interventions. Namely, if we see declines in early childhood literacy, this could indicate a problem with how we teach reading.
And here is what we know. The National Assessment of Educational Progress is the best, most consistent evaluation we have of how American students are performing. When you look at the trend line for the NAEP, we see a general trend upward, though it is a little shaky—but then after 2020, scores start to go down.
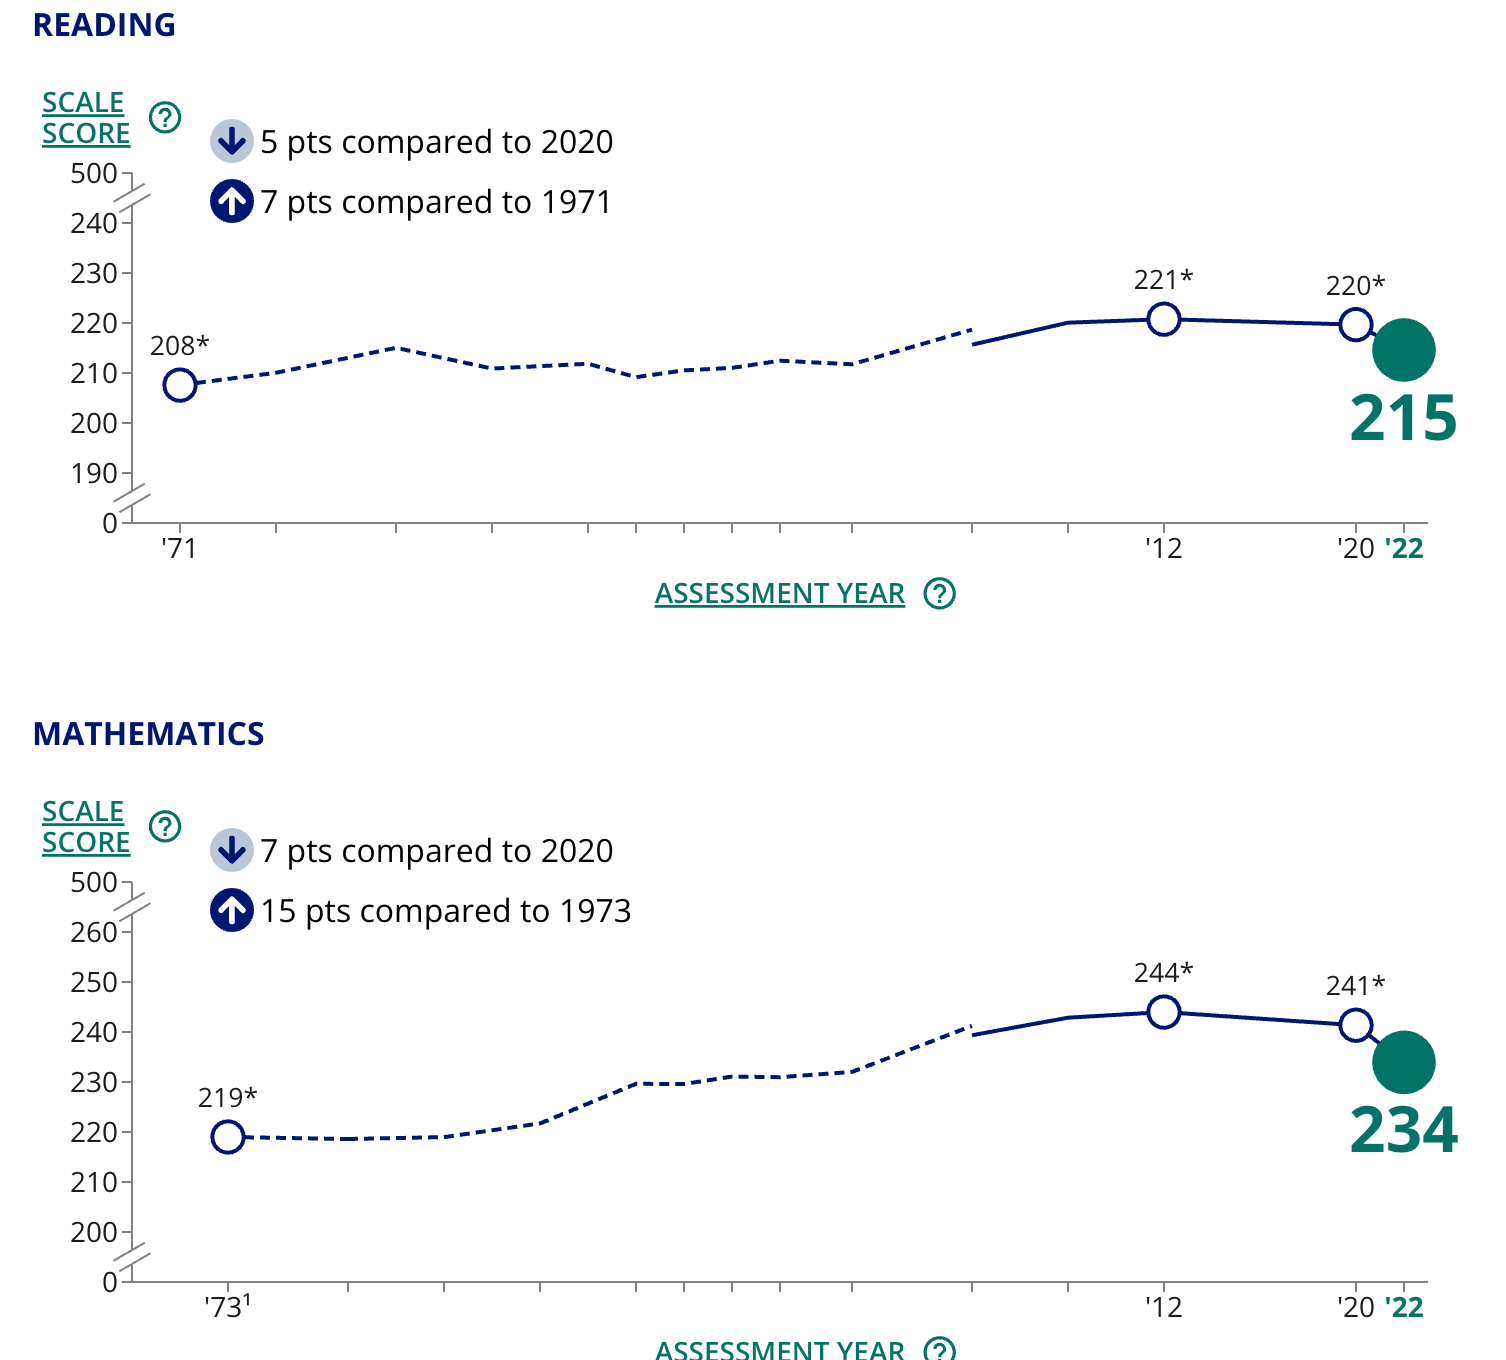
This happened for reading and for mathematics. This leads me to another error I made. I wanted to blame the abandonment of phonics for the decline of reading in the United States, but the NAEP data does not support such a simple story. Despite the lack of phonics, reading scores mostly stayed flat—even during the age of ‘whole language learning.’
The story as I told it in ‘Why everyone stopped reading.’ was oversimplified — so oversimplified that I would say it was false. I said that we used to teach using phonics, but then we switched to whole language learning, and that literacy rates fell. If we treat reading scores on the NAEP as a proxy for literacy, you can see that this causal story is false—the scores remained mostly flat. In a 2000 meta-analysis, the National Reading Panel did find evidence that using phonics was a better way to teach reading, and it seems that the real problem with whole language learning was that it hurt the kids at the bottom the most. We withheld the most effective method from the kids who needed the most help! The averages, however, mostly remained the same. The more recent NAEP declines happened well after some schools decided to reintroduce phonics, and the decline in scores in both reading and mathematics indicates that there is something else going on. (Given the timing, COVID-19 seems like a likely candidate, though the downward trend was already starting in 2019.)
What was also oversimplified was the idea that we only taught phonics before we switched to whole language learning. This is false. There were various competing methods, including ‘look-say,’ which was the subject of Why Johnny Can’t Read. The story of American literacy is not just the story of phonics.
This doesn’t mean that I don’t support phonics. The story of Mississippi’s rise in literacy provides some evidence that phonics-based instruction can improve childhood literacy. But this is partial evidence, and I am now slightly less confident that phonics is the universal solution.

What about (3)? This is the problem of sustaining a literate culture, of getting adults and especially college students to read books.
The canonical article to cite here is from The Atlantic: The Elite College Students Who Can’t Read Books. In this article, Rose Horowitch describes the reporting of professors at various universities, many of whom claim that their students are increasingly incapable of reading books, or at least of reading books at the level and pace previously required.
We are in the realm of anecdote here—I don’t mean to say that this isn’t happening, though. When I taught at the university level, I found it incredibly difficult to get students to read even a single article. I had to radically scale down my expectations, especially for introductory classes. But there are two ways to understand what is happening here:
These students cannot read books.
These students do not read books.
(1) is a very strong claim, and it was the one I previously endorsed based on articles like Horowitch’s. And, if the general decline of reading skills is really happening in the United States, then there may be something to this: more students lack proficiency in reading. But it is unlikely that these students are physically or psychologically incapable of reading these books. They simply aren’t used to doing so.
There is some educational research on the subject. In ‘Two Studies of Reading Compliance Among College Students,’ Sappington et al. report – building on previous work by Burchfield and Sappington – that there has been a general decline in reading compliance amongst college students…since the 1980s. Over time, college students have become less and less likely to complete their assignments.
In her article, Horowitch writes:
But middle- and high-school kids appear to be encountering fewer and fewer books in the classroom as well. For more than two decades, new educational initiatives such as No Child Left Behind and Common Core emphasized informational texts and standardized tests. Teachers at many schools shifted from books to short informational passages, followed by questions about the author’s main idea—mimicking the format of standardized reading-comprehension tests. Antero Garcia, a Stanford education professor, is completing his term as vice president of the National Council of Teachers of English and previously taught at a public school in Los Angeles. He told me that the new guidelines were intended to help students make clear arguments and synthesize texts. But “in doing so, we’ve sacrificed young people’s ability to grapple with long-form texts in general.”
This may still be true! It may be that No Child Left Behind and Common Core made things worse. But this would be an accelerant of the already existing problem, not the root cause. The same could be said for my own preferred explanation: smartphones. Since students did not have smartphones in the 1990s, it cannot be the root of the problem.
We are in the realm of speculation here. It is true that people are reading fewer books—but that is largely a product of the fact that the biggest readers (college graduates, older people, women) have started to read less. They still read, but not as much as they used to. We can’t blame educational initiatives for this, as the timelines don’t line up. What is happening here, I posit, is a general abandonment of literary culture. It is no longer expected that the well-educated continue to read for pleasure; we have Netflix and YouTube now. When I go to a party, I’m more likely to be asked by my friends what shows I’ve been watching—they’re always baffled when I tell them I haven’t watched anything in a long time. Nobody wants to talk with me about the Graham Greene novels I’ve been consuming, and most of them haven’t heard of Graham Greene.
That’s a problem, and it’s a real problem. But I would submit it is a separate problem from the general decline of literacy and the problems of early childhood education. Many of us, myself included, have treated these problems as manifestations of a single problem, which we called the literacy crisis. But this is, in fact, at least three different problems, and we need to solve each of these problems separately.
I will likely make a third video on the subject in light of new information.
A brief editorial note: in early work, I relied on a fact-checking article from a news organization called Verify. They were the first ones to note irregularities in NLI claims. Verify was shut down by its parent company, Tegna, and all pages have been purged. I wish to acknowledge the debt to them, but I cannot properly link or attribute.
No posts
Comments
Nothing yet. Say the first thing.
Sign in to join the conversation.