
Coffee brewing essentially involves hot water flowing through a bed of ground coffee. As water flows, it dissolves soluble flavour compounds out of the ground beans. The quality of a cup of coffee depends on what compounds and aromatics are extracted from the coffee grounds into the cup. A coffee bean is a complex entity with many different compounds that give the coffee its distinct characteristics. Typically coffee grounds contain 30% soluble compounds, remaining part is formed of fibre and other compounds that cannot dissolve in water. Speciality coffee industry define extraction as the fraction of the coffee grounds that is dissolved in water, usually between 18%-23%. This is not just a weird metric, but extraction is found to be correlated with the quality of the brewed cup (aka taste profile of the cup). Which is not hard to believe, if right group of compounds were extracted, we have a great cup. Any departure is sub-optimal. Many factors can influence extraction, notably the temperature of the water (compounds dissolve at varying temperatures) and time (some compounds are fast to dissolve while others can take a while). These relate to the rate of flow of the hot water through coffee grounds which sets the water-coffee contact time and hence extraction. Too much extraction, we have a bitter tasting coffee, and too low extraction, the coffee is watery and weak. We need an optimal extraction.
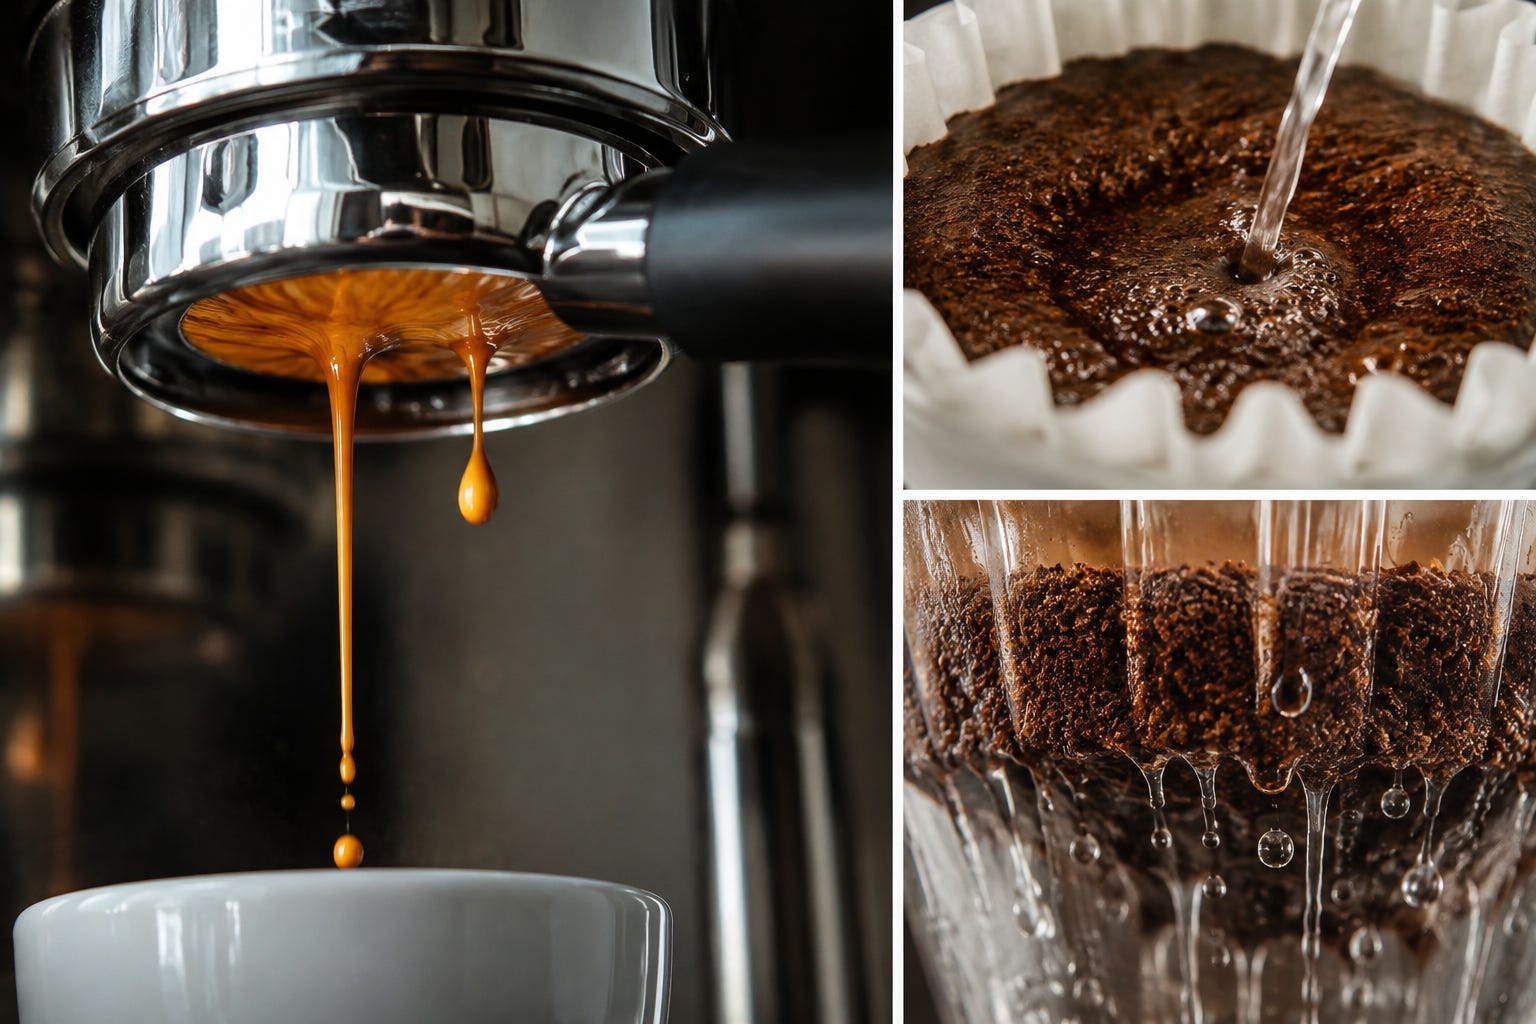
The flow of the water though coffee bed is governed by fluid dynamics, notably it can be modeled as the flow of a fluid though a porous medium. This flow velocity is proportional to the pressure difference pushing the fluid through and is given by the Darcy’s law:
\(q = \frac{-k}{\mu} \nabla p\)
where
qis the flow velocity that is volumetric flow divided by the cross-sectional area, measured in meter/second.μis the viscosity of the fluid defined as the fluid’s resistance to flowing or changing shape. In plain words, it describes how “thick” or “runny” a fluid is.Honey has high viscosity: it flows slowly.
Water has low viscosity: it flows easily.
Air has much lower viscosity than most liquids.
We can think of viscosity as internal friction inside the fluid. Different layers of fluid resist sliding past one another. Measured in Pa·s (pascal-seconds).
kis the permeability of the porous material which is a measure of how easily a fluid can flow though it. Permeability is an intrinsic property of the material that describes how well its network of interconnected pores allow the fluid to pass.A pile of gravel: water flows through very easily → high permeability.
A sponge: water flows, but more slowly → moderate permeability.
Clay: pores are tiny and poorly connected, so water barely moves → low permeability.
The key point is that permeability depends on the geometry of the pore space, not on the fluid. Measured in m² (square meters).
∇pis the pressure gradient. IfLis the thickness of the material, then∇p = Δp / L = (p_top - p_bottom) / Li.e. pressure difference divided by the material thickness. Measured in Pa/m (pascals per meter).
Double the pressure, double the flow. A more viscous fluid needs a larger pressure difference to move at the same speed.
For coffee brewing, the fluid often (there are videos of people using beer, coke, rain water, etc. on social media) used is hot water and we are trying to model the flow-rate though a bed of coffee grounds using Darcy’s equation.
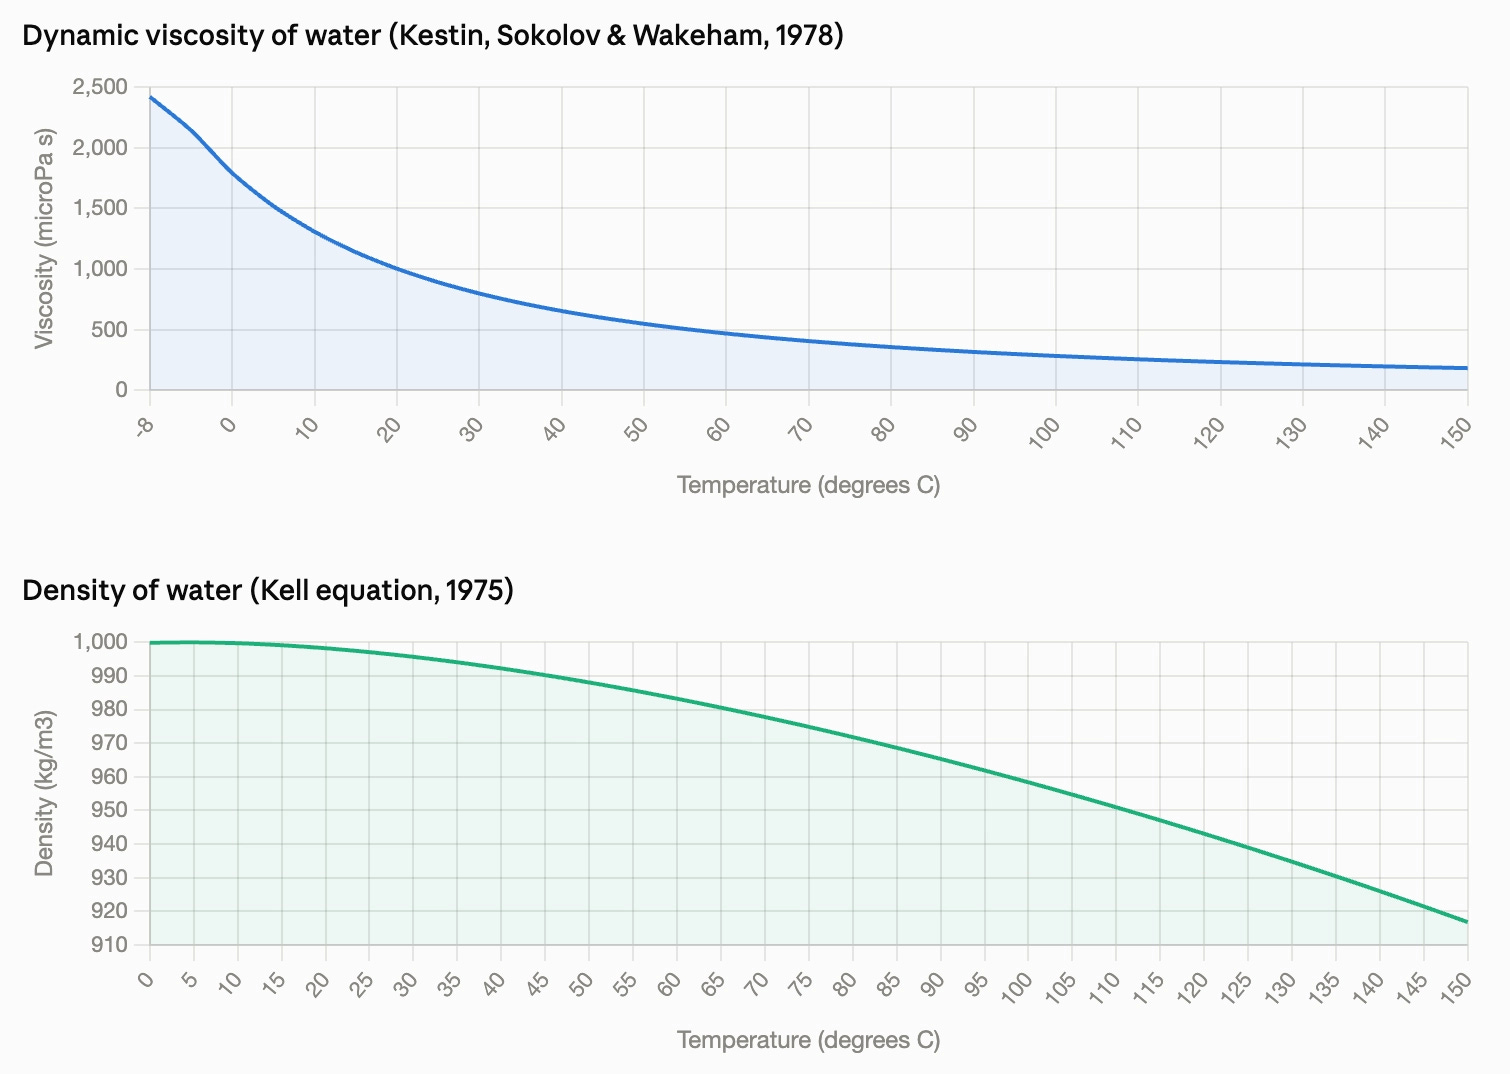
For hot water, we have models to compute viscosity μ and density ρ as a function of temperature:
The pressure gradient can come from various sources e.g. the pressure pump in espresso machines produced the gradient ~ 9-10 bars (10⁵ Pa). In other brewing methods, it could be gravity where the pressure gradient needs more care, as we will see later. The setup and the type of pressure has implications for the brew, we will come back to this later in this series.
To calculate flow-rate using Darcy’s equation, we need the permeability k of the coffee bed as a porous medium. A popular model for k is the Kozeny-Carman equation:
\(k = \frac{\phi^3}{W s^2} \)
where
φ is the porosity of the material defined as the fraction of the material’s volume that is empty or pores. φ
= volume of pores / total volume.More pore volume, easier flow.sis called specific surface area which means the amount of solid surface available relative to the amount of material. For a porous medium, every grain and every pore wall contributes surface area. Fine particles create much more surface area than large particles.s = surface area/ volume. For example, if you break one large rock into thousands of tiny grains, the total amount of solid stays the same, but much more surface becomes exposed. Therefore, the specific surface area increases. More surface area means more contact between the fluid and solid walls, producing greater viscous resistance, thus lower permeability.Wis an adjustable dimensionless constant, typicallyW = 5.
Assuming that the particles forming the porous medium (coffee grains) are spherical with mean radius <r>. Then
\(s = \frac{N * \text{surface area of a particle}}{\text{total volume}} = \frac{N 4 \pi <r>^2}{\text{total volume}} = 4 \pi <r>^2 n\)
where N is the total number of particles and n is number of particles per unit volume of the material.
Further, if φ is the volume of the pores per unit volume, the number of particles per unit volume is (1 - φ) / (volume of a single particle).
\(n = \frac{3(1 - \phi)}{4 \pi <r>^3}\)
and the specific surface area becomes
\(s = \frac{3(1 - \phi)}{<r>}\)
This implies, the permeability can be expressed as:
\(k = \frac{\phi^3 <r>^2}{9 \mathcal{W}(1 - \phi)^2}\)
The porosity of the coffee depends on the packing of the coffee bed (e.g. espresso making involves tight pressing or tamping which reduces porosity) and on polydispersity (variation in the particle sizes). Usually, porosity is between 0.30 and 0.70 for coffee grounds based on empirical data.
We now have a toolkit for flow of hot water though coffee beds. Before adding anything more, let’s run with it, and see where that gets us. Everything below is a few lines of Python (github: januverma/coffee-physics), and nothing in it is specific to coffee yet. These are general statements about water seeping through packed grains.
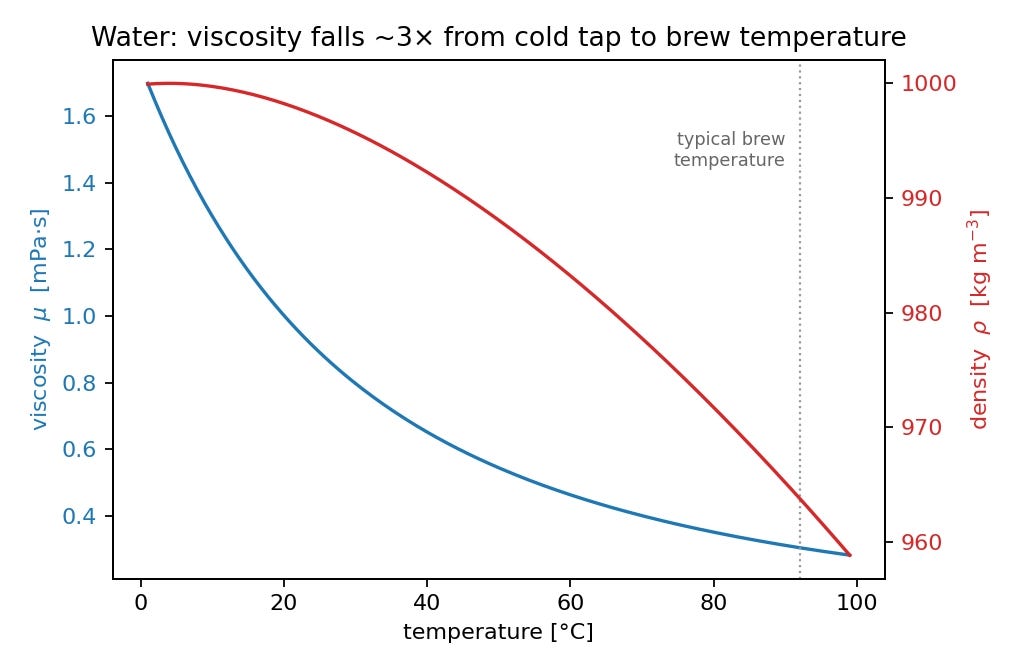
Water first: Plotting μ(T) and ρ(T) shows density barely moves, but viscosity falls by roughly a factor of three between cold tap water and typical brew temperatures. Since Darcy’s law has μ in the denominator, hot water flows through the same bed about three times faster than cold. Temperature is, thus, also a flow variable.
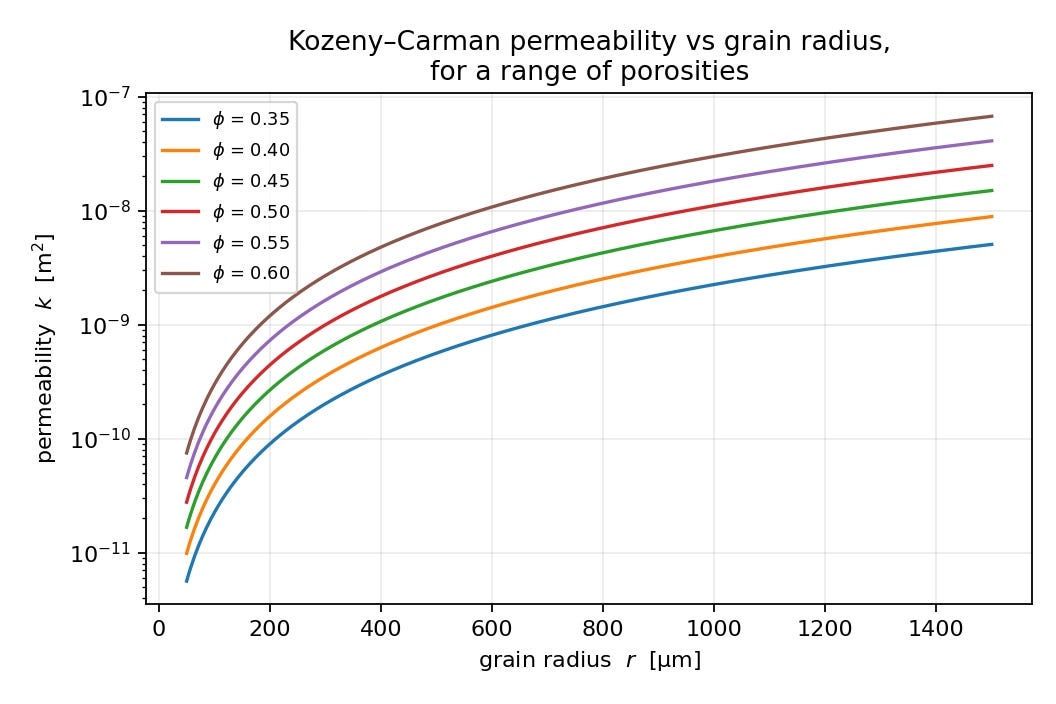
The permeability landscape: Next, the Kozeny–Carman formula we derived, plotted against grain radius for a family of porosities. The picture is smooth and completely intuitive: coarser grains mean wider channels mean higher permeability, always, with the ⟨r⟩² making the effect strong.
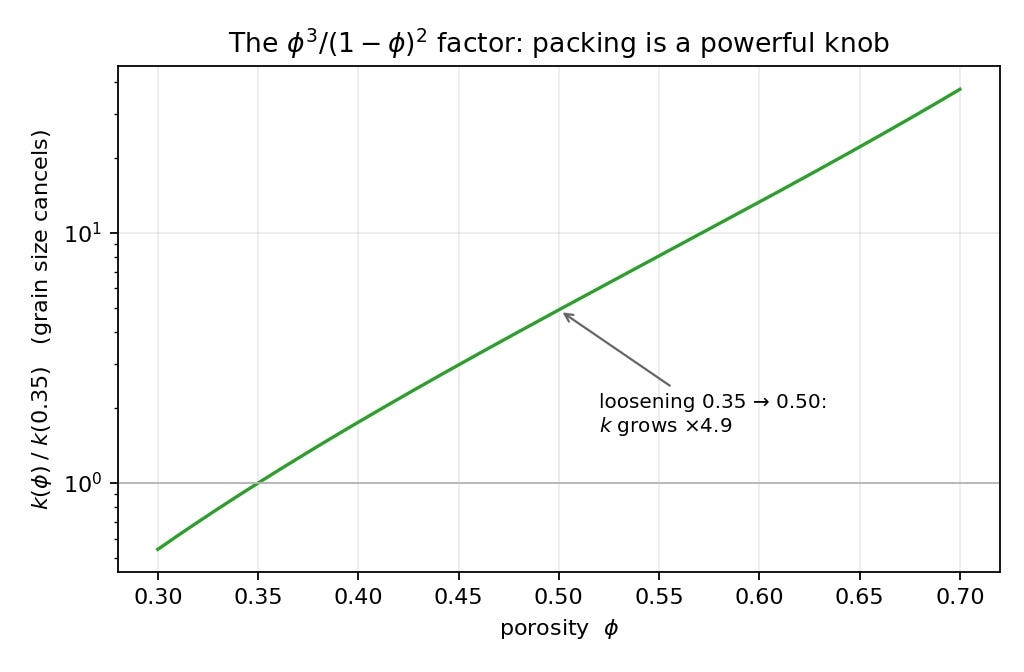
The porosity knob. A nice feature of the formula is that if we ask only about ratios, the grain size cancels: k(φ)/k(φ_0) depends on porosity alone. Plotting it reveals how brutally steep the φ³/(1−φ)² factor is, loosening a bed from φ = 0.35 to φ= 0.50 multiplies the permeability by almost five. How tightly the grains are packed is at least as powerful a knob as how big they are.
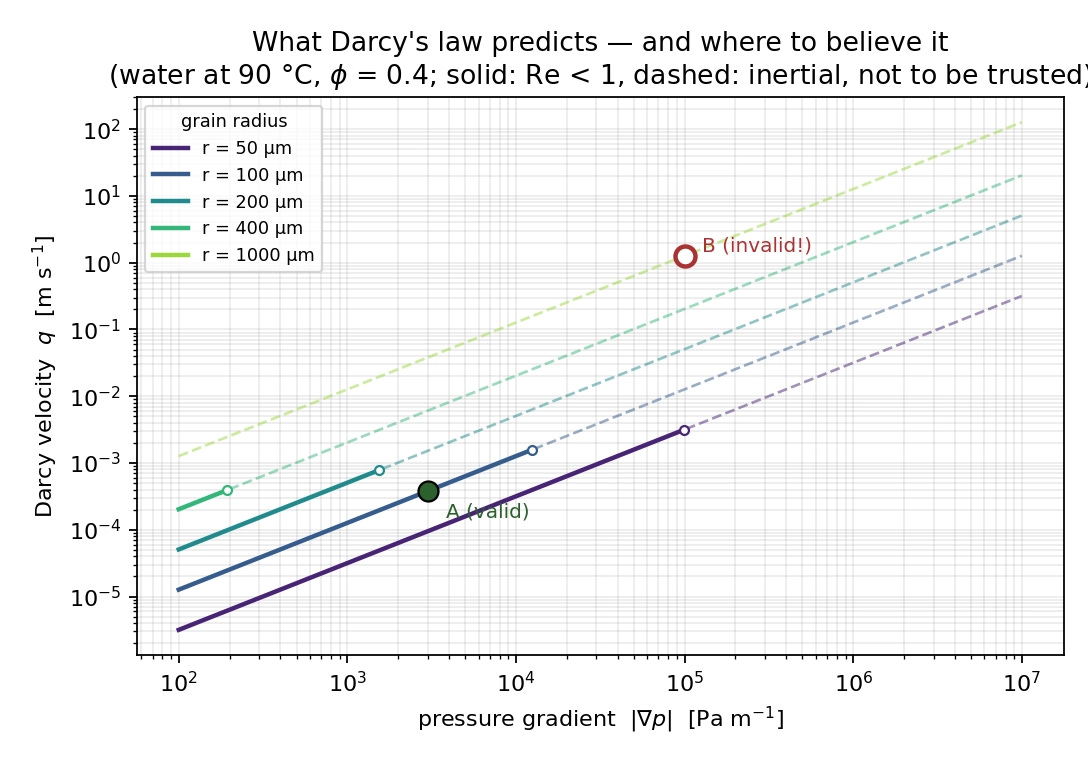
Consider fine coffee grounds (<r> = 100 µm) form a coffee bed of thickness 1 cm and φ = 0.4. When hot water (90 °C) is pushed gently (pressure 30 Pascal) through it, the model gives k ~ 4.0 x 10⁻¹¹ m² and q ~ 3.8 x 10⁻⁴ m/s.
While coarser coffee grounds (1 mm) with same porosity (φ = 0.4) form a bed of thickness 2 cm, when pushed hard (2000 Pascal pressure), gives q ~ 1.3 m/s.
But there is a problem. Darcy’s law is valid for slow creeping flow what physicists call non-inertial domain. Push the fluid fast enough, inertial factors appear. In plain words:
Non-inertial physics means motion is controlled mostly by immediate resistance. Stop pushing, and the motion stops almost immediately.
Inertial physics means the moving material carries momentum. Even after the push changes or stops, its previous motion still matters.
In inertial flow, the fluid has enough momentum that effects like acceleration, deceleration, and changes of direction through the pore network become important. This happens for example when velocity is higher, pores or channels are larger, the fluid density is high etc.
So to accurately describe the physics of the coffee brewing, we need to infer which domain we are in. The Reynolds number is the ratio of two competing influences on a moving fluid:
inertia (the fluid’s tendency to keep doing what it’s doing)
viscosity (its tendency to be dragged into agreement with its surroundings).
Formally, it comes from comparing the sizes of two terms in the Navier–Stokes equation. The inertial term scales as
ρq²/L(momentum flux changing over a distance L), the viscous term asμq/L²(shear stress diffusing over the same distance). Divide one by the other and the equation hands usRe = (inertial stresses)/(viscous stresses)which becomes:
\(Re = (\rho q^2 / L) / (\mu q / L^2) = \rho q L / \mu\)
Re≪1 means the viscous assumption holds; Re » 1 means it doesn’t.
Re is a scale-comparison tool: you must decide at what scale you’re comparing inertia to viscosity. For a river you’d take the depth; for an airplane wing, the chord; for blood in a capillary, the vessel diameter. Same formula, wildly different numbers, each answering “is flow at this scale viscous-dominated or inertia-dominated?”
For porous media, the relevant scale is the pore, L=2 <r>, the diameter of the grain.
\(Re = 2 \rho q <r>/ \mu\)
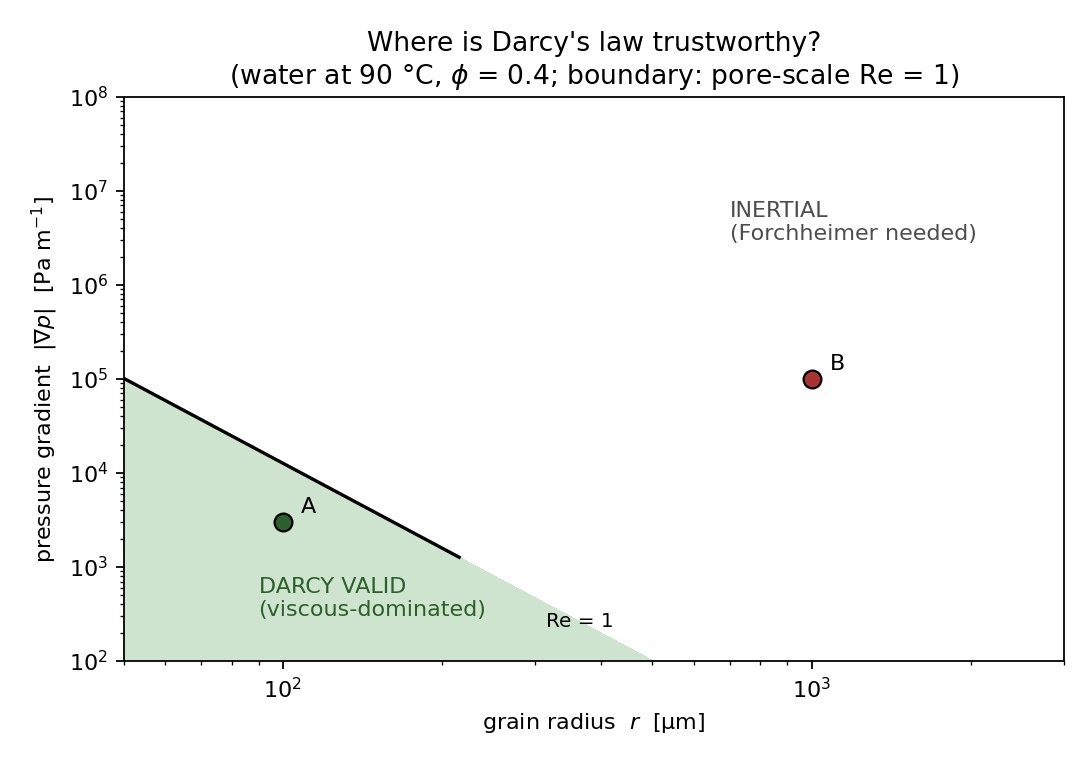
Going back to our cases, for gently pushed water through fine grounds, Re ~ 0.24, comfortably viscous. But for the high pressured push through coarse grounds, Re ~ 8000 which means the confident-looking velocity prediction is the output of an equation used outside its jurisdiction.
Often the Darcy’s law is written as:
\(\nabla p = \frac{-\mu}{k} q\)
In the inertial domain, the pressure drop is no longer proportional only to velocity, but
\(\nabla p = \frac{-\mu}{k} q - \frac{\rho}{k_I} |q|q\)
This is called Forchheimer equation. The second term is the inertial loss, governed by a second material property k_I the inertial permeability.
Physically, as fluid passes through a porous medium, it repeatedly: narrows into pore throats, expands into pore bodies, bends around solid grains, accelerates and decelerates. The fluid has to accelerate and decelerate as it moves around particles and through narrow throats that costs extra pressure. At low velocity, these changes happen gently, so viscosity controls the resistance. At higher velocity, the fluid’s momentum makes these changes costly. More pressure is required to force the fluid through the same pore network.
A dimensionless quantity called Forchheimer number is defined as the ratio of the two terms:
\(F_0 = \frac{\rho k q}{\mu k_I}\)
for F_0 ≪ 1, Darcy's law is exact and the inertial factors can be ignored. But F_0 ~ 1 we are well in inertial domain.
The inertial permeability is often modeled as a function of the permeability. We won’t discuss any details here. Measured in m (meters).
So the toolkit runs, and it speaks confidently. Whether it speaks truly is a
different question that requires real coffee, and real data.
Until recently no validated model connected k to what a coffee maker actually controls. Prior quantitative treatments of brewing flow leveraged pore-scale simulation of espresso microstructure, drip-brewing models built on assumed literature permeabilities, and careful enthusiast analyses of filter-brew hydraulics. In a recent work, Wadsworth et al proposed the first constitutive model validated against measured coffee microstructure. They took two roasted coffees (a Rwandan and a Colombian), ground each at eleven settings from fine to coarse, and measured their properties empirically.
Particles are made to fall past two high-speed backlit cameras, each particle is photographed, binarized, and assigned the radius. So the mean radius is measured photographically on dispersed loose particles.
Put the coffee beds into an X-ray micro-tomography scanner, resolving the true three-dimensional pore network at a few microns. This allowed them to calculate the porosity and the specific surface area of the coffee beds.
Measuring the permeability of fine coffee in a lab permeameter is deceptively hard. We need a screen to keep the grains out of our setup, and any screen fine enough to hold coffee back is less permeable than the coffee itself, and thus, the screen would dominate the measurement. So instead of pushing water through the beds, they pushed simulated fluid through the exact scanned geometry and read off the permeability.
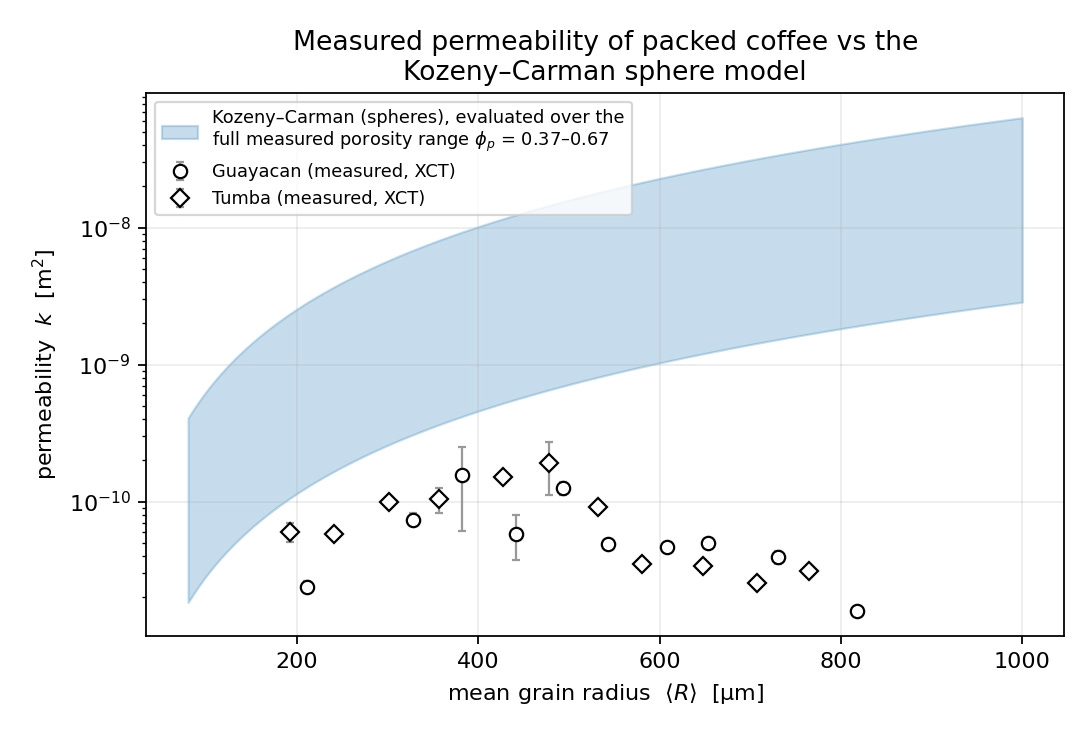
With the data collected by Wadsworth et al, we can ask how well it matches with our model of permeability given by Kozeny-Carman formula. Below plot shows the model predicted permeabilities as a band covering the entire measured
porosity range with the actual observed permeabilities of the 21 real beds.
This misses in two ways:
Wrong magnitude. The data sits below the model band everywhere. The
over-prediction is typically a factor of~50, under ten at the finest grinds, several hundred at the coarsest.Wrong trend. The model’s one confident, intuitive claim was “coarser is more
permeable, always” (clean⟨r⟩²). The data disagrees: measured permeability rises, flattens, peaks somewhere near⟨r⟩ ~ 500 µm, and then falls for coarser grinds. Grinding coarser can make a coffee bed less permeable.
Since the tomography measured the surface area directly without assumptions on the shape of the grains, we can do a simple experiment: keep Kozeny–Carman exactly as it is, but feed it the measured surfaces instead of the sphere formula.
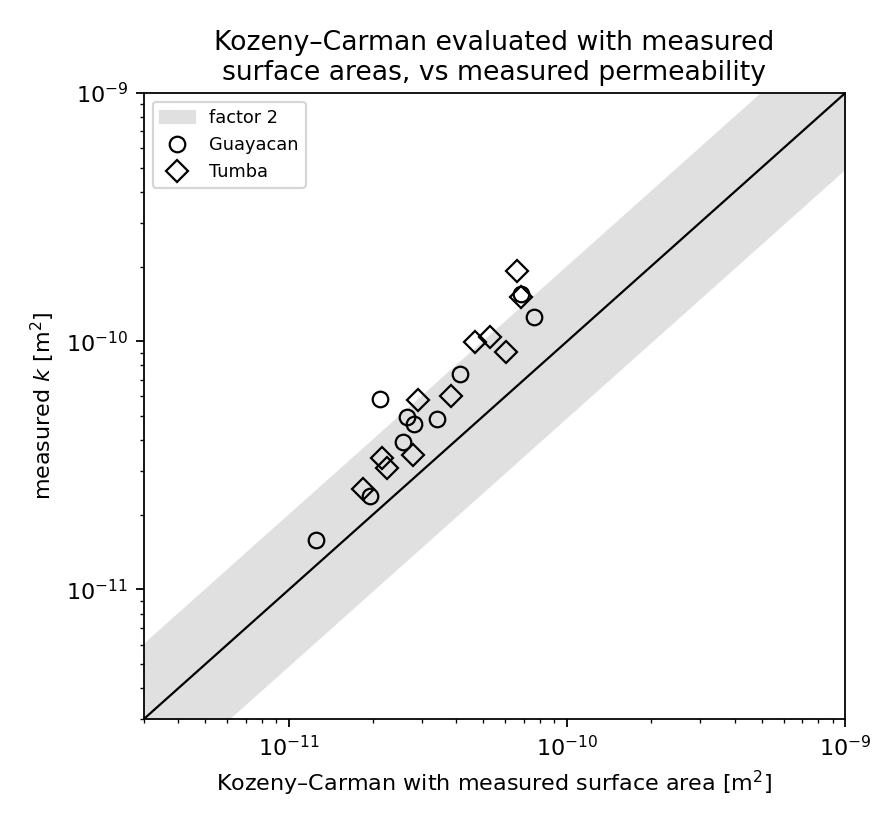
The result is striking: the fifty-fold discrepancy collapses. Prediction and measurement now agree within a factor of about two across all 21 beds. Both coffees, all grinds, the peak-and-decline trend included. This challenges the smooth spherical assumption for the shape of the coffee grains.
The 3d geometry of coffee particles can be quite complex. Wadsworth et al proposed a correction to accommodate the angularity of the coffee particles. Their model introduces as factor which is exponential in radius.
\(s = \frac{3(1 - \phi)}{<r>} \exp(\alpha <r>)\)
where α is a parameter tuned using observed data. The fitted value is α ≈ 4.8×10³ m⁻¹. This means that at lower radius, the particle angularities are minimal and they can be modeled as spheres.
We can test this model: divide the measured surface area by the sphere prediction, bed by bed, and plot the ratio against grain size.
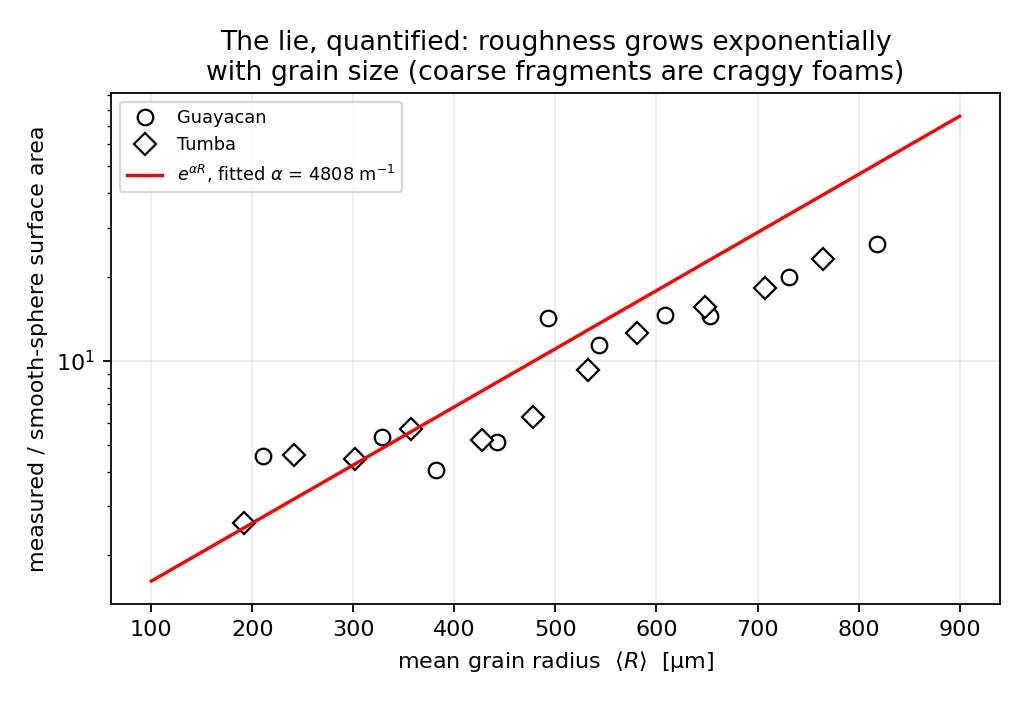
And since Kozeny–Carman has s² in the denominator, surface growing exponentially with r will eventually beat the ⟨r⟩² in the numerator which is precisely why the permeability peaks and falls. The crossover sits at ⟨r⟩ = 1/α ≈ 208 µm, the model's intrinsic peak scale at fixed porosity (the data cloud appears to peak later, near 500 µm, because each bed sits at its own porosity).
With this correction, the Kozeny–Carman permeability of the coffee bed can be modeled as:
\(k = \frac{\phi^3 <r>^2}{9 W(1 - \phi)^2} \exp(-2 \alpha <r>)\)
There is still a factor of 2 between observed and model permeabilities.
It is worth pointing out at this point that the Kozeny-Carman model is not sufficient and is usually tweaked to reflect the empirical evidence. For example, just knowing the volume of pores doesn’t seem sufficient, the flow paths can be winded or indirect (known as tortuosity) which depends on the distribution of pores. At the end, what is required is for a path to exist all the way through the material. This local connectedness to global pathways is studied as percolation theory and we have the percolation theory model for permeability:
\(k_{percolation} = \frac{2(1 - \phi_p) \phi_p^b}{s_p^2}\)
The pore space made of connected pores is relevant here and the isolated pores can be ignored. Thus we replace porosity φ in the Kozeny-Carman equation with percolating porosity φₚ which is the fraction of the volume made up of pores that are connected across the material, so the fluid can travel. And sₚ is the percolating specific surface area. The exponent b=4.4 is the theoretical value.
Wadsworth et al proposed using the percolation theory model for permeability, especially for densely packed coffee bed.
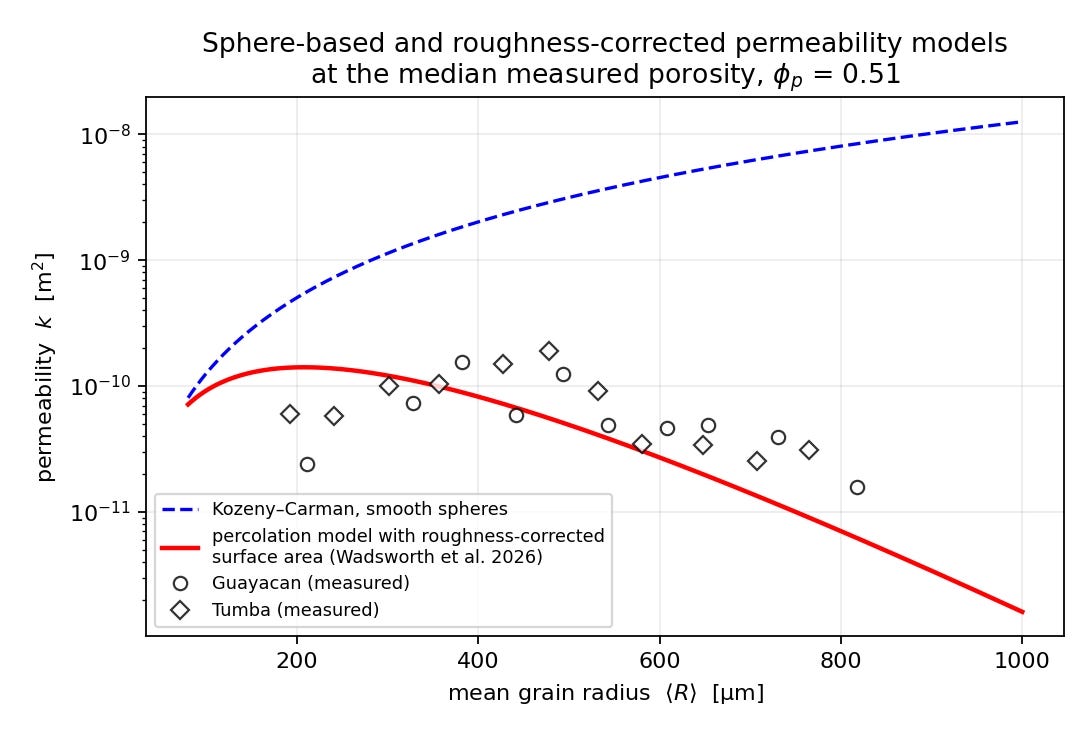
\(k_{\text{coffee bed}} = \frac{2 <r>^2 \phi_p^b}{9 (1 - \phi_p)}\exp(- 2 \alpha <r>)\)
This models the observed data much more faithfully as read from the below plot.
The radius of the coffee grains depends on the setting of the grinder used. A burr grinder’s setting controls the physical gap between the burr faces, and particles exit once they are small enough to pass the gap. So the maximum surviving size is set geometrically by the gap, and if the gap varies linearly with the dial (which is how the mechanisms are built), the size scale of the output tracks it linearly too. The paper makes exactly this argument. They measured full particle-size distributions for every grind setting and found the mean grain radius tracks the grinder dial linearly.
\(<r> = \beta G + r_0\)
β = (4.3505 ± 0.0077)×10⁻⁵ m per setting and r₀ = (1.0160 ± 0.0053)×10⁻⁴ m. That is each click of their Mahlkönig coarsens the mean radius by ~43.5 µm, starting from an extrapolated ~102 µm at G = 0.
Worth noting that it is a calibration of one machine, not a law. The numerics here belong to that specific Mahlkönig grinder, its burr set, alignment, wear state, and the manufacturer's arbitrary dial numbering. A different grinder (or the same grinder after burr wear) has a different line; some grinders aren't even linear if their adjustment mechanism is not. Having said that, it is the one part of the framework every reader can replicate at home: sieve a few doses at a few settings, plot mean size vs dial, fit a line, and you have performed the same calibration with kitchen equipment, your β and r₀ then personalize the entire model to your machine.
Nevertheless the linear form is a reasonable default for burr grinders. With this, the expression for permeability translates to:
\(k_{\text{coffee bed}} = \frac{2 (\beta G + r_0)^2 \phi_p^b}{9 (1 - \phi_p)}\exp(- 2 \alpha (\beta G + r_0))\)
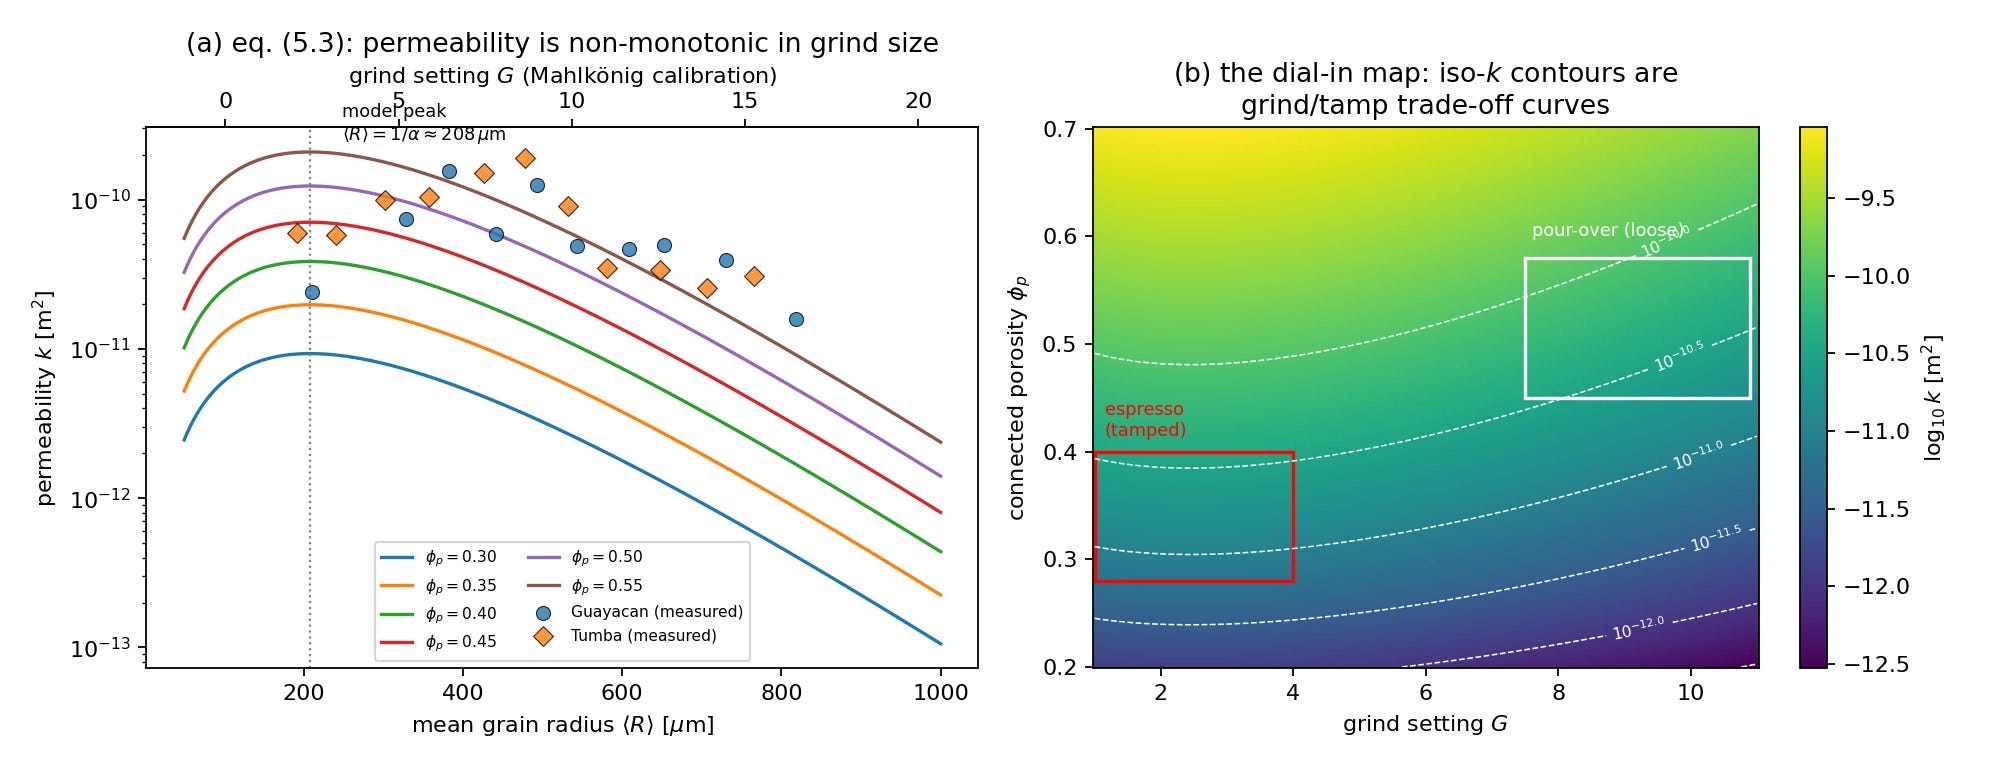
The model we now hold knows nothing about brewing methods; it's a property of ground coffee, full stop. A brewing method is a set of boundary conditions we impose on it: a pressure, a geometry, a schedule.
Wadsworth et al framed their work around espresso making where the commercial espresso machines push hot water with high pressure (9 × 10⁵ Pa) through a tamped (tightly packed) bed of fine coffee grounds (called coffee puck) in a basket of standard 58 mm diameter, and the flow settles into a steady state. Espresso is the simplest possible use of this model, dynamically speaking. No time dependence, no changing water levels: just Darcy’s law as algebra.
One caution: the 21 beds the model was validated on were loose, untamped coffee with connected porosities of φₚ ~ 0.37-0.67, most near 0.5. A tamped espresso puck sits at roughly φₚ ~ 0.30–0.40 which is below the entire validated range. So espresso, the model’s advertised application, is actually an extrapolation — and this is precisely where the percolation form earns its keep over Kozeny–Carman, because the two laws agree at high porosity and diverge at low.
Let us predict an espresso shot from first principles. Take a standard recipe: an 18 g dose, ground fine (grind setting G = 2 on the paper’s calibration), tamped to φₚ = 0.30, 9 bar of pressure, aiming for 40 g of liquid in the cup.
Grind setting to grain size.
<r> = β * 2 + r₀ ≈ 189 µm.Grain size and porosity to permeability. The model gives
k ≈ 9×10⁻¹² m².Dose to puck thickness. Mass conservation: the dose, at porosity φₚ and a grain density of about 1330 kg/m³, fills the 58 mm basket to a depth
L ≈ 7mm, which matches a real puck.Darcy's law.
q=k Δp/(μL) ≈ 3.8 m/s, and at that flux the 40 g target passes through the puck in about 4 milliseconds.
But a real espresso shot takes 25 to 35 seconds. The prediction is wrong by a factor of several thousand.
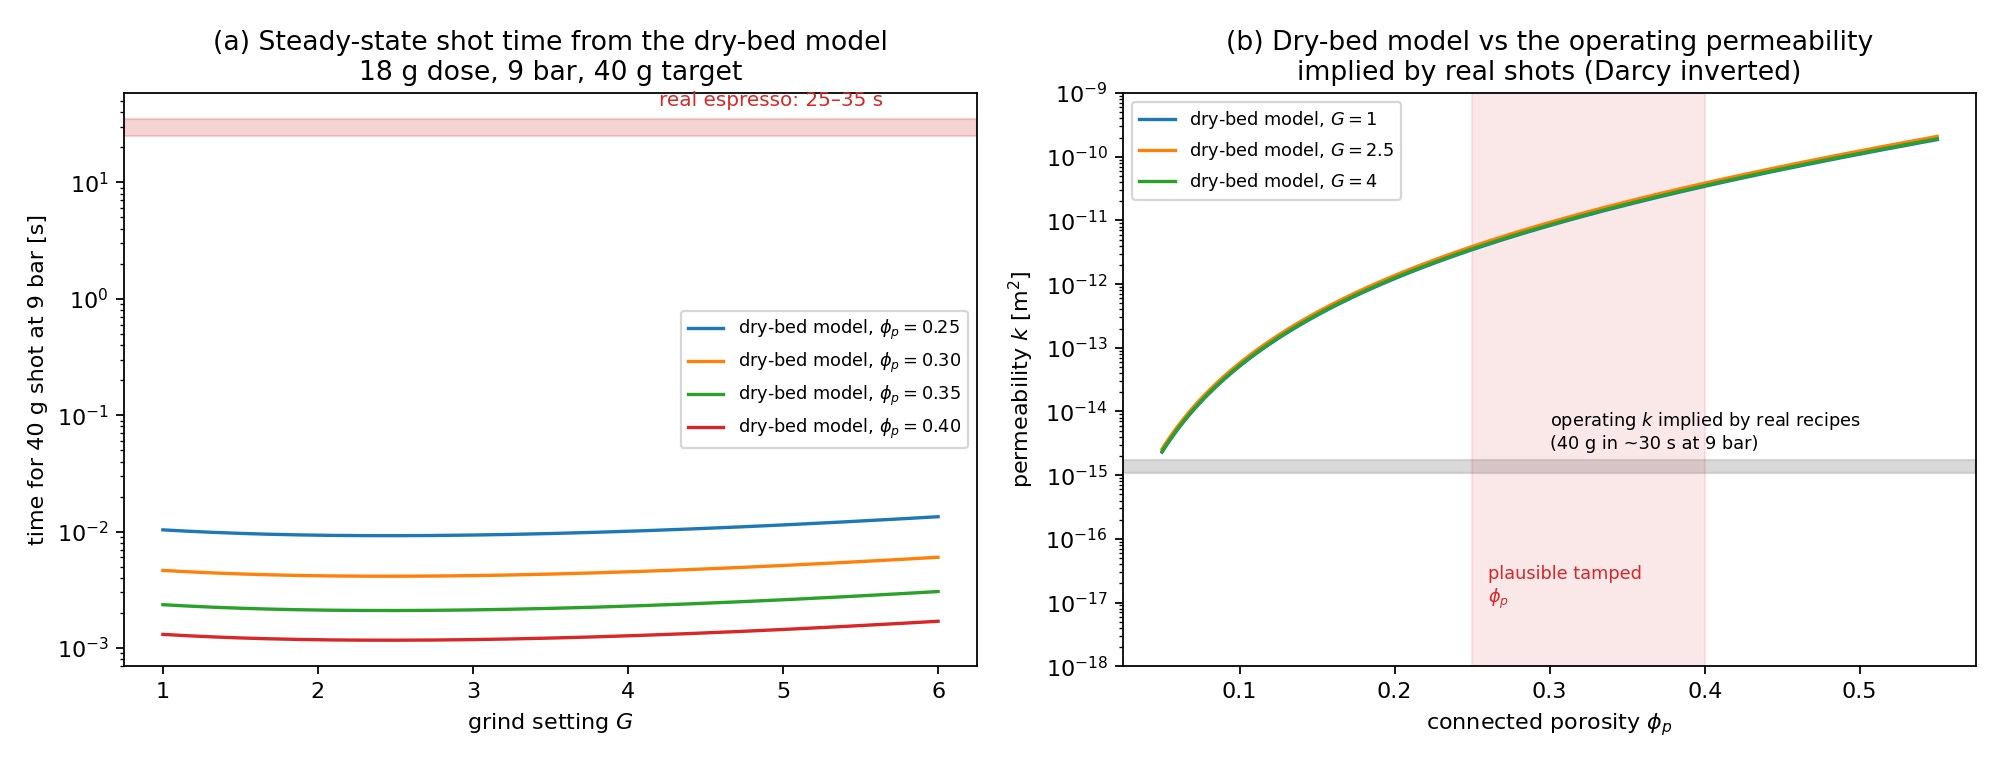
The choice of porosity cannot rescue this. Repeating the calculation across the entire defensible tamped range, φₚ = 0.25-0.45 , predicts shots of 0.7 to 9 milliseconds.
We can measure how wrong, using nothing but Darcy's law run backwards. A real shot: 40 g in 30 s through a 7 mm puck at 9 bar which implies an operating permeability of:
\(k_{\text{operating}} = \frac{q \mu L}{\Delta p} \approx 1.4\times10^{-15}\)
The model predicted ~ 10⁻¹². The bed an espresso machine actually pushes water through is three to four orders of magnitude less permeable than the bed the model describes. Could packing account for it? Solving the model for the porosity that would give the operating permeability returns φₚ ≈ 0.04, a bed that is 96 % solid, which no granular packing can achieve. Porosity cannot close this gap.
Could inertia be the missing physics? After all, our predicted flux is exactly the kind of number we are taught us to distrust. At q ≈ 3.8 m/s through 190 µm grains, the pore-scale Reynolds number is about Re ≈ 5×10³ — this is the coarse-bed, hard-push case from the toolkit all over again, and the honest move is to take back the Darcy answer and solve the full Forchheimer equation instead. Doing so (with the empirical closure for k_I) slows the predicted shot from 4 milliseconds to about 38 milliseconds — a real correction, a factor of nine, with the flow now genuinely inertia-limited. And the real shot is still roughly eight hundred times slower. Inertia closes one decade of the gap; three decades remain, and they cannot belong to the flow law.
The resolution is that the model and the machine are describing two different objects. The model was validated on drycoffee: dry grounds, scanned in air, with simulated air flowing through them. A puck mid-shot is a different material. Its grains have absorbed water and swollen — measurements suggest up to ~30% by volume. The 9-bar pressure drop is also mechanically compacting the bed, squeezing the solid skeleton into the basket. The finest particles migrate downstream and clog the exit. Solubles dissolve — a fifth of the dose leaves during the shot — softening surfaces and thickening the pore fluid. Every one of these processes narrows the pores, and with permeability scaling as φₚ^4.4, small losses of pore space are amplified brutally. None of this is in the model, and to be fair, none of it was claimed to be.
What our simulation has done is measure the combined size of everything the dry-bed picture leaves out: define the wet-bed factor
\(\Gamma = \frac{k_{dry}}{k_{operating}} \)
and for espresso, Γ ≈ 10³ (about 7000 for the recipe above). That single number is the distance between the validated physics and a working espresso machine, and to my knowledge no one has cleanly decomposed it into its parts — swelling, compaction, fines, dissolution.
Having said that, the relative predictions survive the gap, the model still tells you how much a one-step grind change or a looser tamp should move your shot time, even while the absolute number is off by thousands. Further, the gap itself is now a well-posed quantity. One measured shot calibrates Γ for our setup, and with it, the model becomes predictive again. The proposal in Wadsworth et al.'s own closing pages, of choosing a grind setting a priori to hit a target mass in a target time, needs exactly one honest fudge factor, and we now know its name and size.
Anything that changes the mean grain radius changes the permeability, steeply, so staling matters (oxidised coffee grinds differently), and swelling matters most of all, the model amplifies even modest swelling into order-of-magnitude permeability changes. It is arguably the single most consequential unmeasured number in espresso.
Fines migration turns the puck into a layered medium — a fines-clogged floor under a depleted upper bed — whose composite permeability follows the harmonic mean of its layers, which is dominated by the worst layer; a quantitative fines-transport model is still missing.
And real shots are not steady: pre-infusion, pressure profiling, CO₂ escaping the grounds, and the bed evolving under load all call for the time-dependent version of Darcy’s law, integrating the flow as the puck changes beneath it.
The dry theory of espresso is in good shape. The wet bed is the frontier.
All codes are on github: januverma/coffee-physics
This is part I of the series on science of coffee brewing. In the next, we will talk about pour-over methods and see how the physics change.
If you find this post useful, please cite it as:
No posts
Comments
Nothing yet. Say the first thing.
Sign in to join the conversation.