
(NB. If you would like a similar analysis conducted for your state or university, feel free to contact me to discuss consulting fees.)
At The Nuzzo Letter, I previously published two data briefs on the female:male ratio in undergraduate admissions at universities in the United States (U.S.). The first data brief focused on four major technical universities in the U.S.: California Institute of Technology (Caltech), Carnegie Mellon University, Georgia Institute of Technology (Georgia Tech), and Massachusetts Institute of Technology (MIT). The second data brief focused on eight Ivy League universities and six Ivy League “adjacent” universities.
The current data brief builds on these two data briefs by focusing on all universities in one state’s higher education system: North Carolina. One reason why I chose North Carolina is because the Martin Center for Academic Renewal is based in North Carolina, and the Martin Center published a policy brief earlier this year titled: “Where are all the men? A look at male vs. female postsecondary enrollment in North Carolina.” I also chose North Carolina for personal reasons. I lived in North Carolina for two years while completing my Master’s degree at Appalachian State University between 2006 and 2008.
The North Carolina universities included in the current analysis are:
Appalachian State University (Boone, NC)
East Carolina University (Greenville, NC)
Elizabeth City State University (Elizabeth City, NC)
Fayetteville State University (Fayetteville, NC)
North Carolina A & T University (Greensboro, NC)
North Carolina Central University (Durham, NC)
North Carolina State University (Raleigh, NC)
University of North Carolina at Asheville (Asheville, NC)
University of North Carolina at Chapel Hill (Chapel Hill, NC)
University of North Carolina at Charlotte (Charlotte, NC)
University of North Carolina at Greensboro (Greensboro, NC)
University of North Carolina at Pembroke (Pembroke, NC)
University of North Carolina at Wilmington (Wilmington, NC)
University of North Carolina School of the Arts (Winston-Salem, NC)
Western Carolina University (Cullowhee, NC)
I acquired the relevant data from the National Center for Education Statistics’ Integrated Postsecondary Education Data System (IPEDS). I extracted data on the number of male and female applicants and admittees each year from 2001 (earliest year data are available) to 2024.
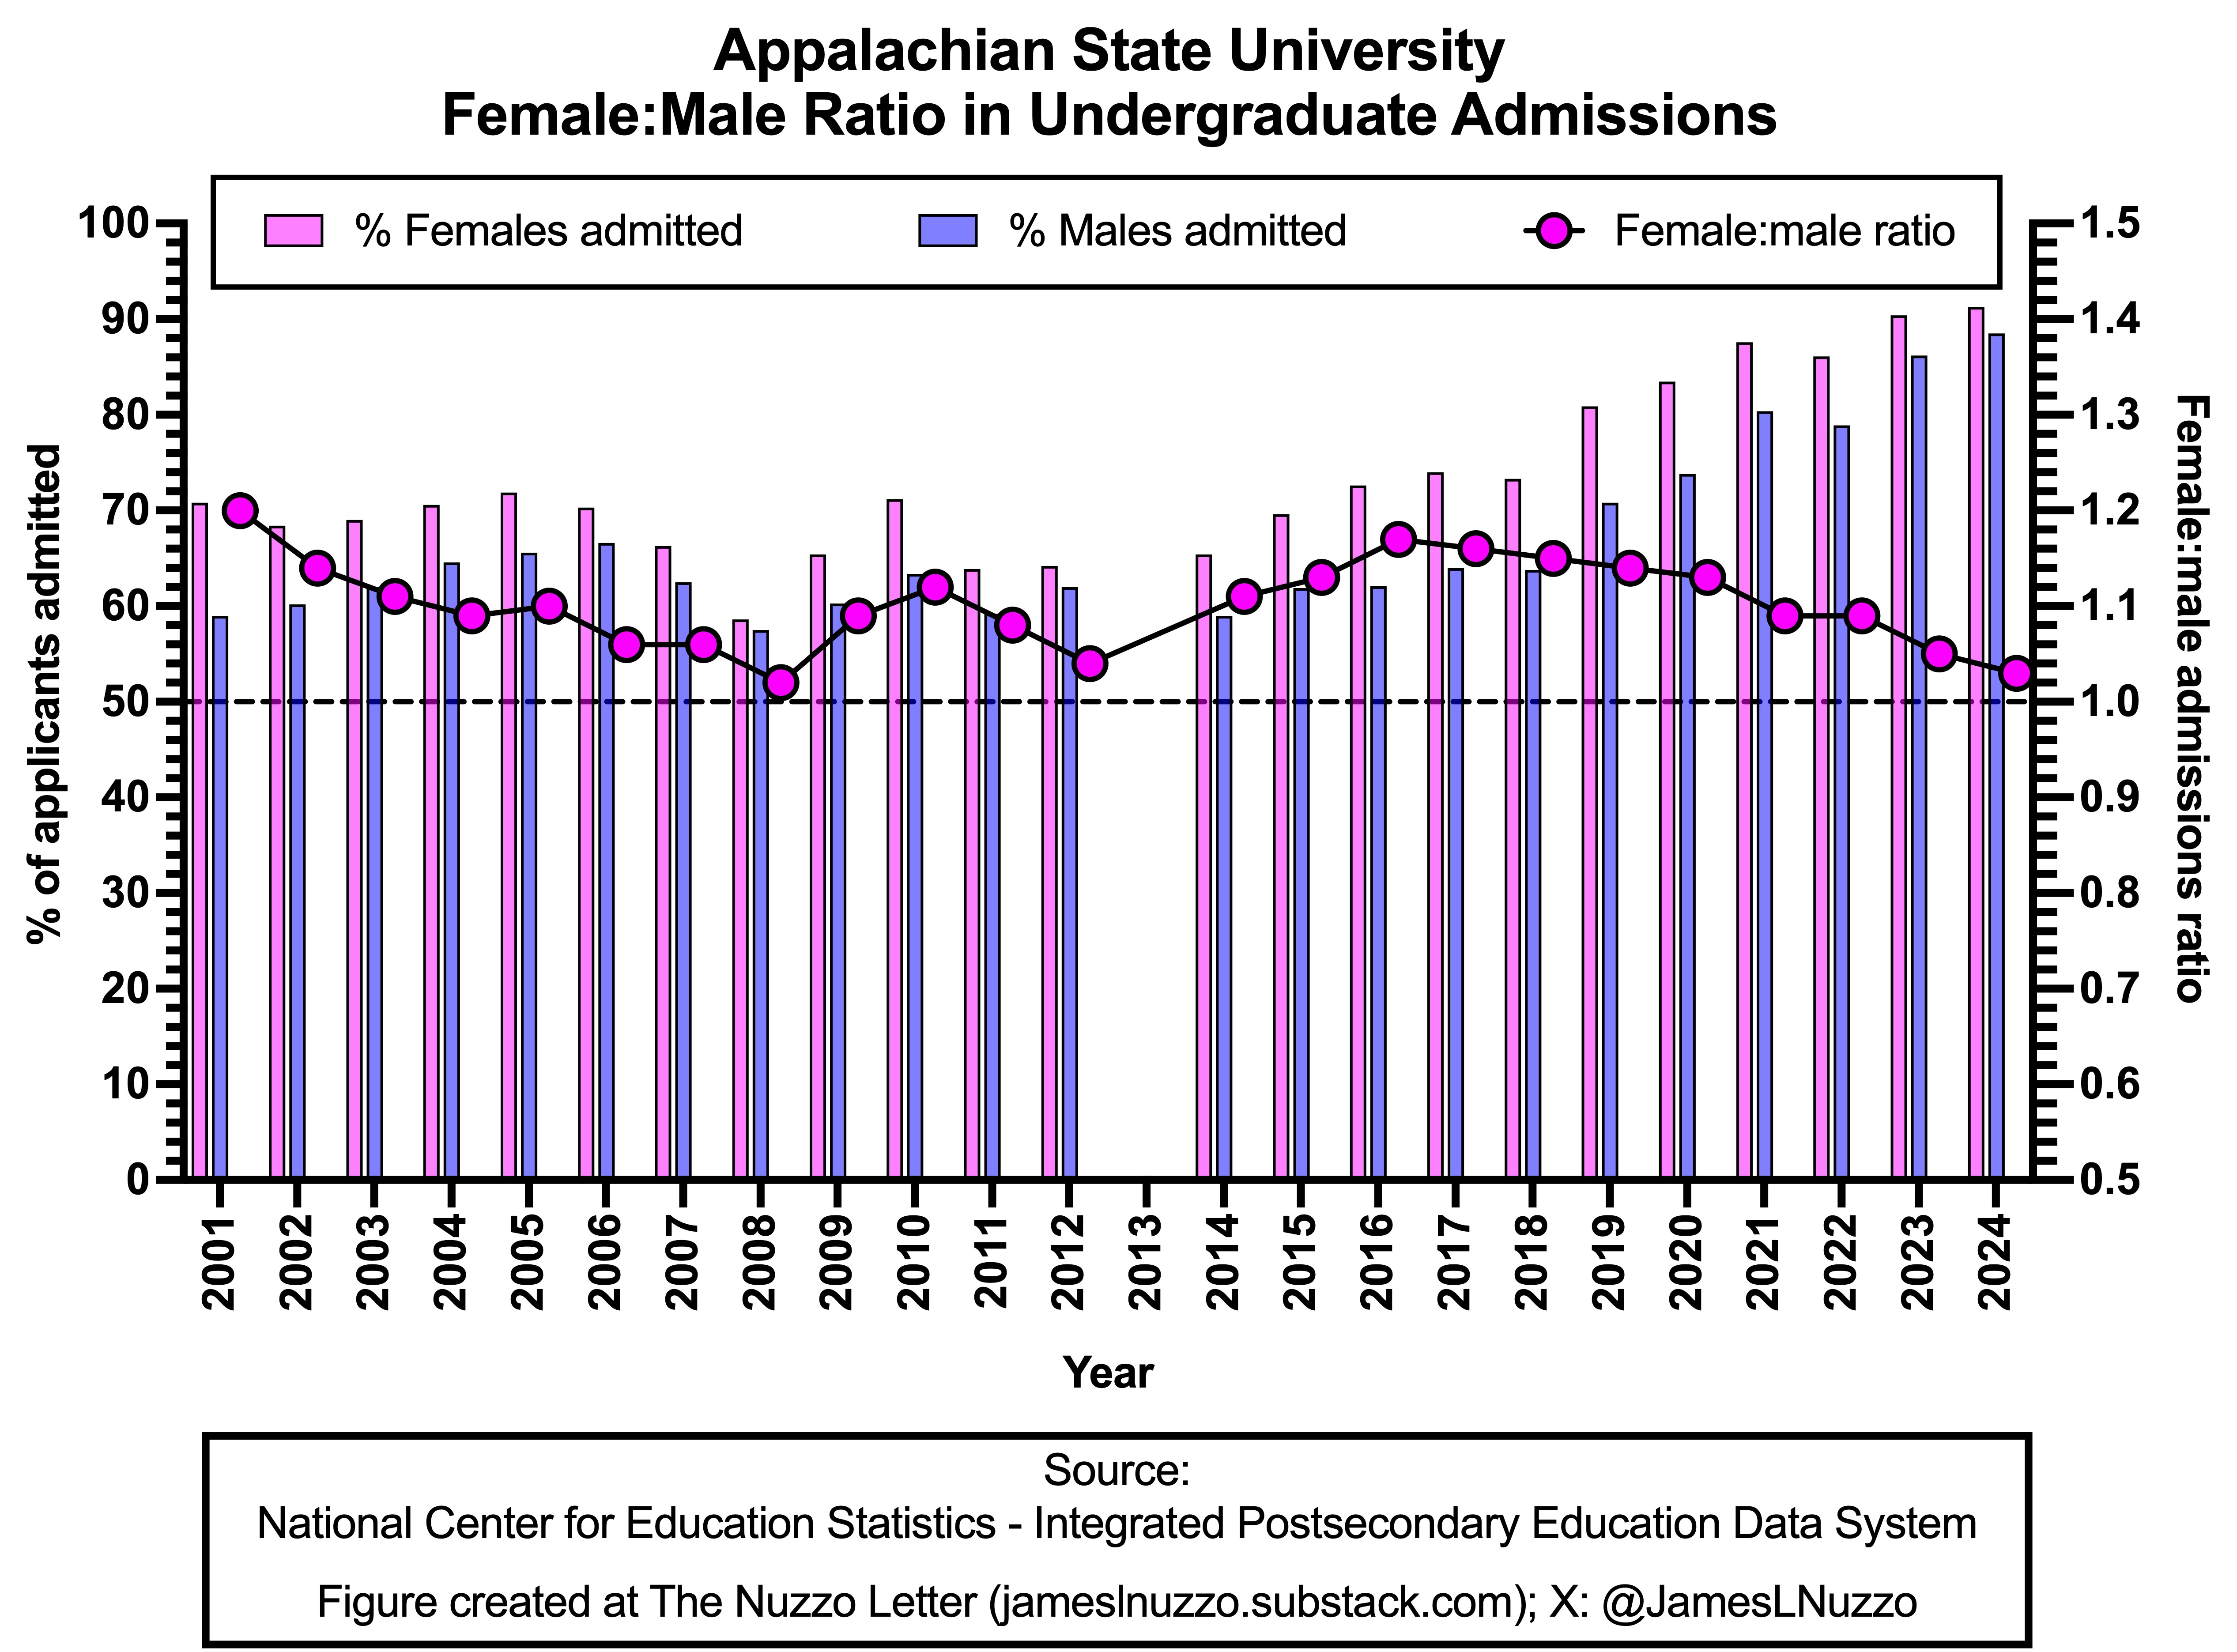
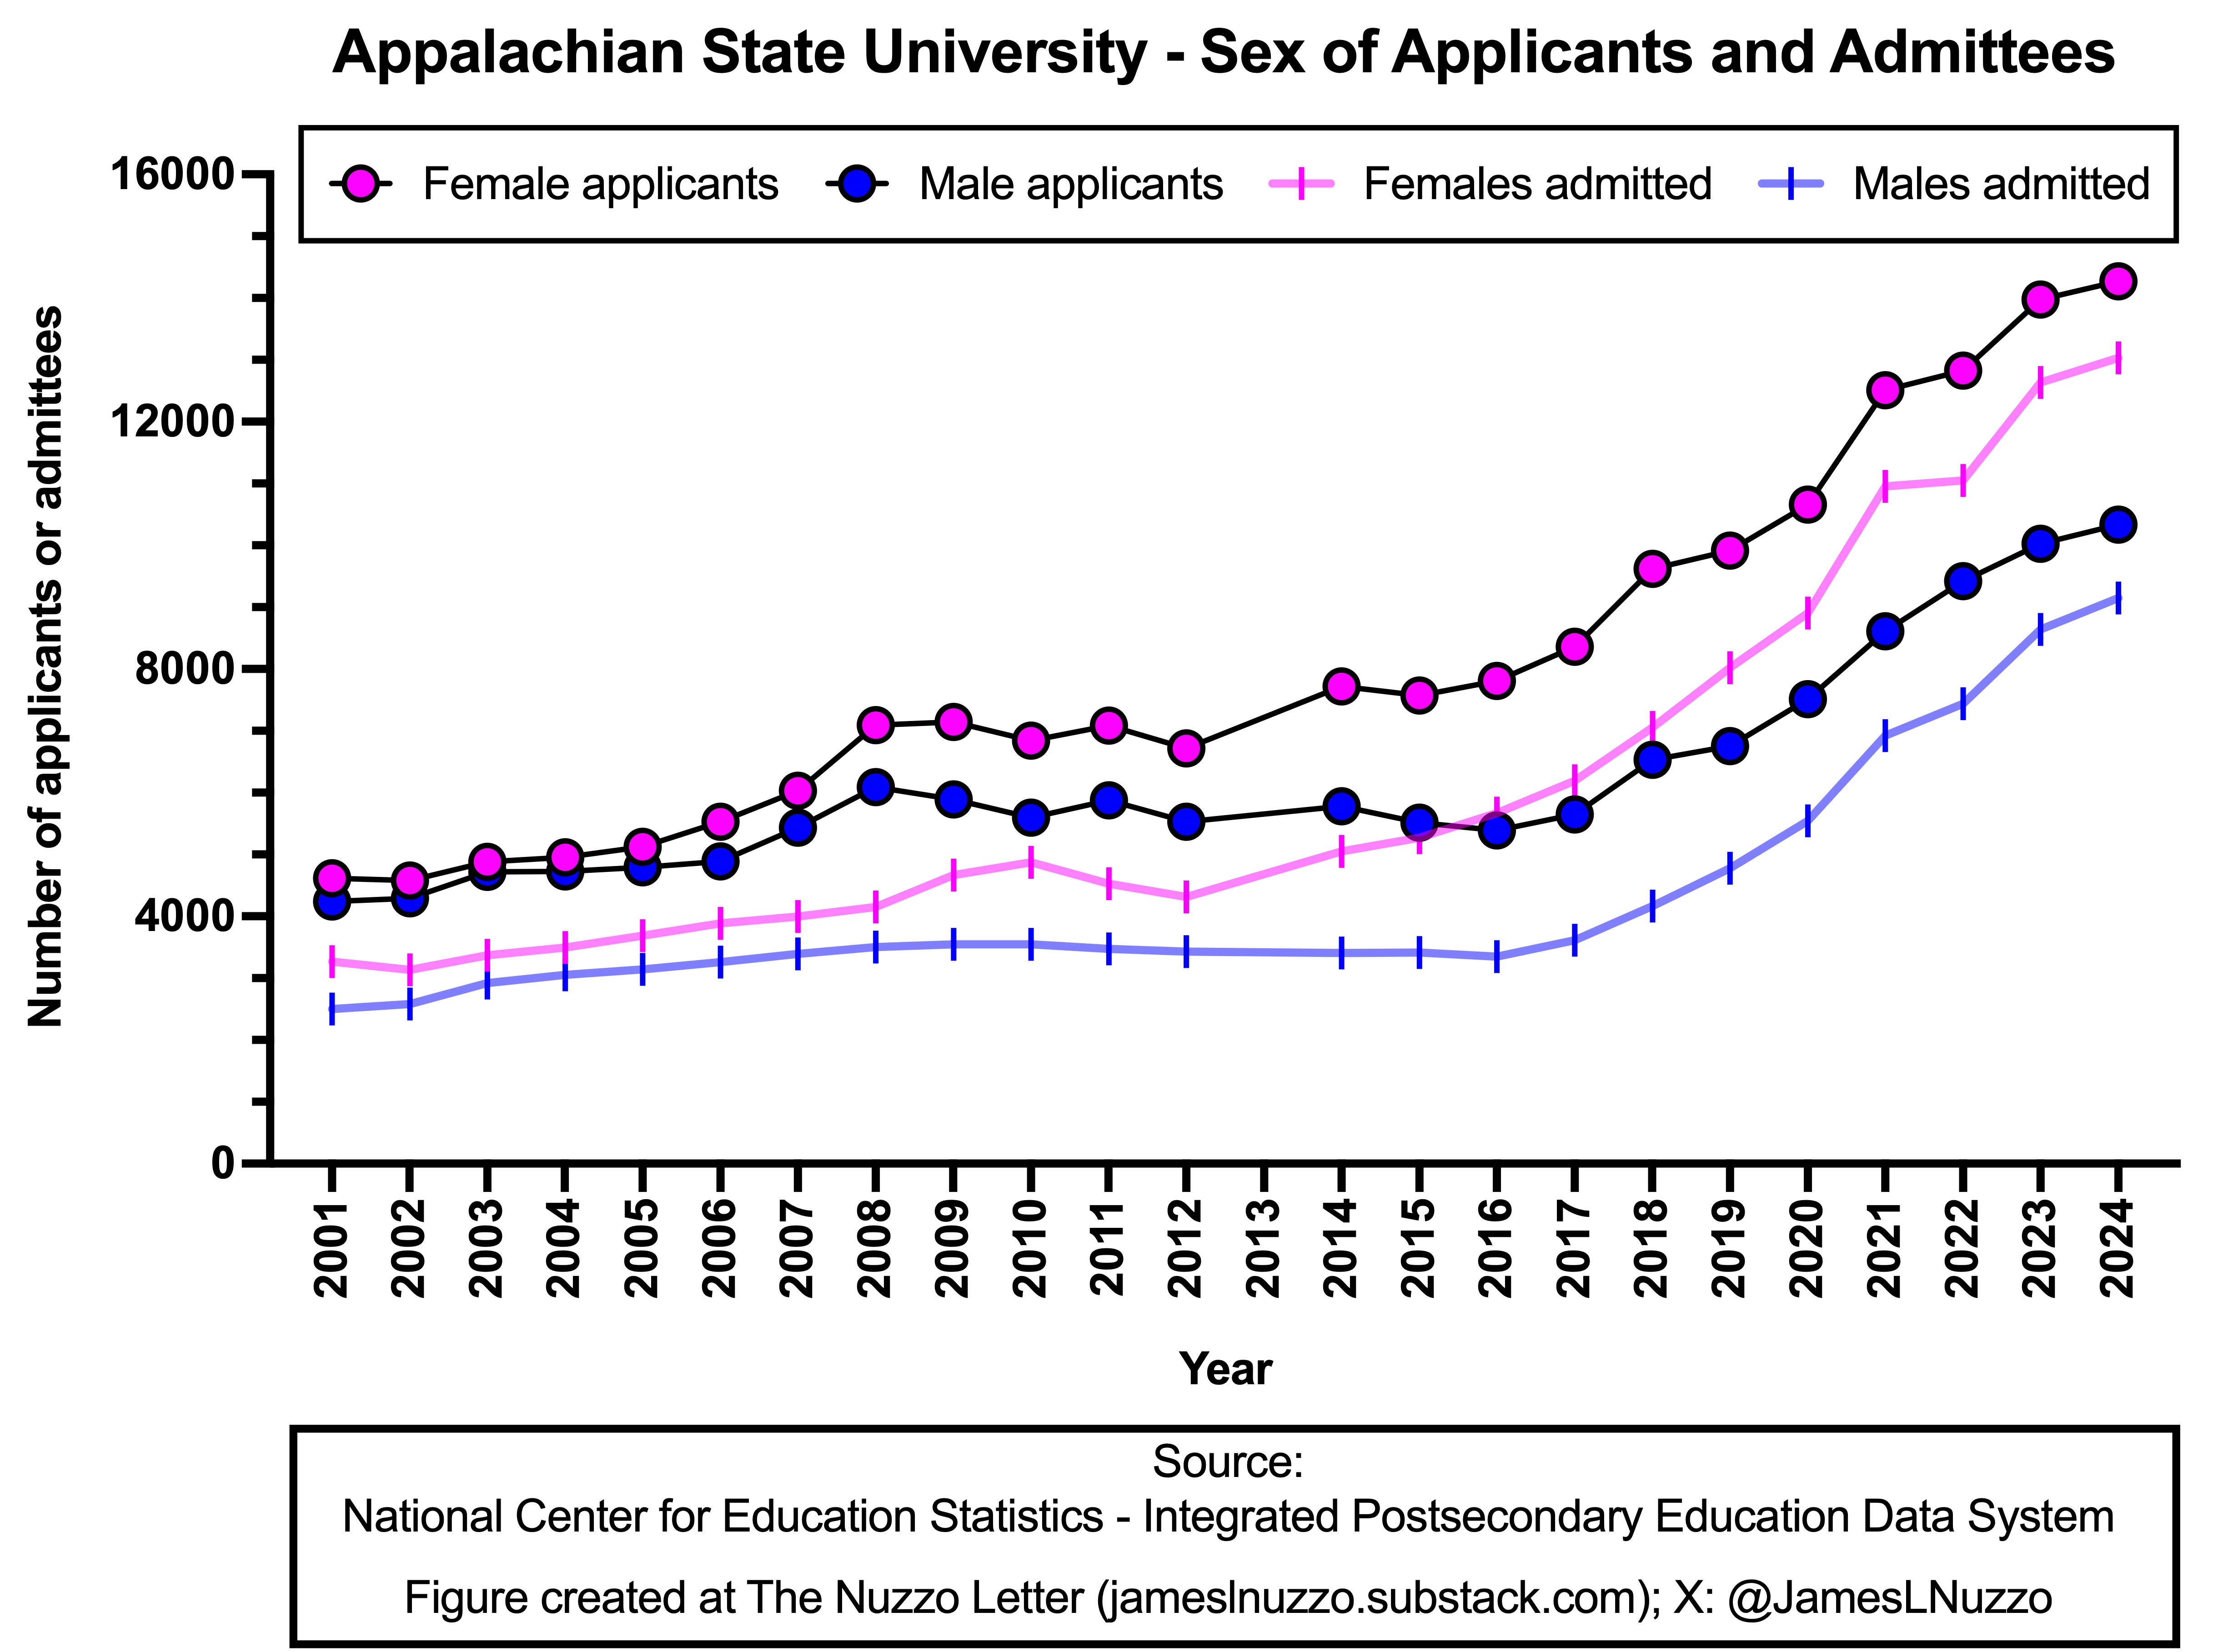
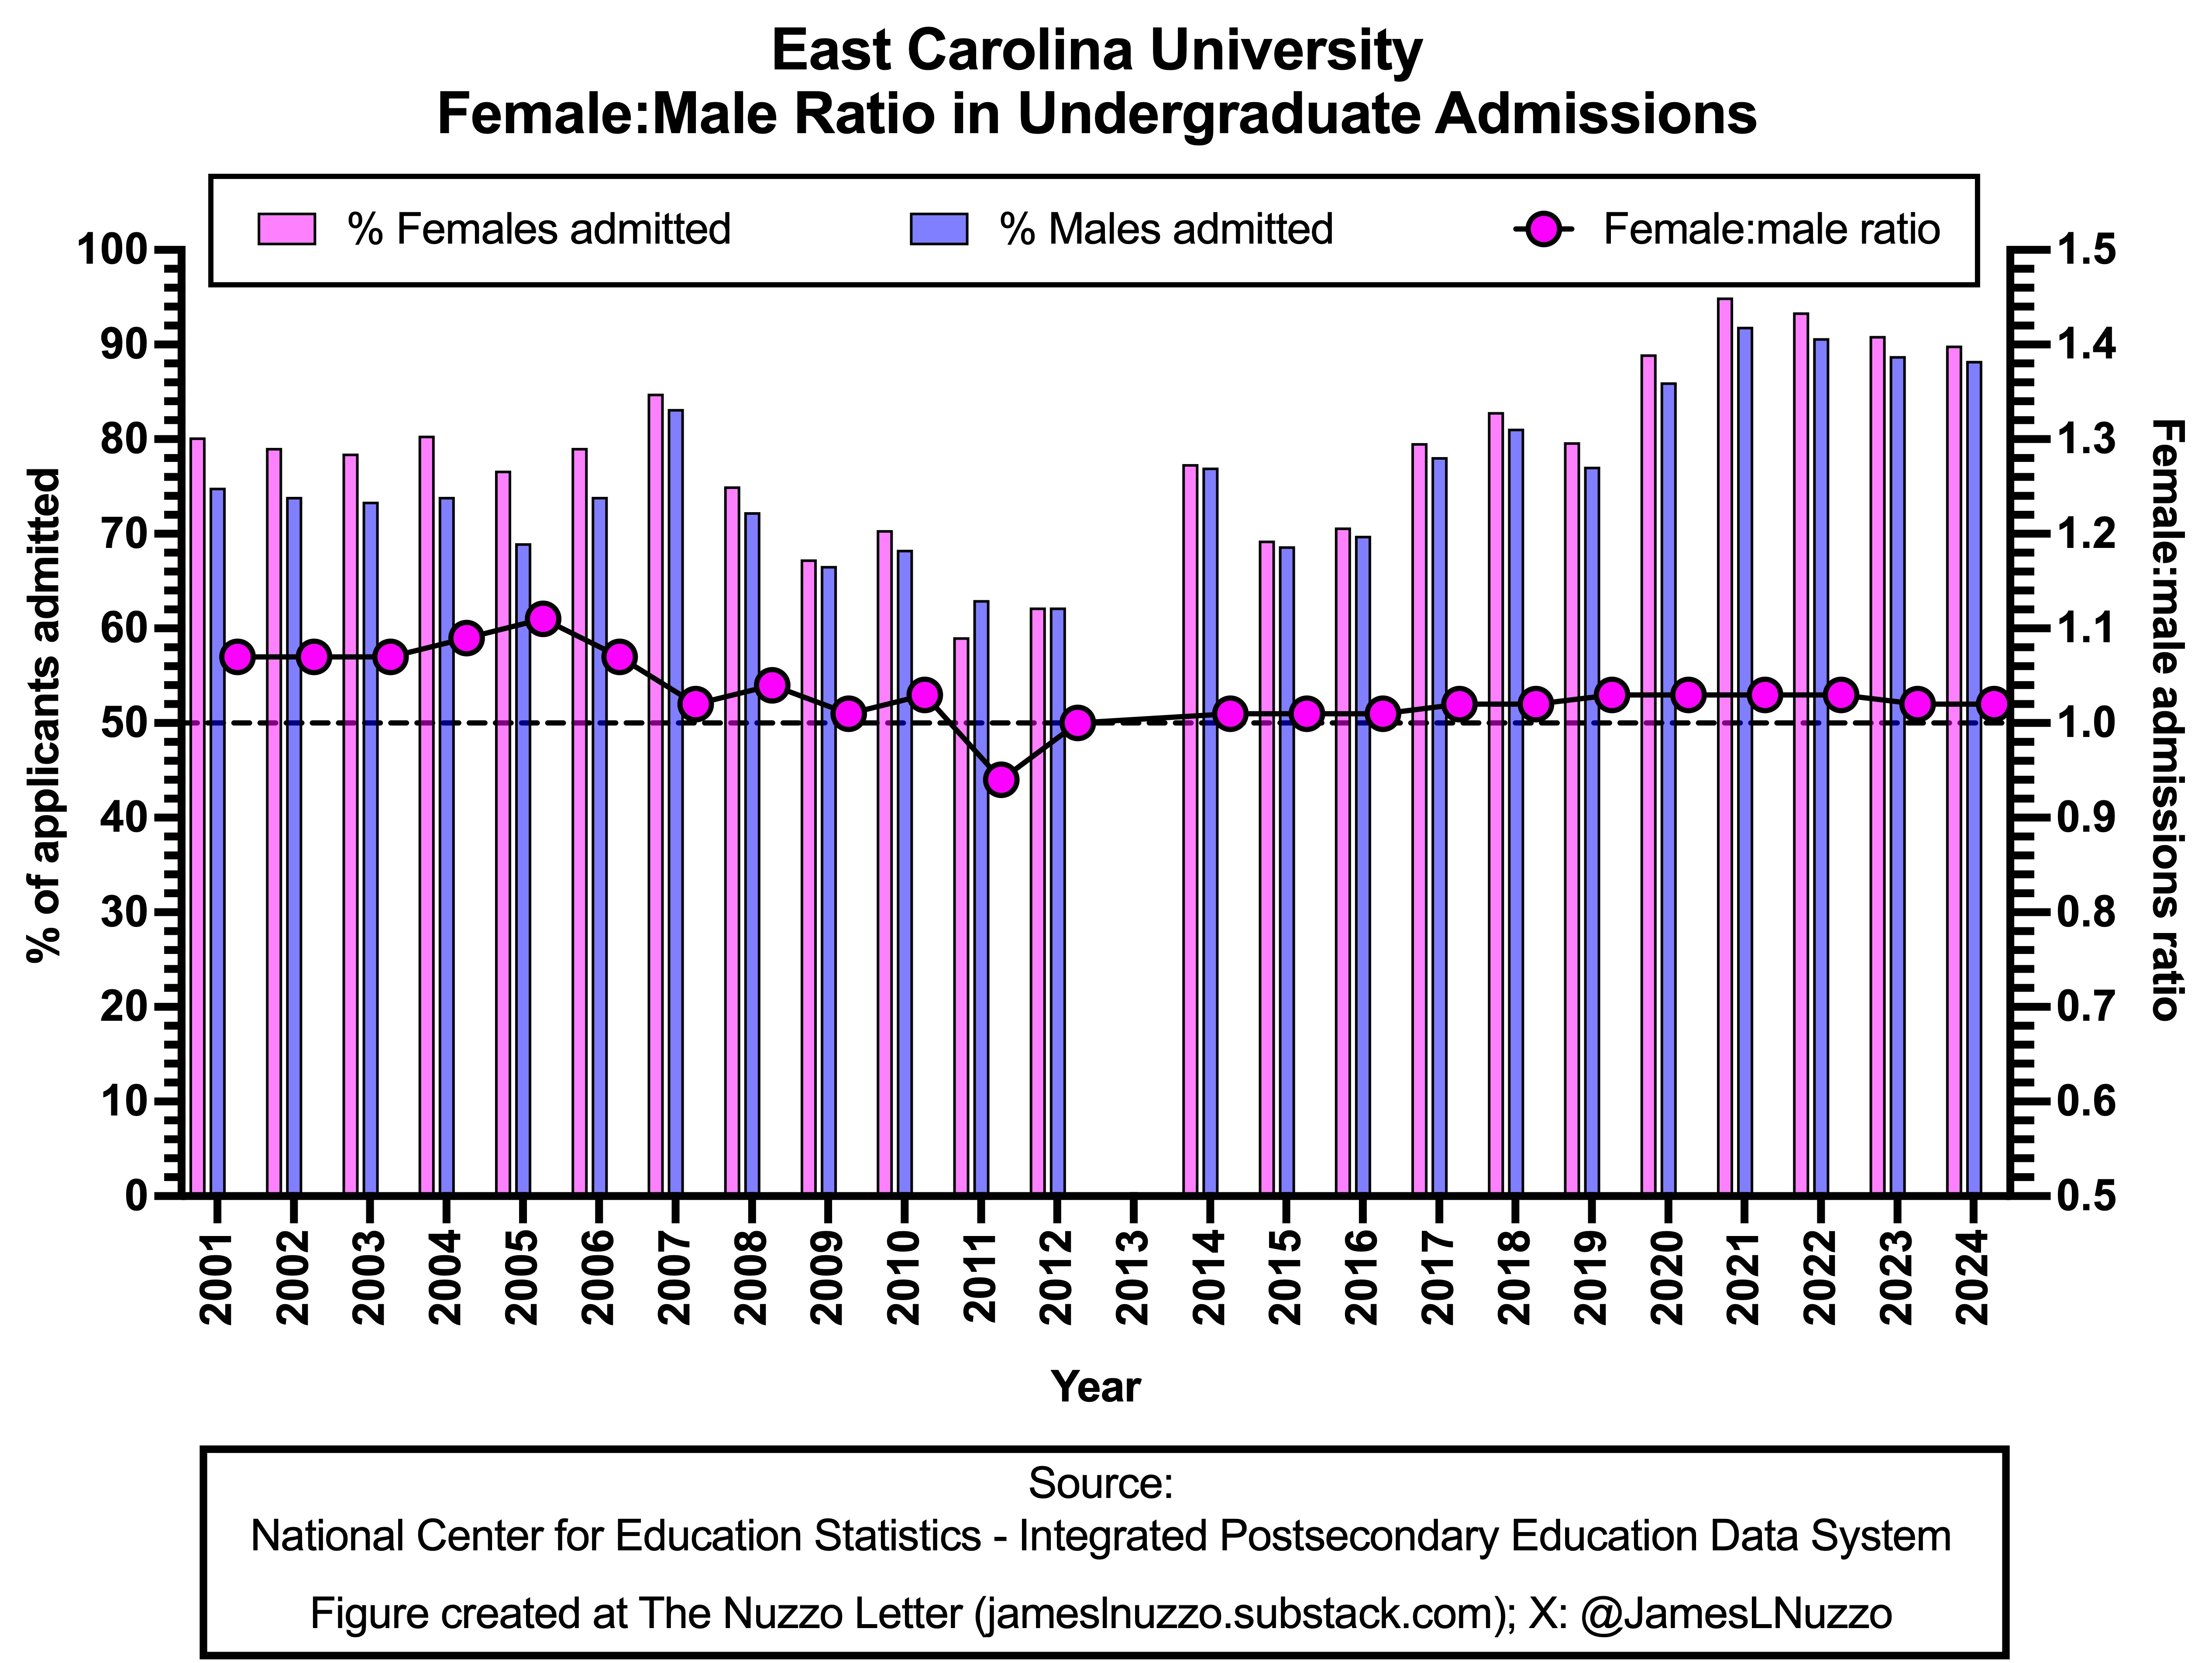
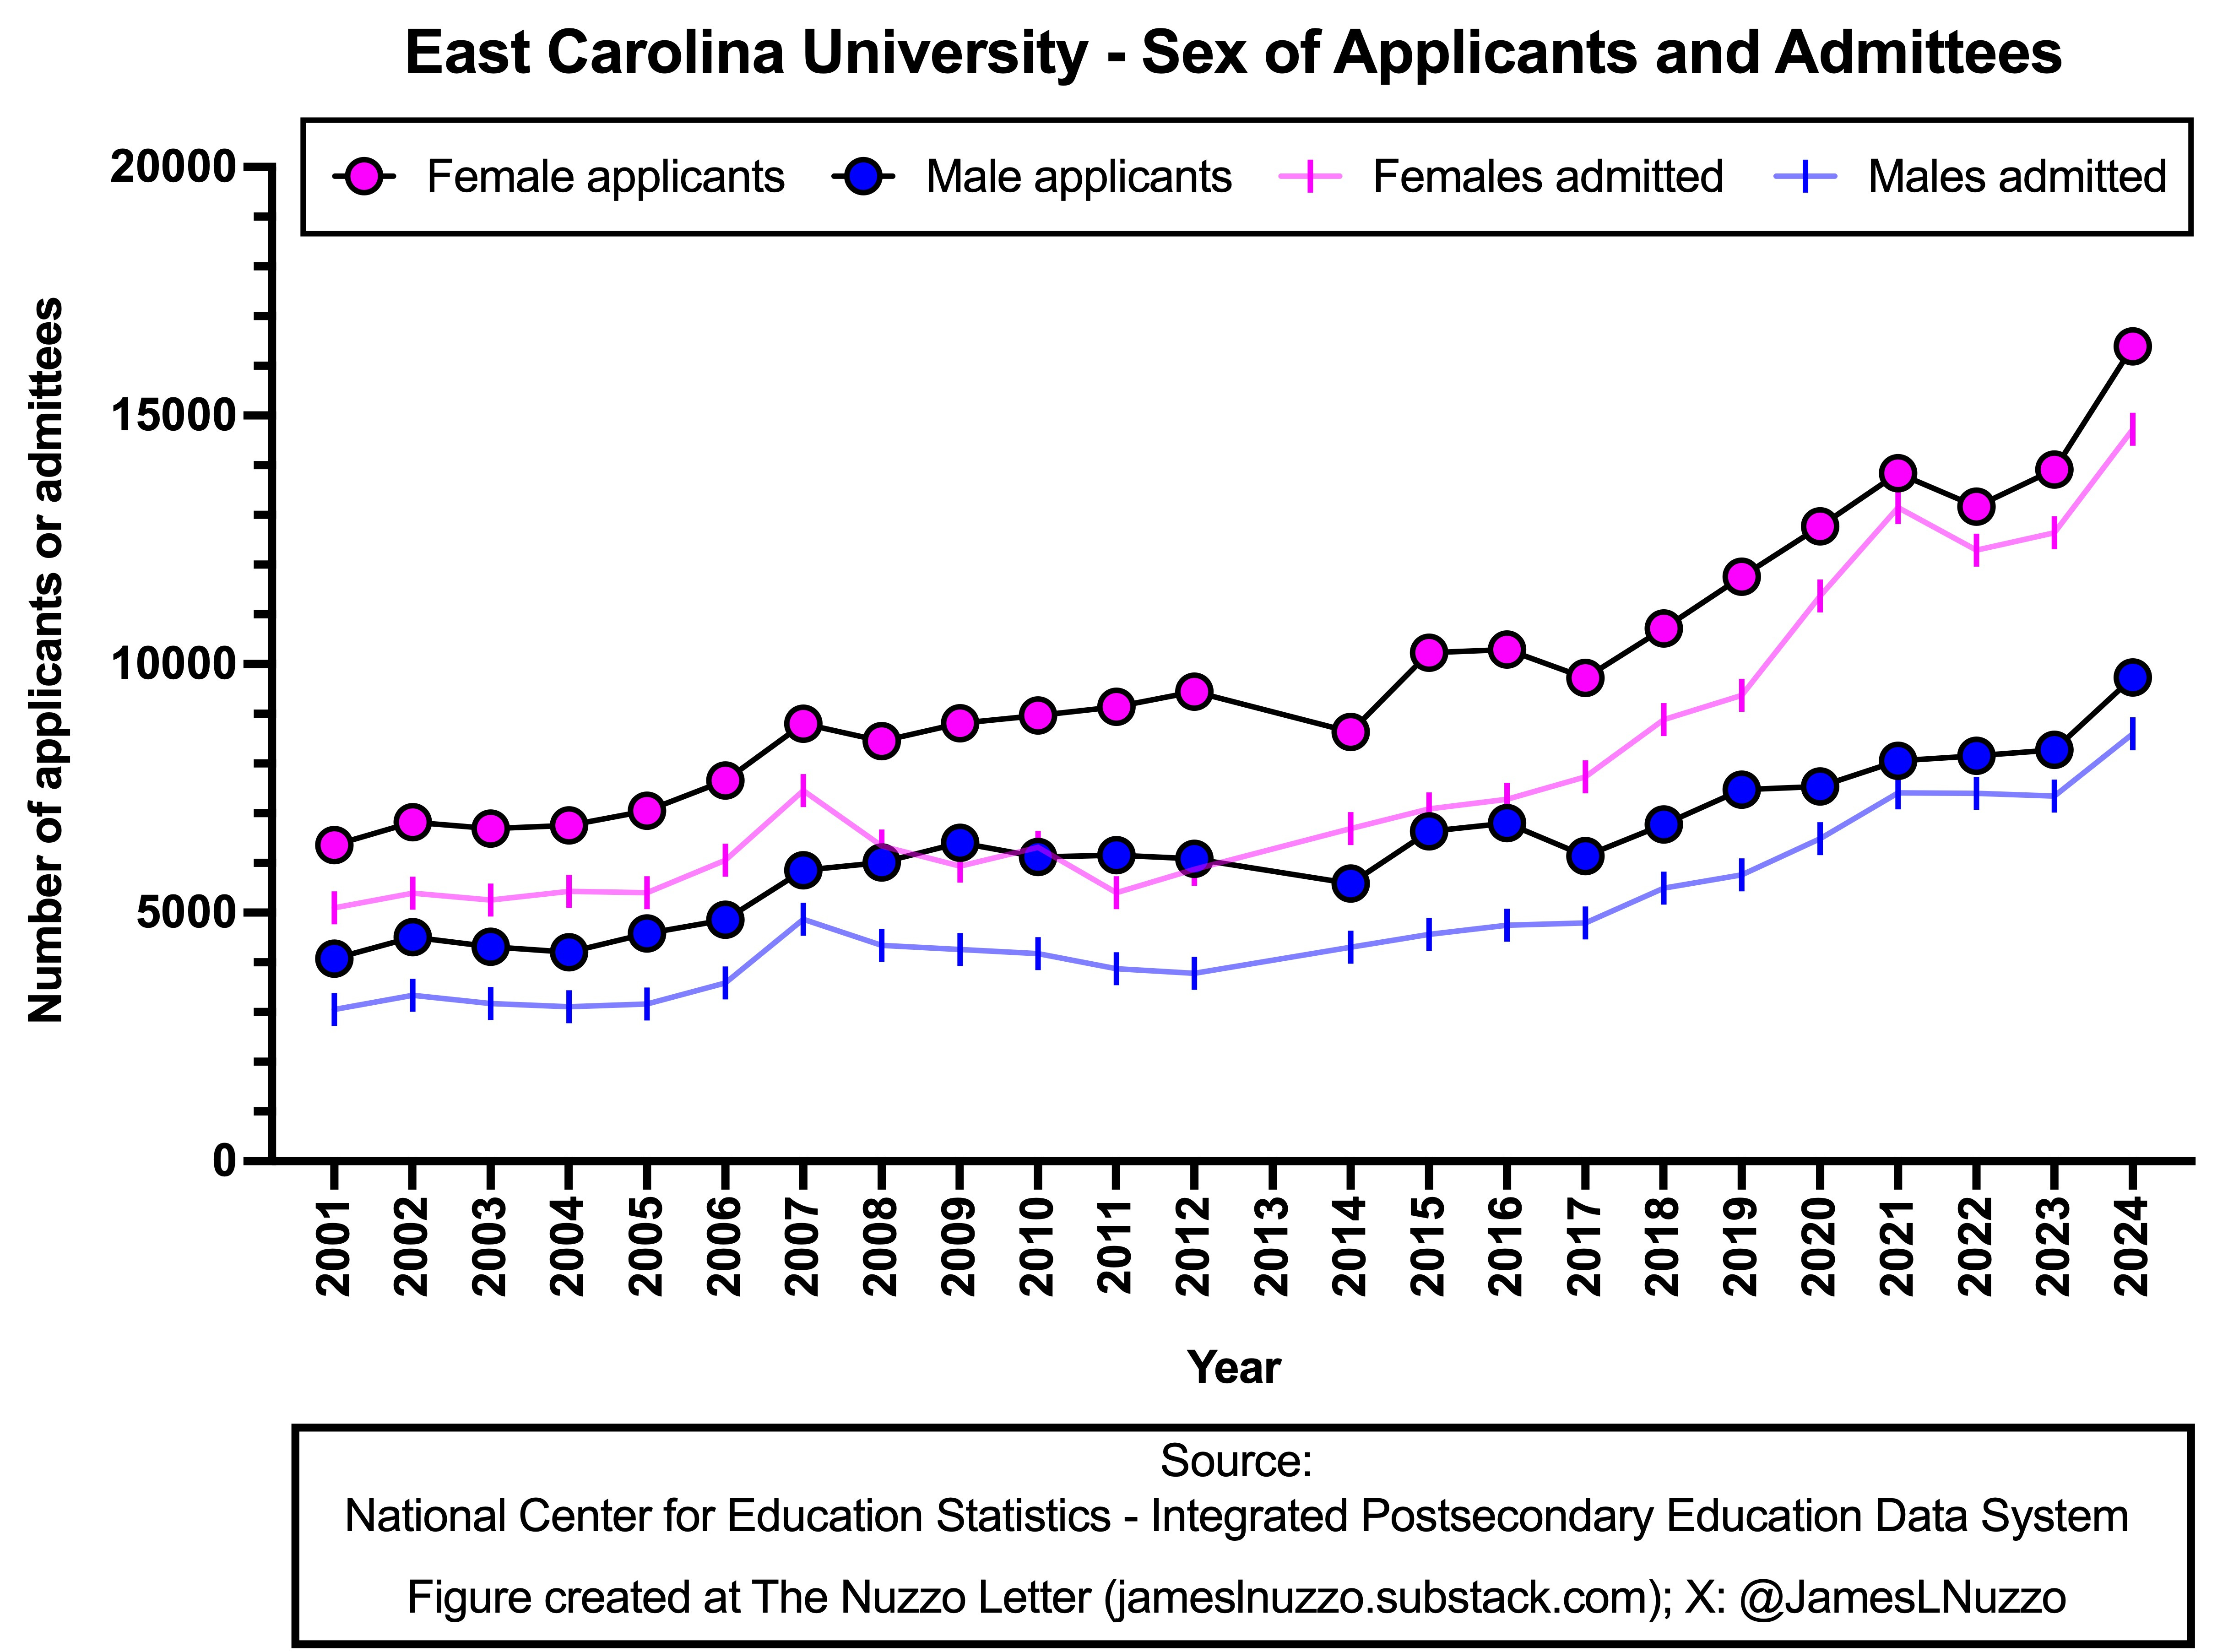
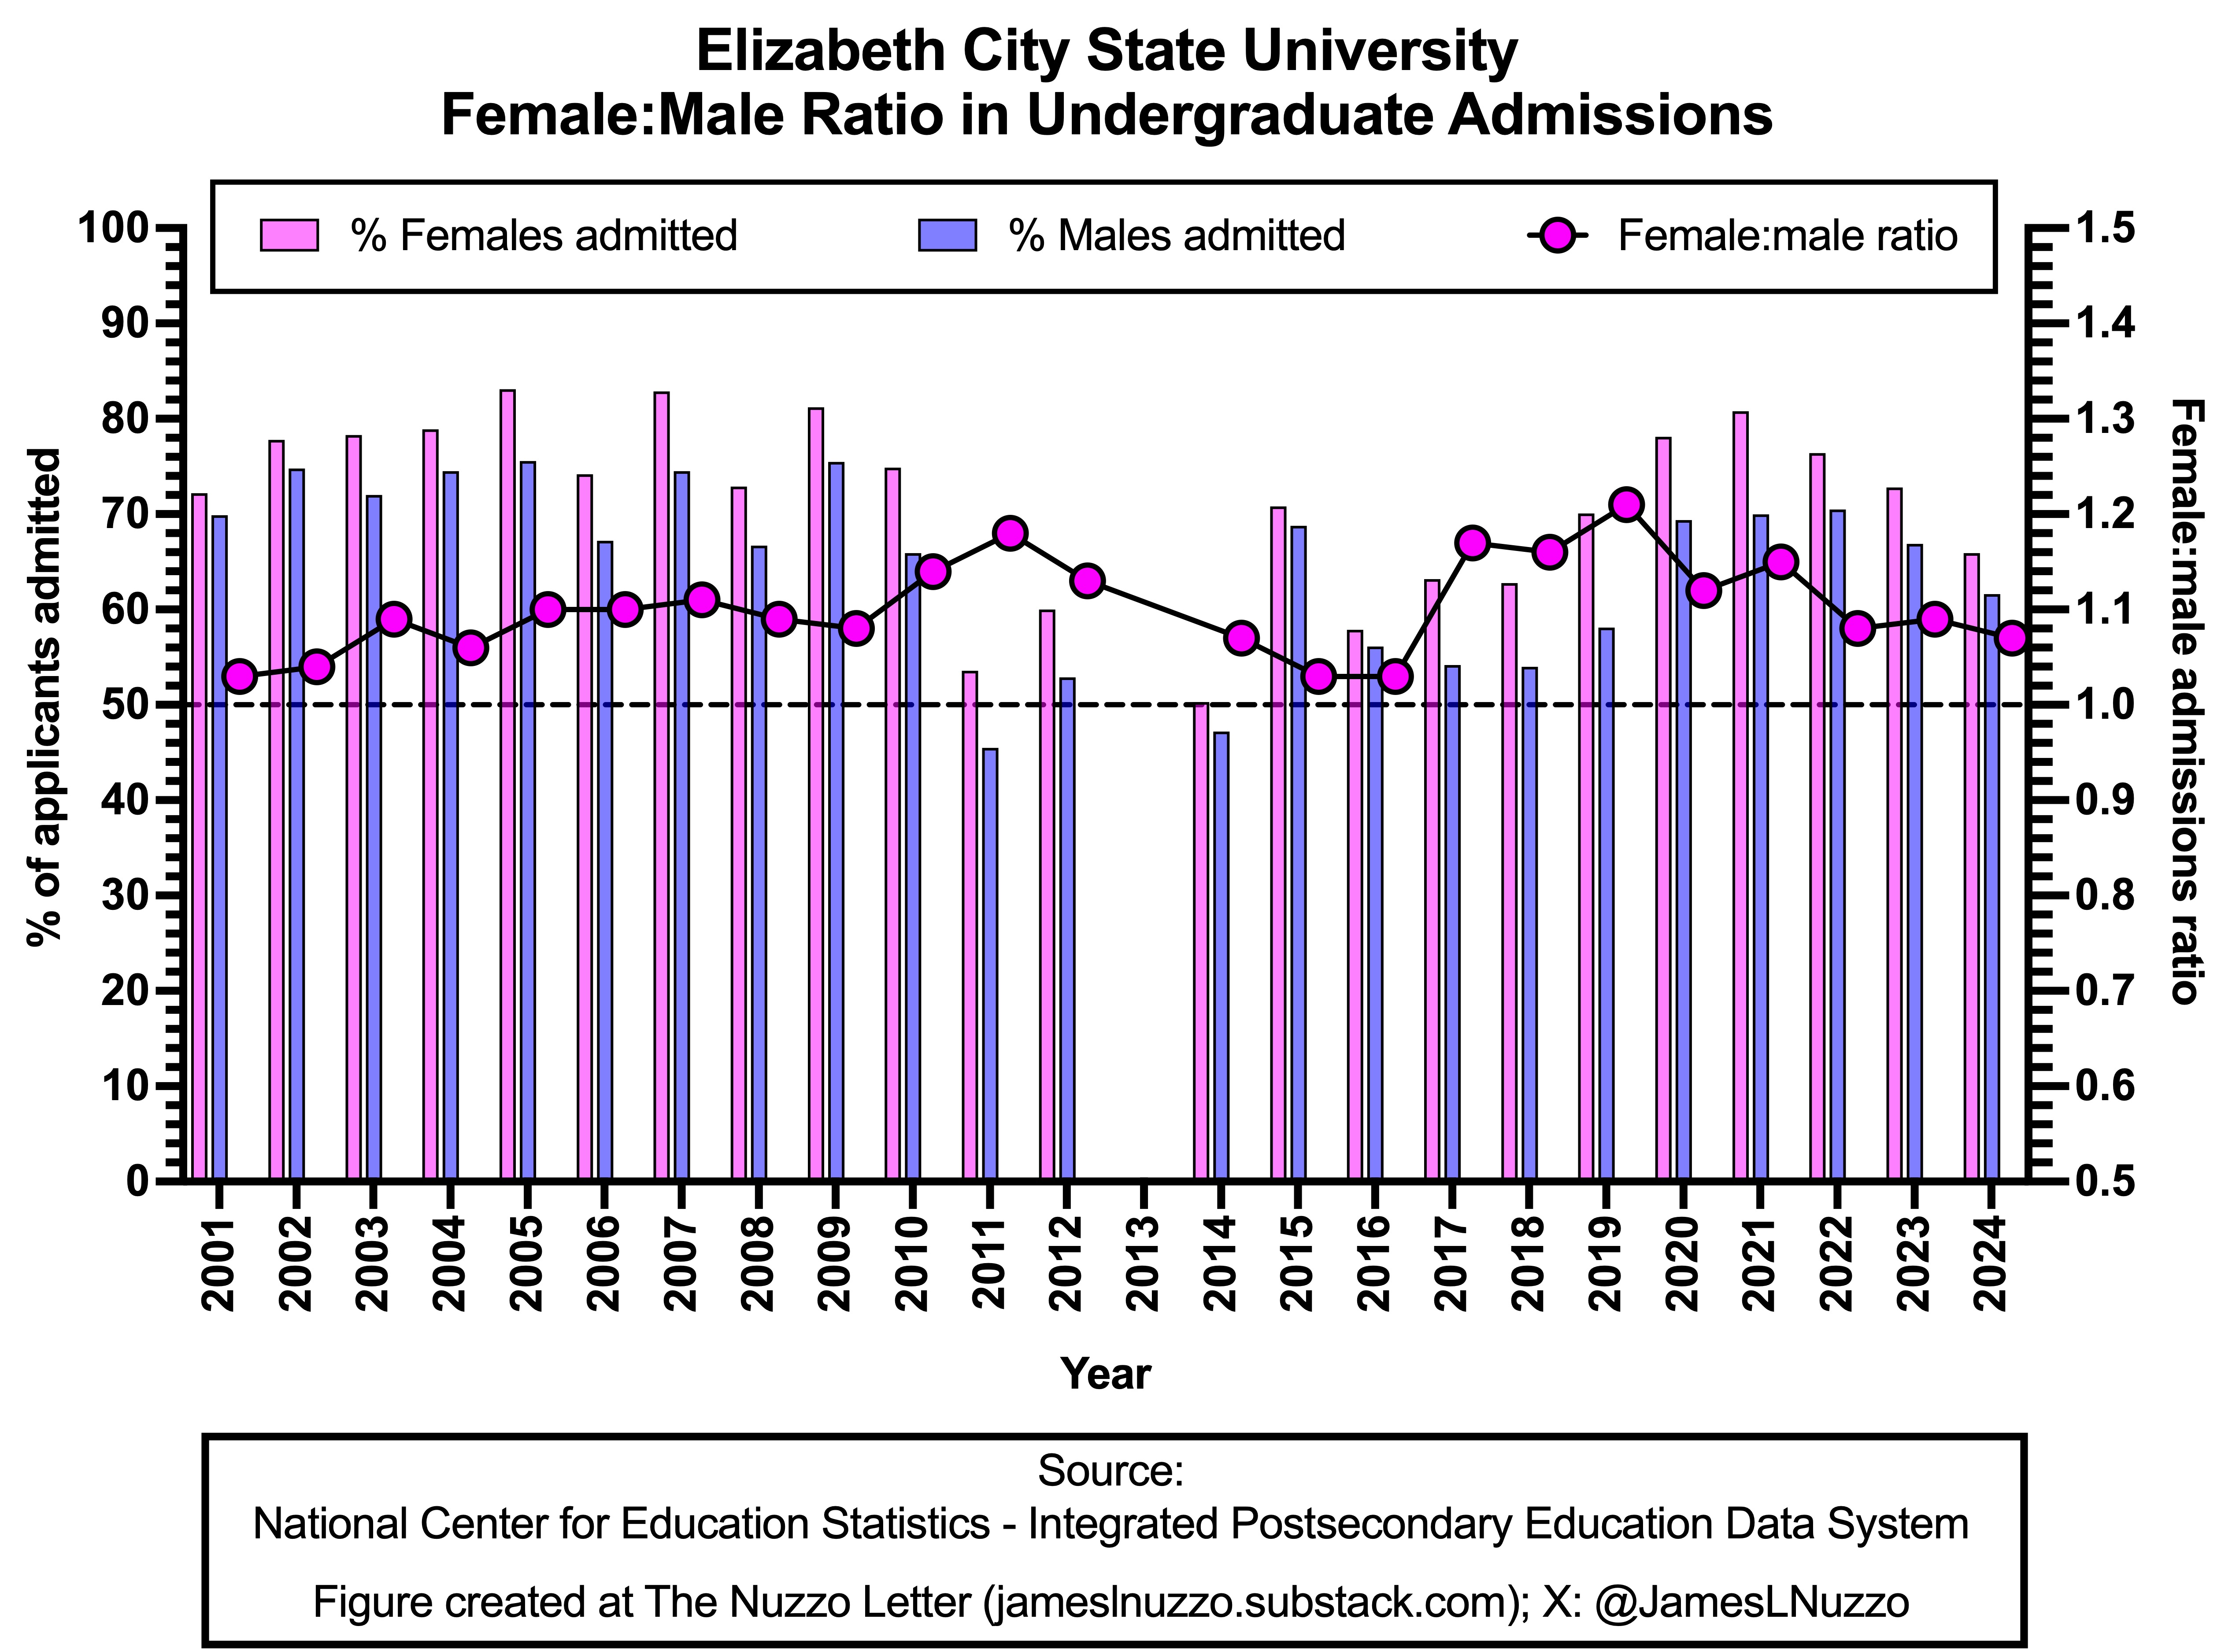
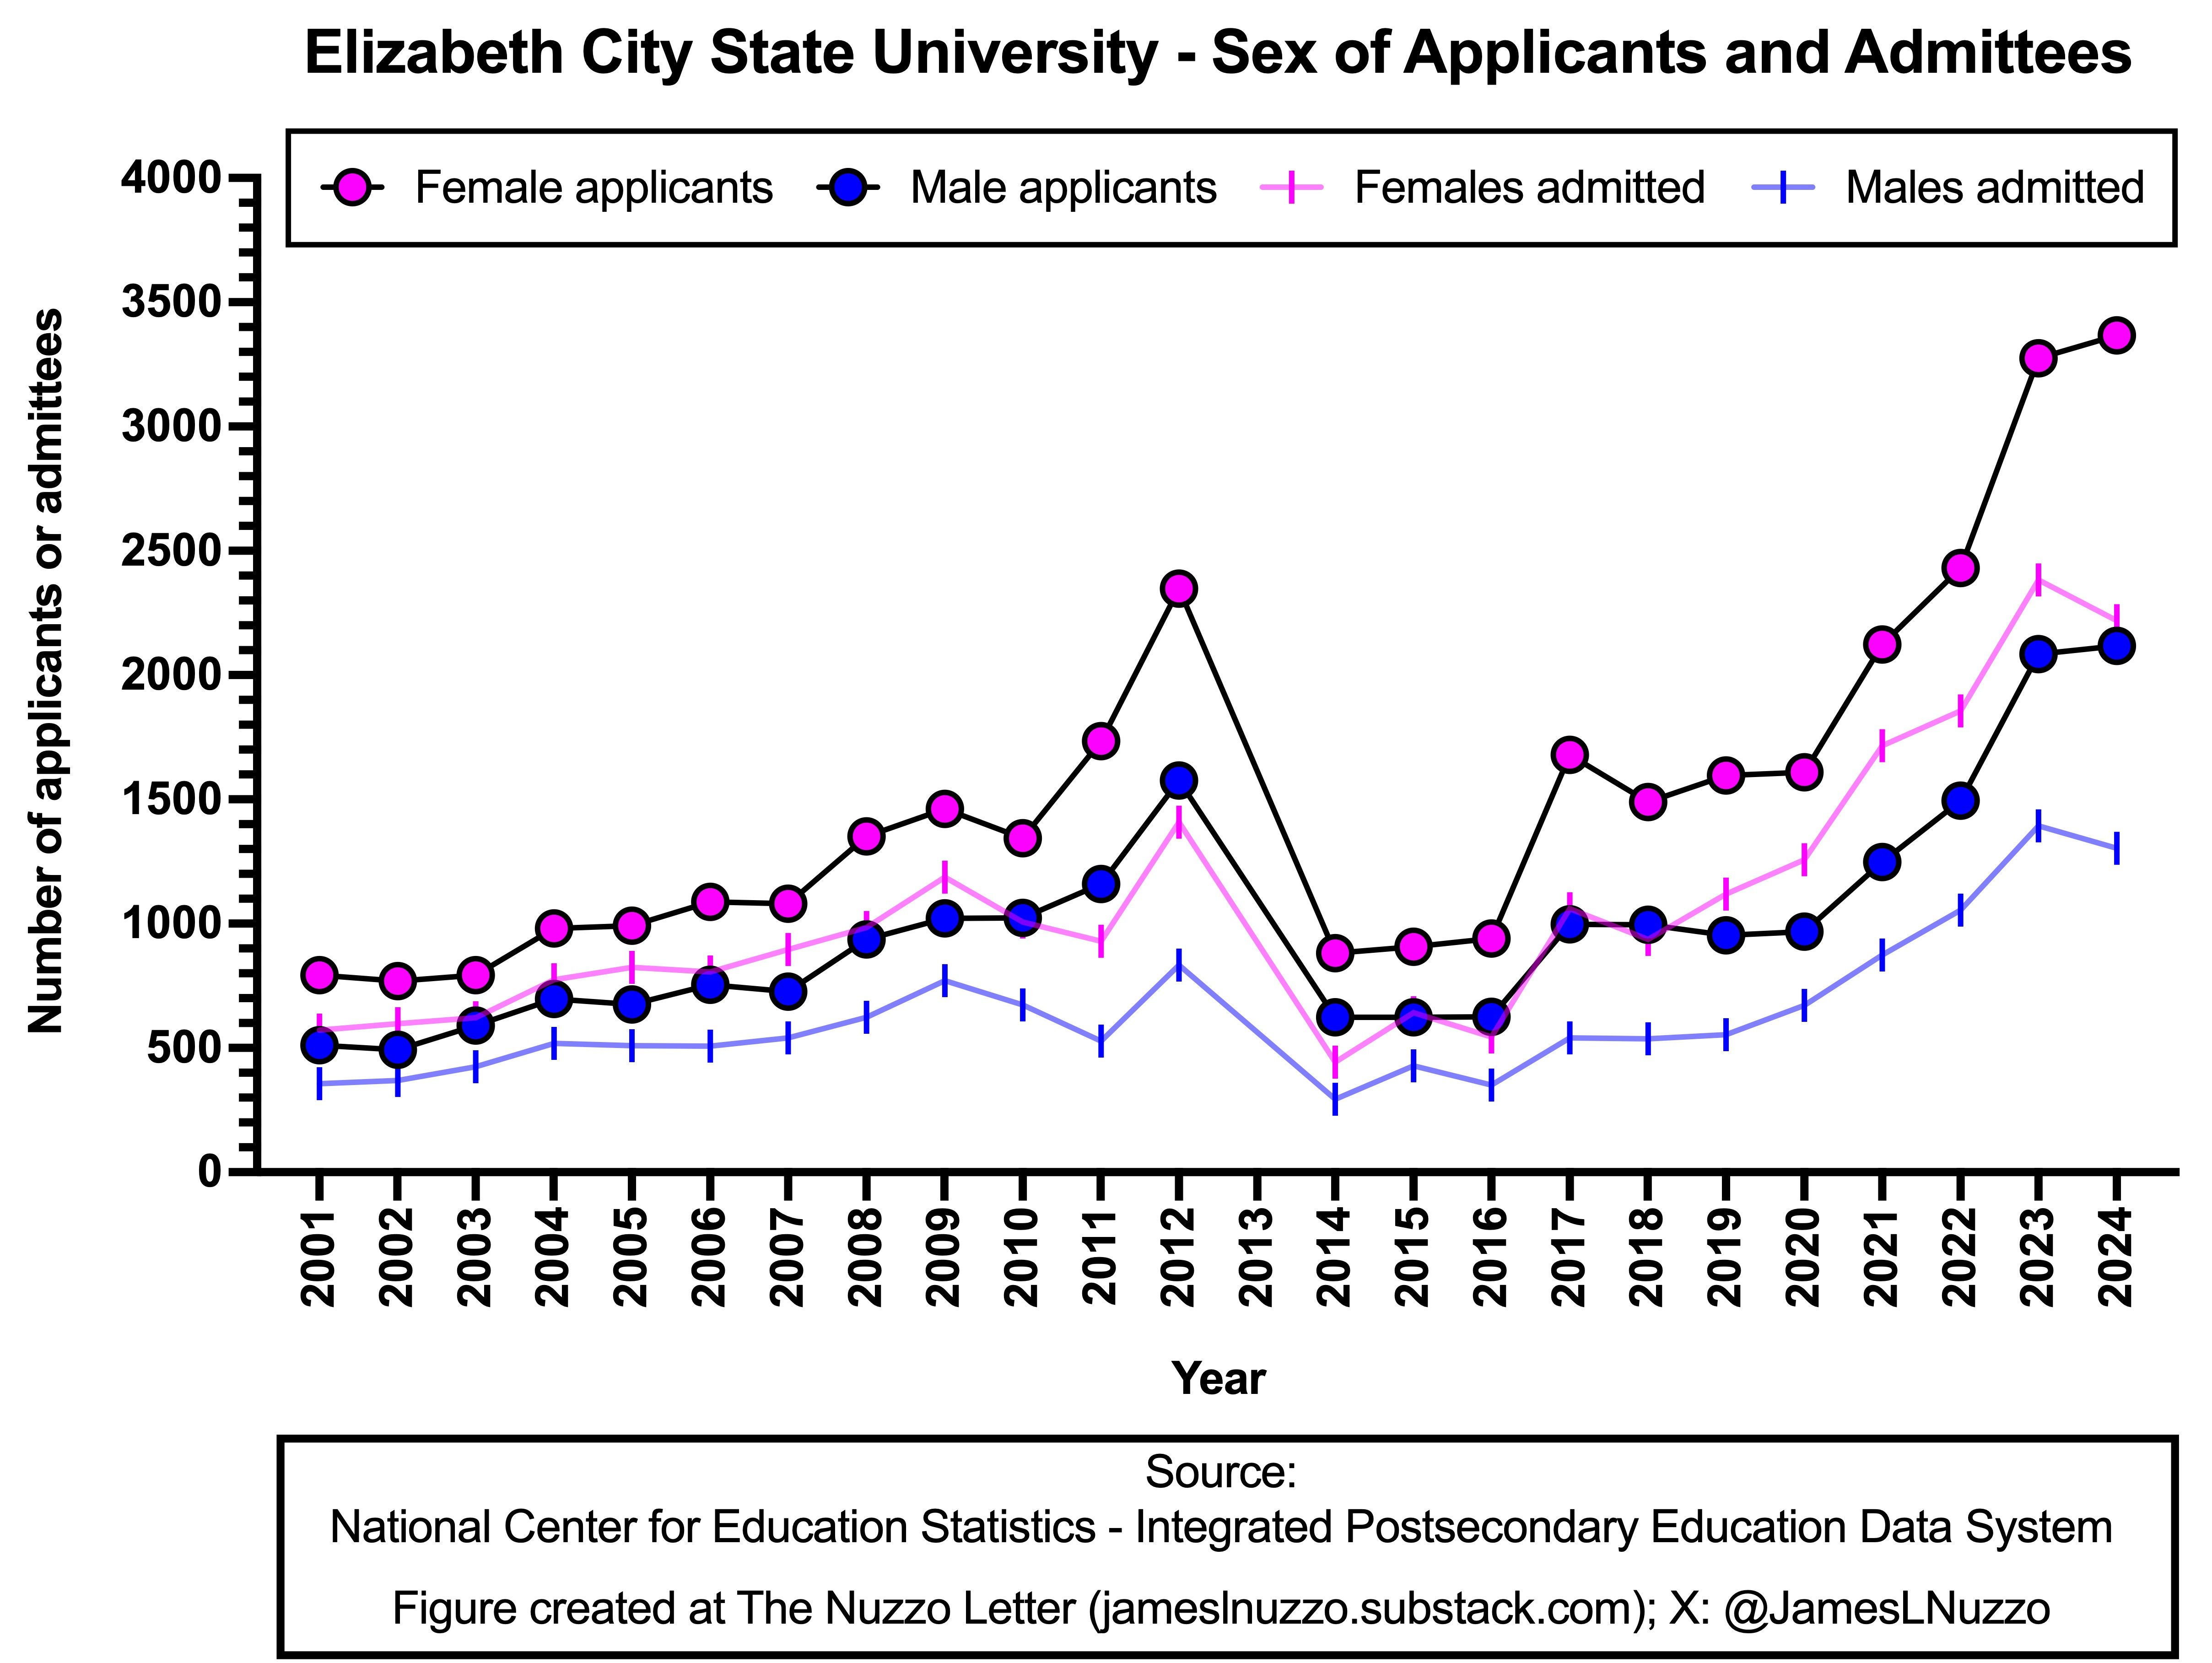
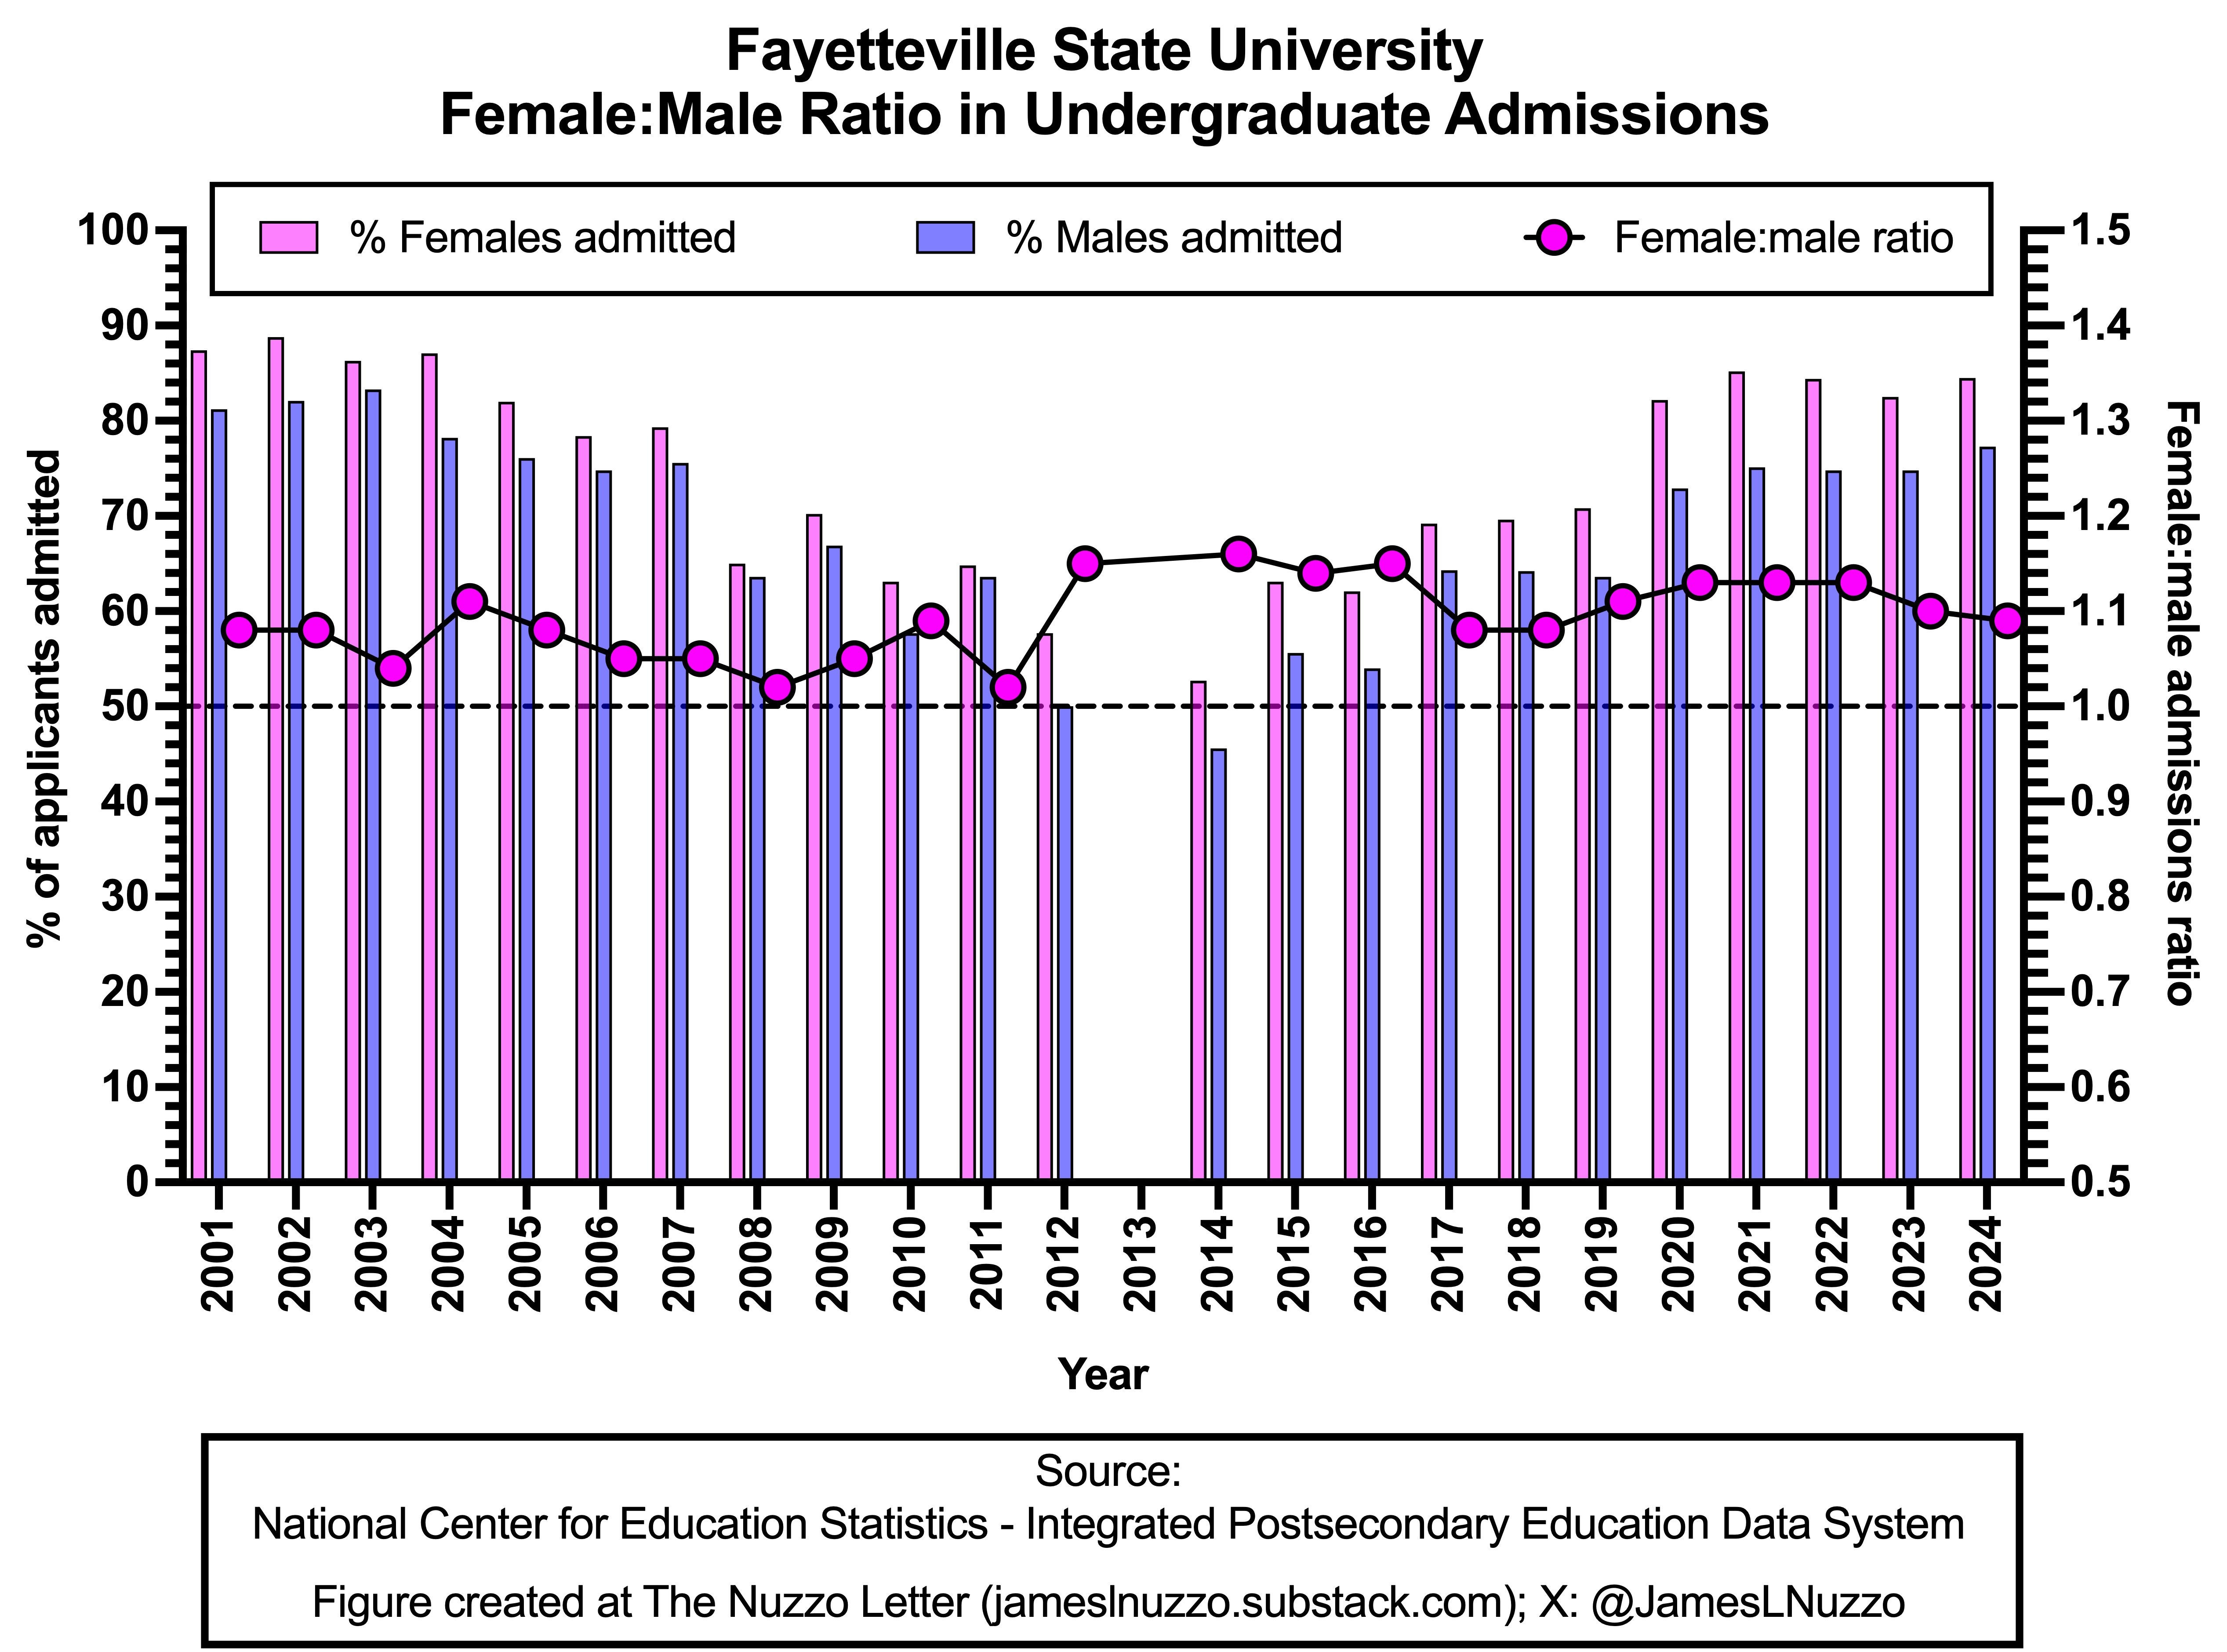
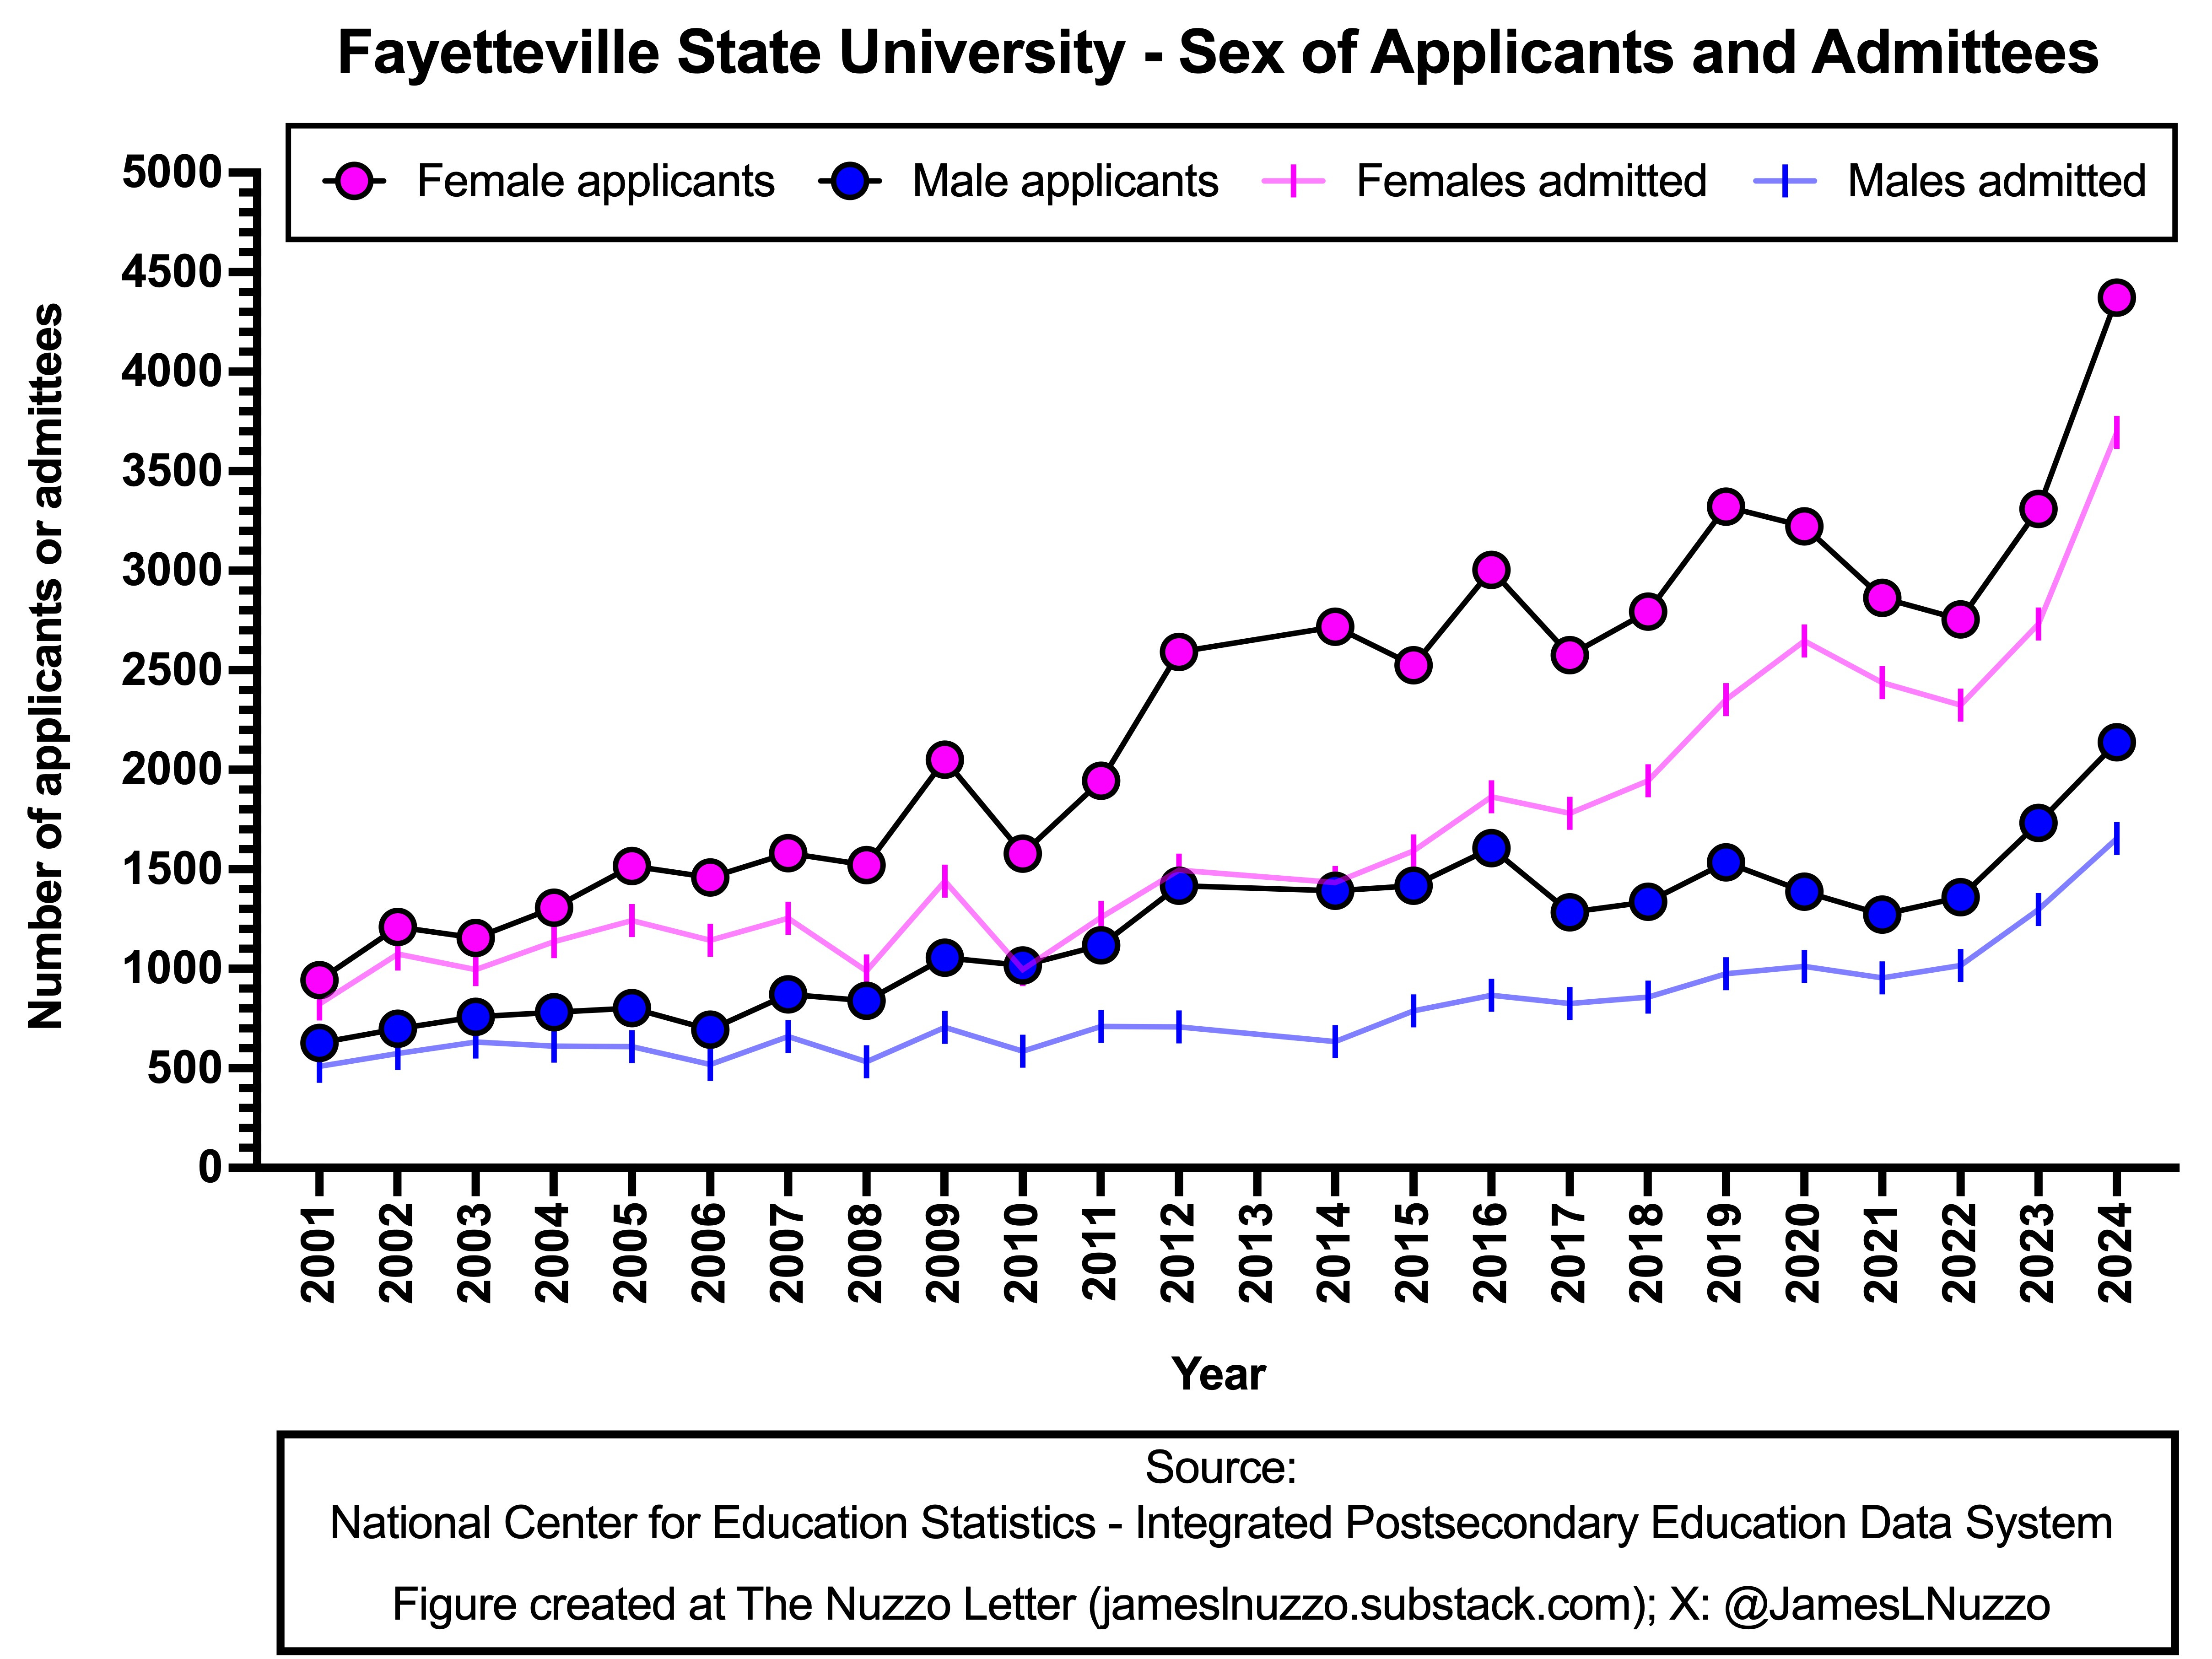
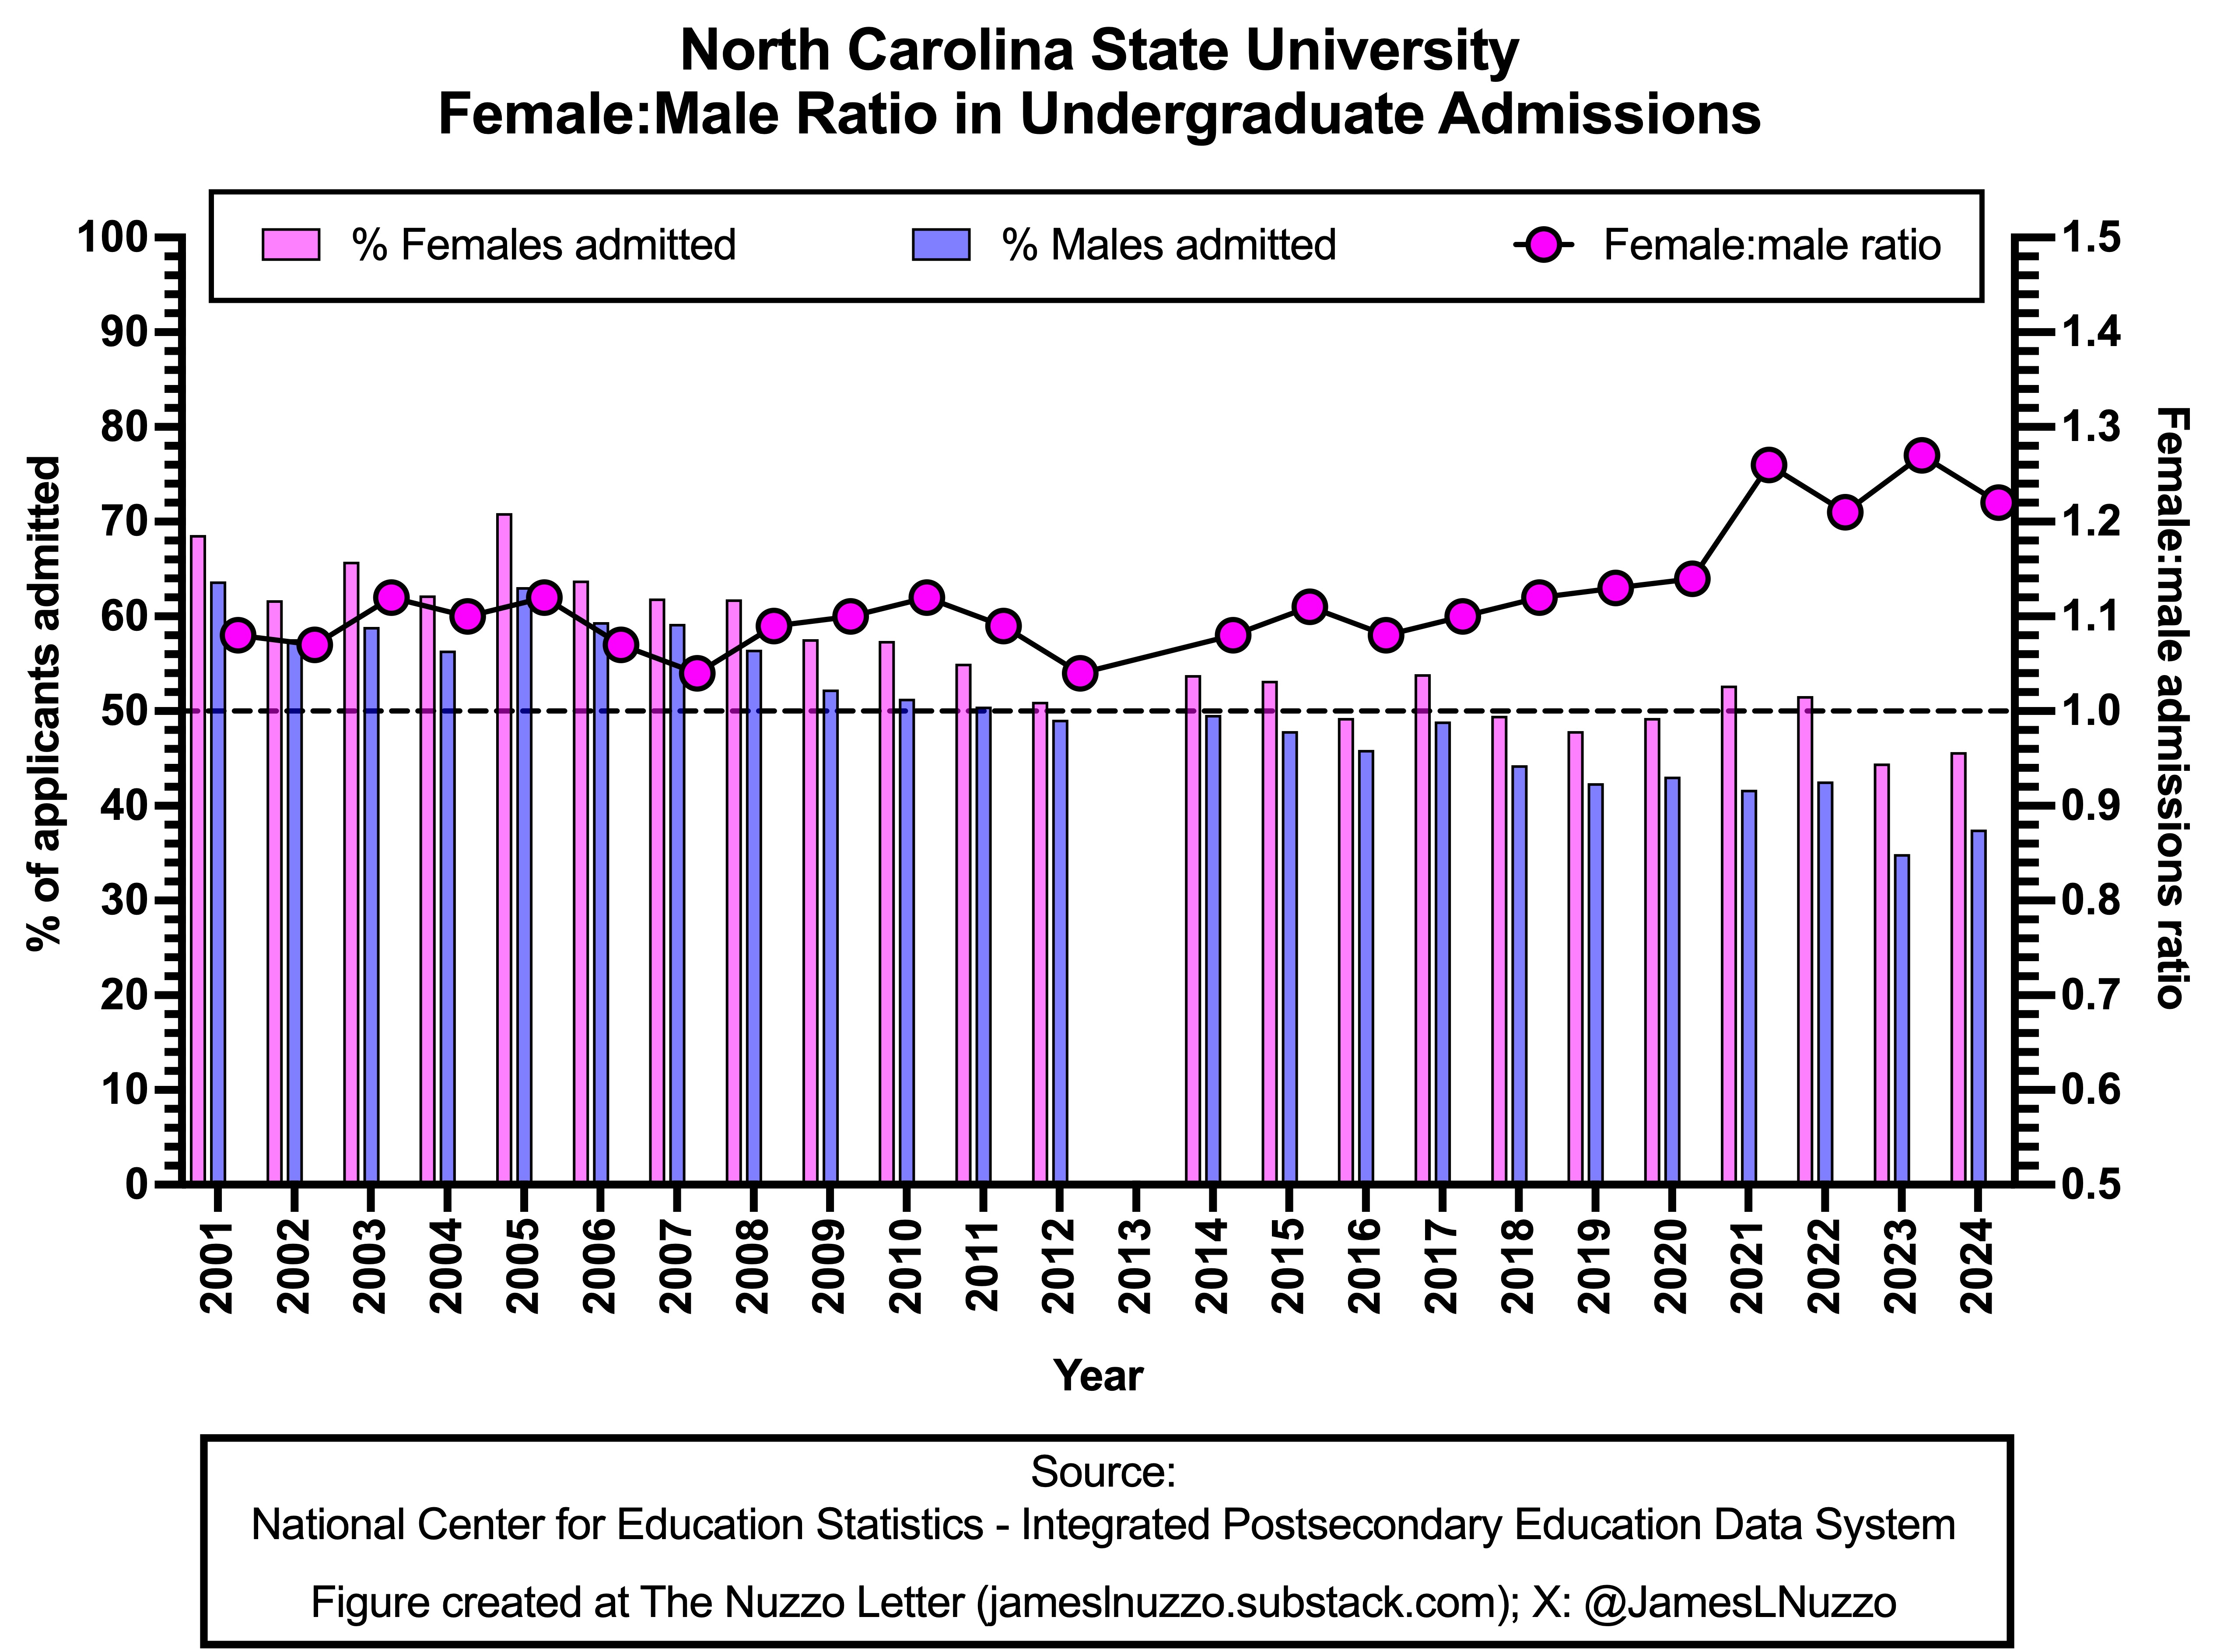
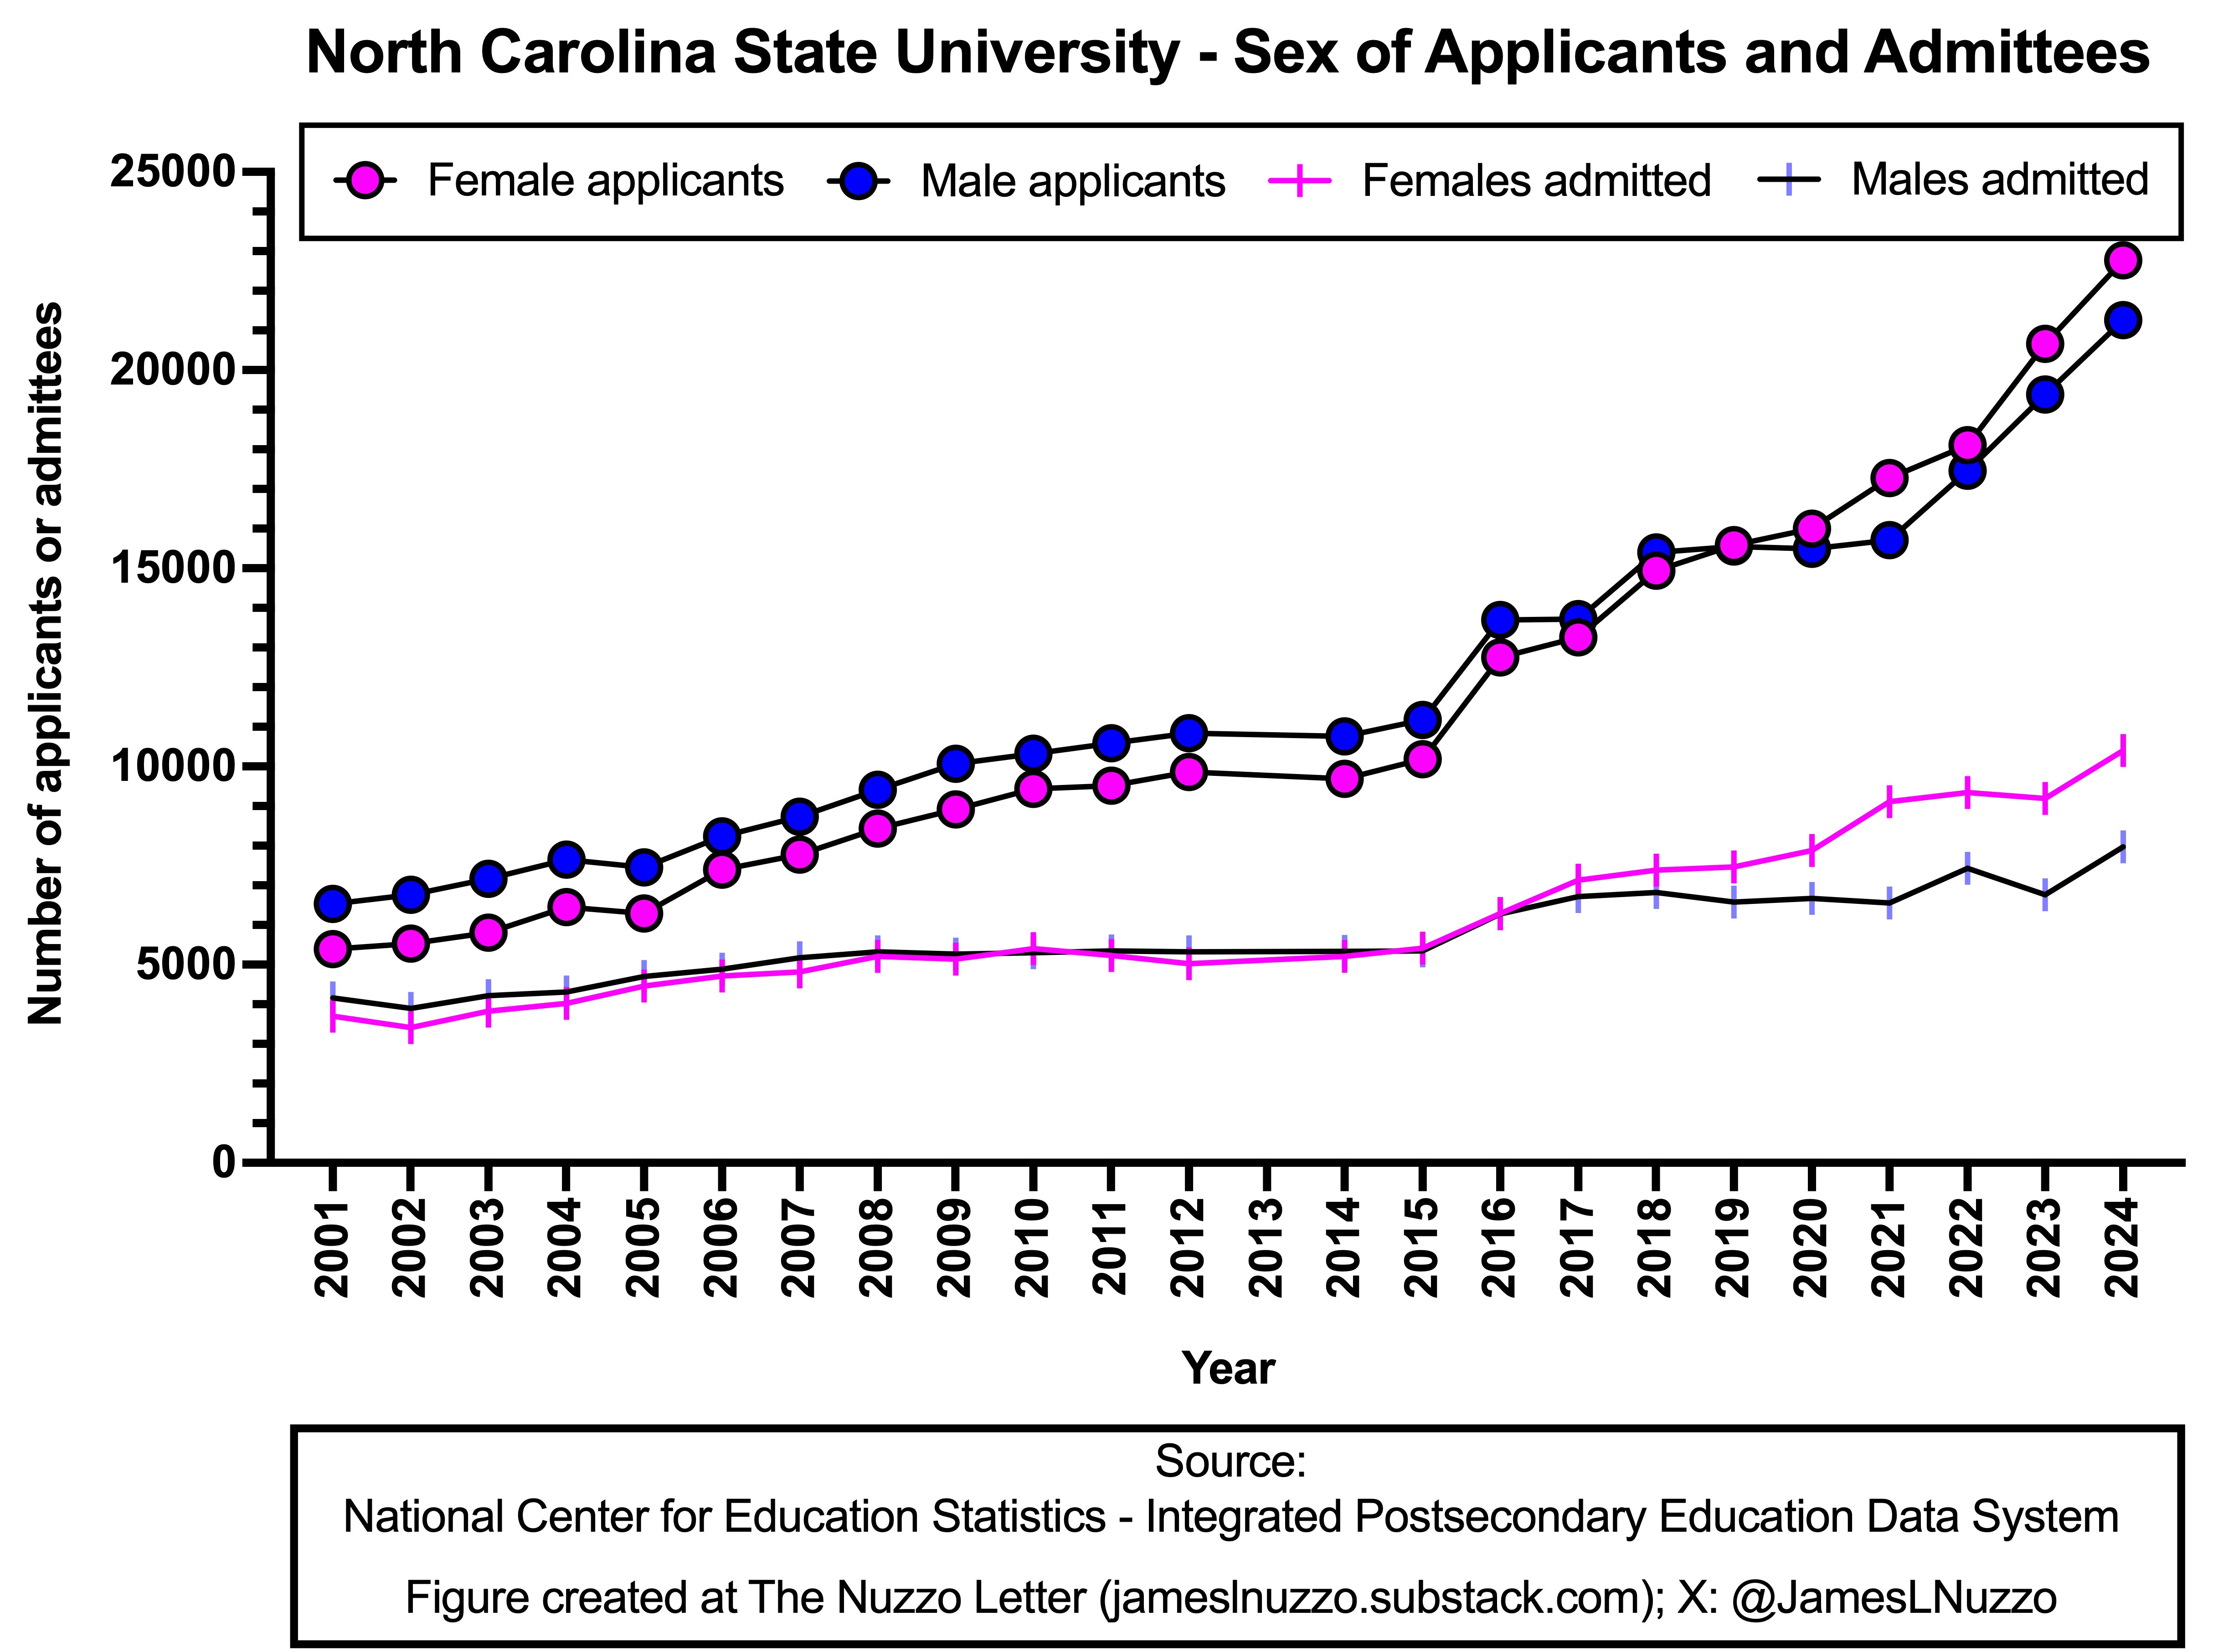
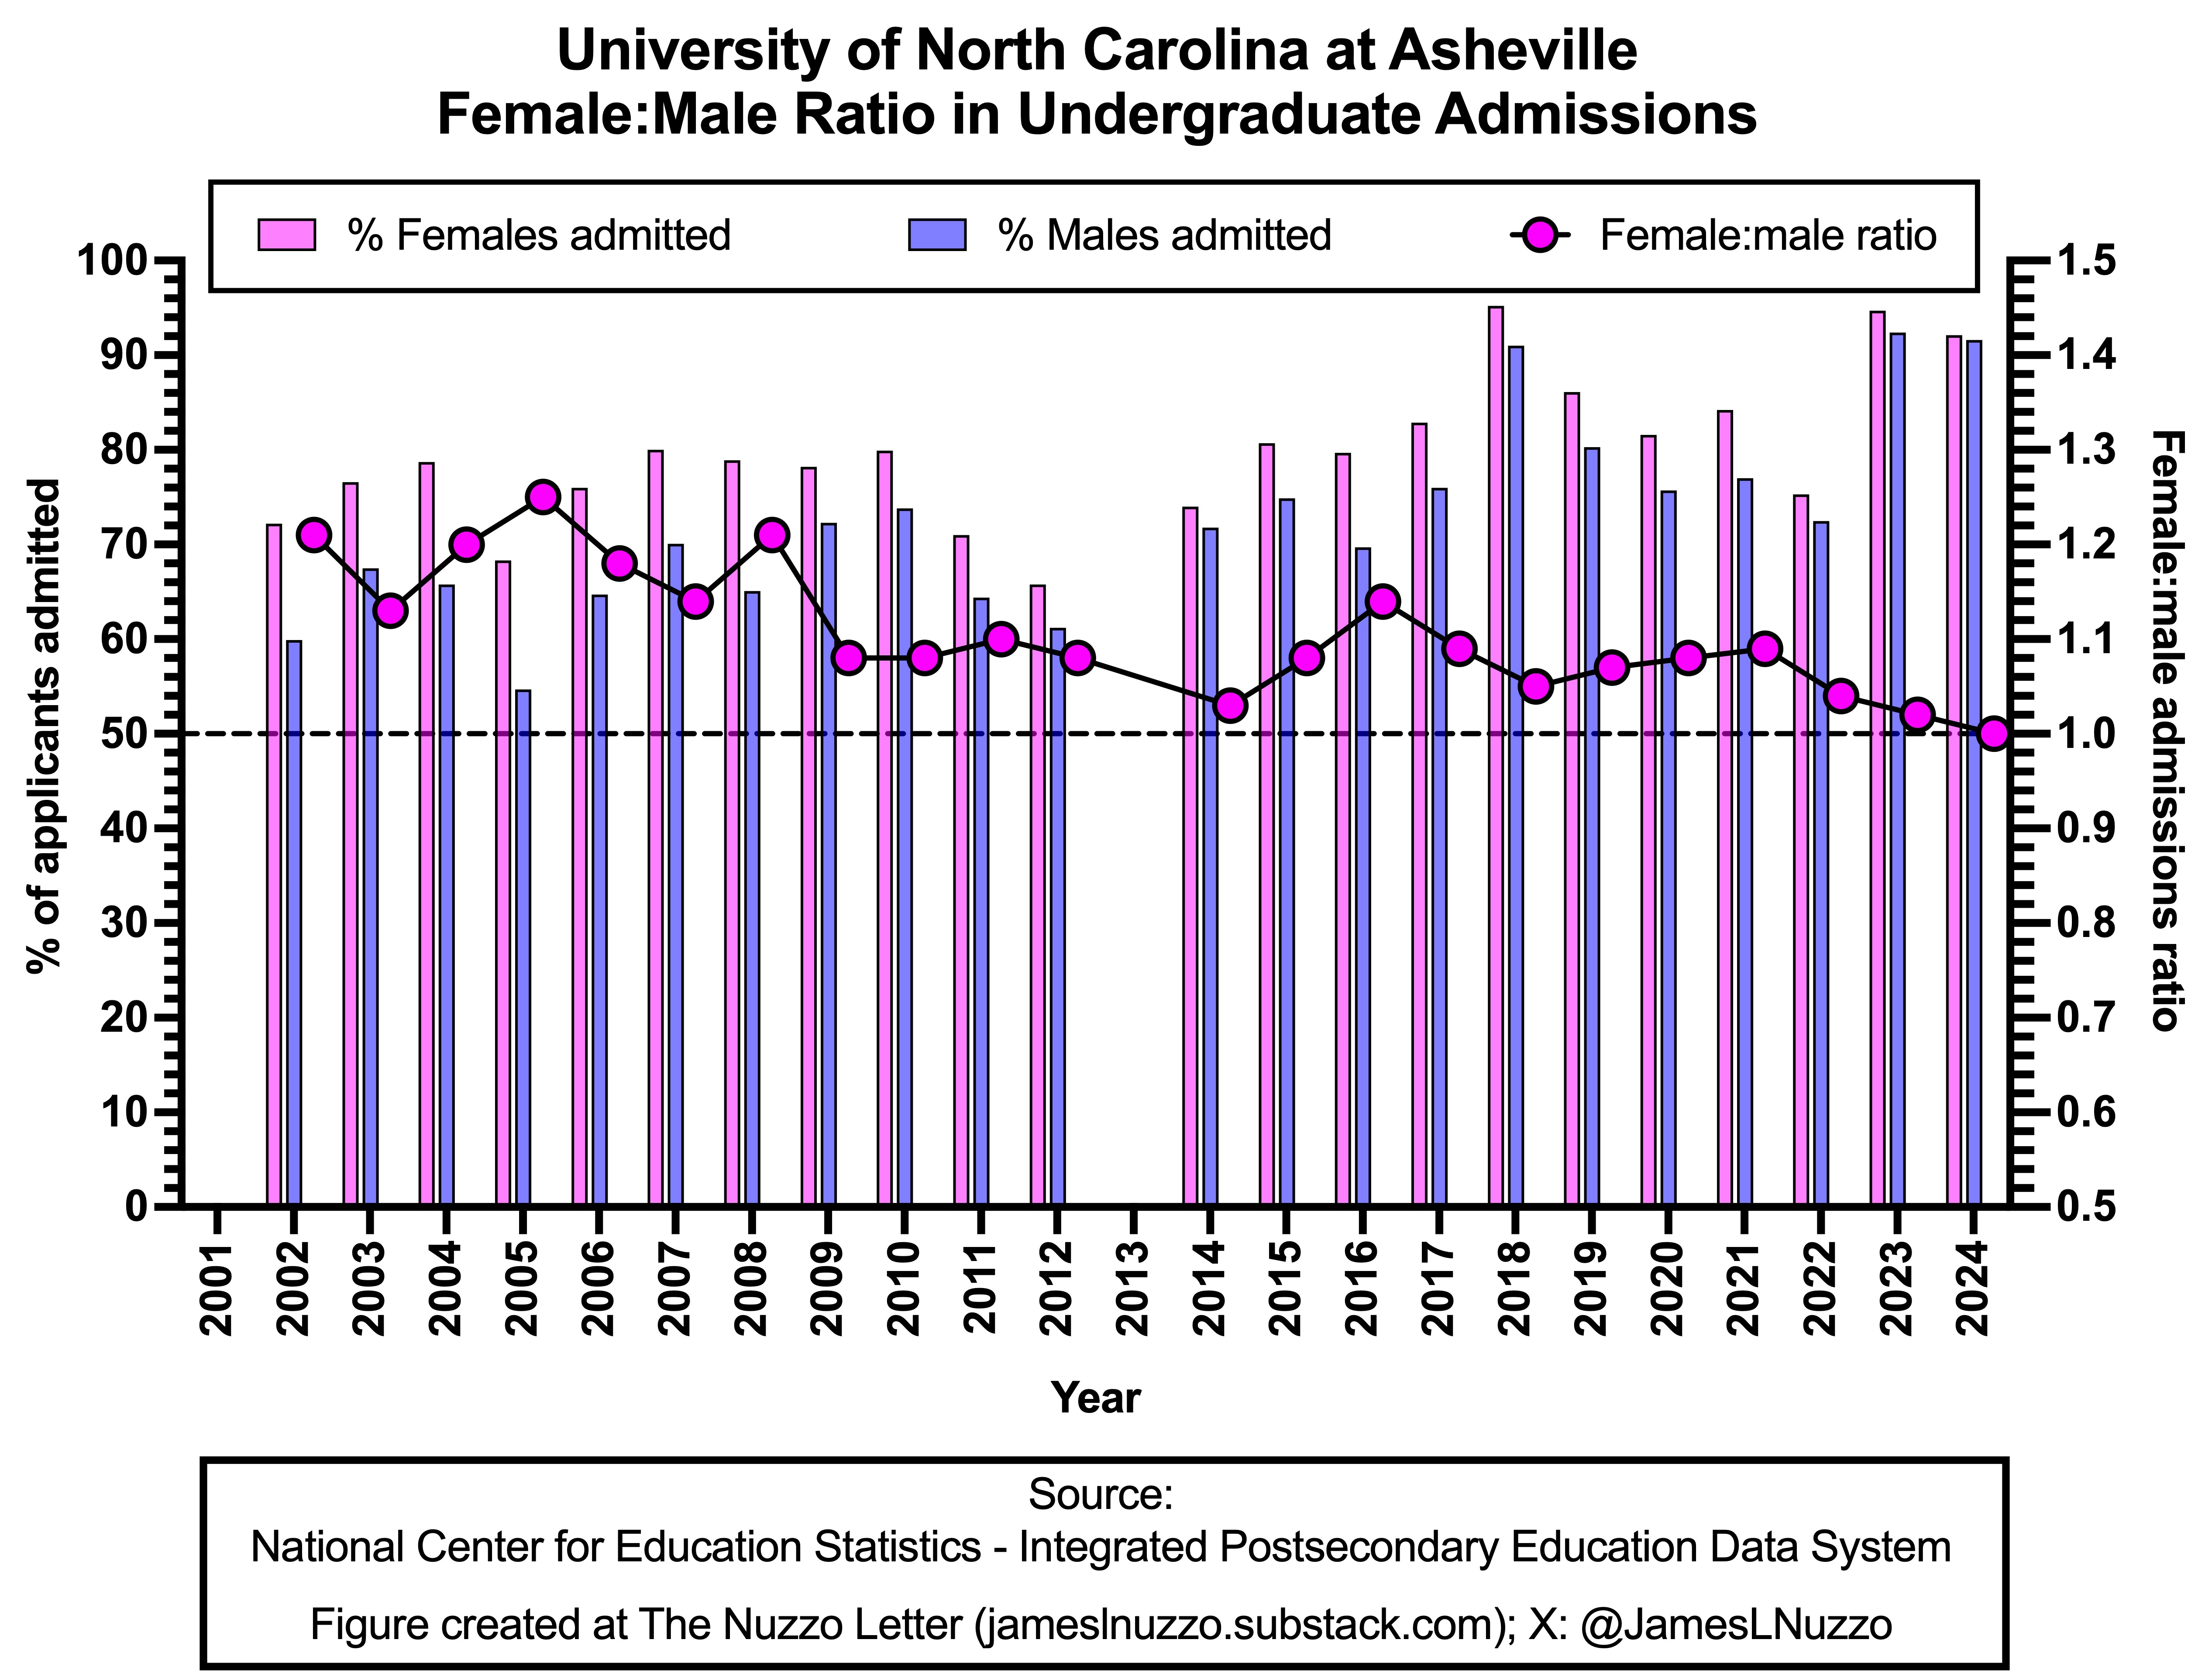
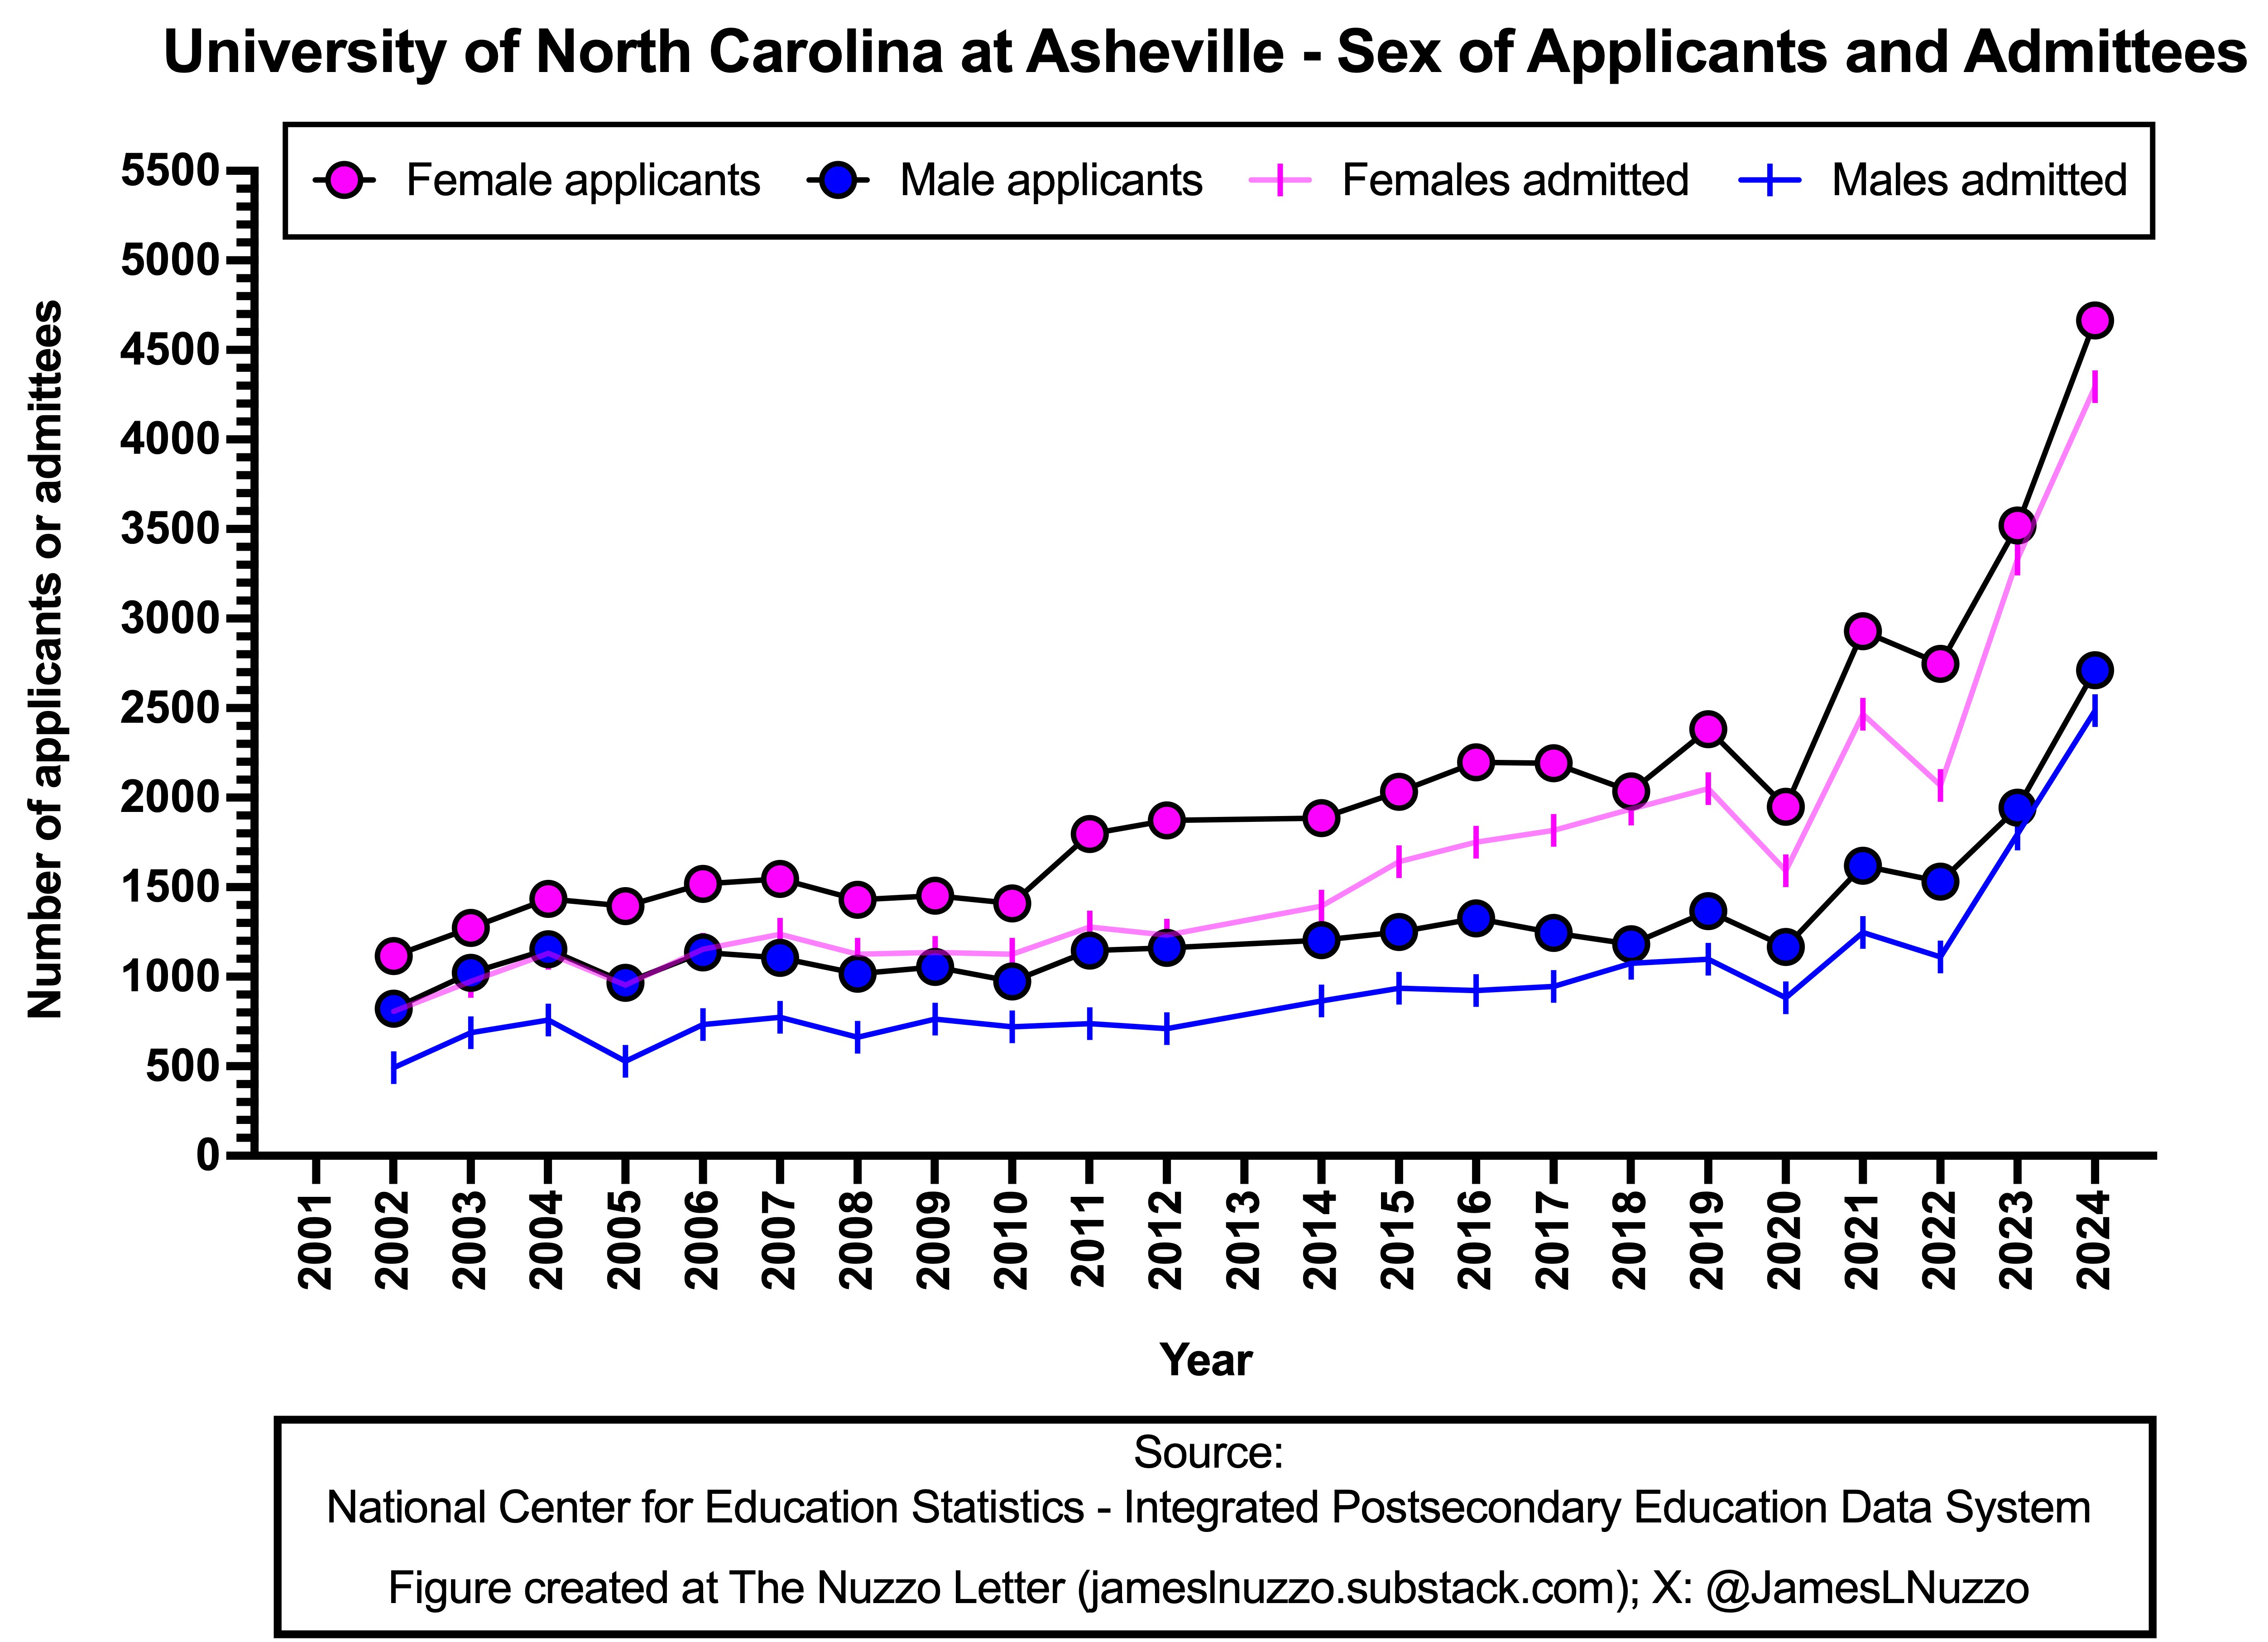
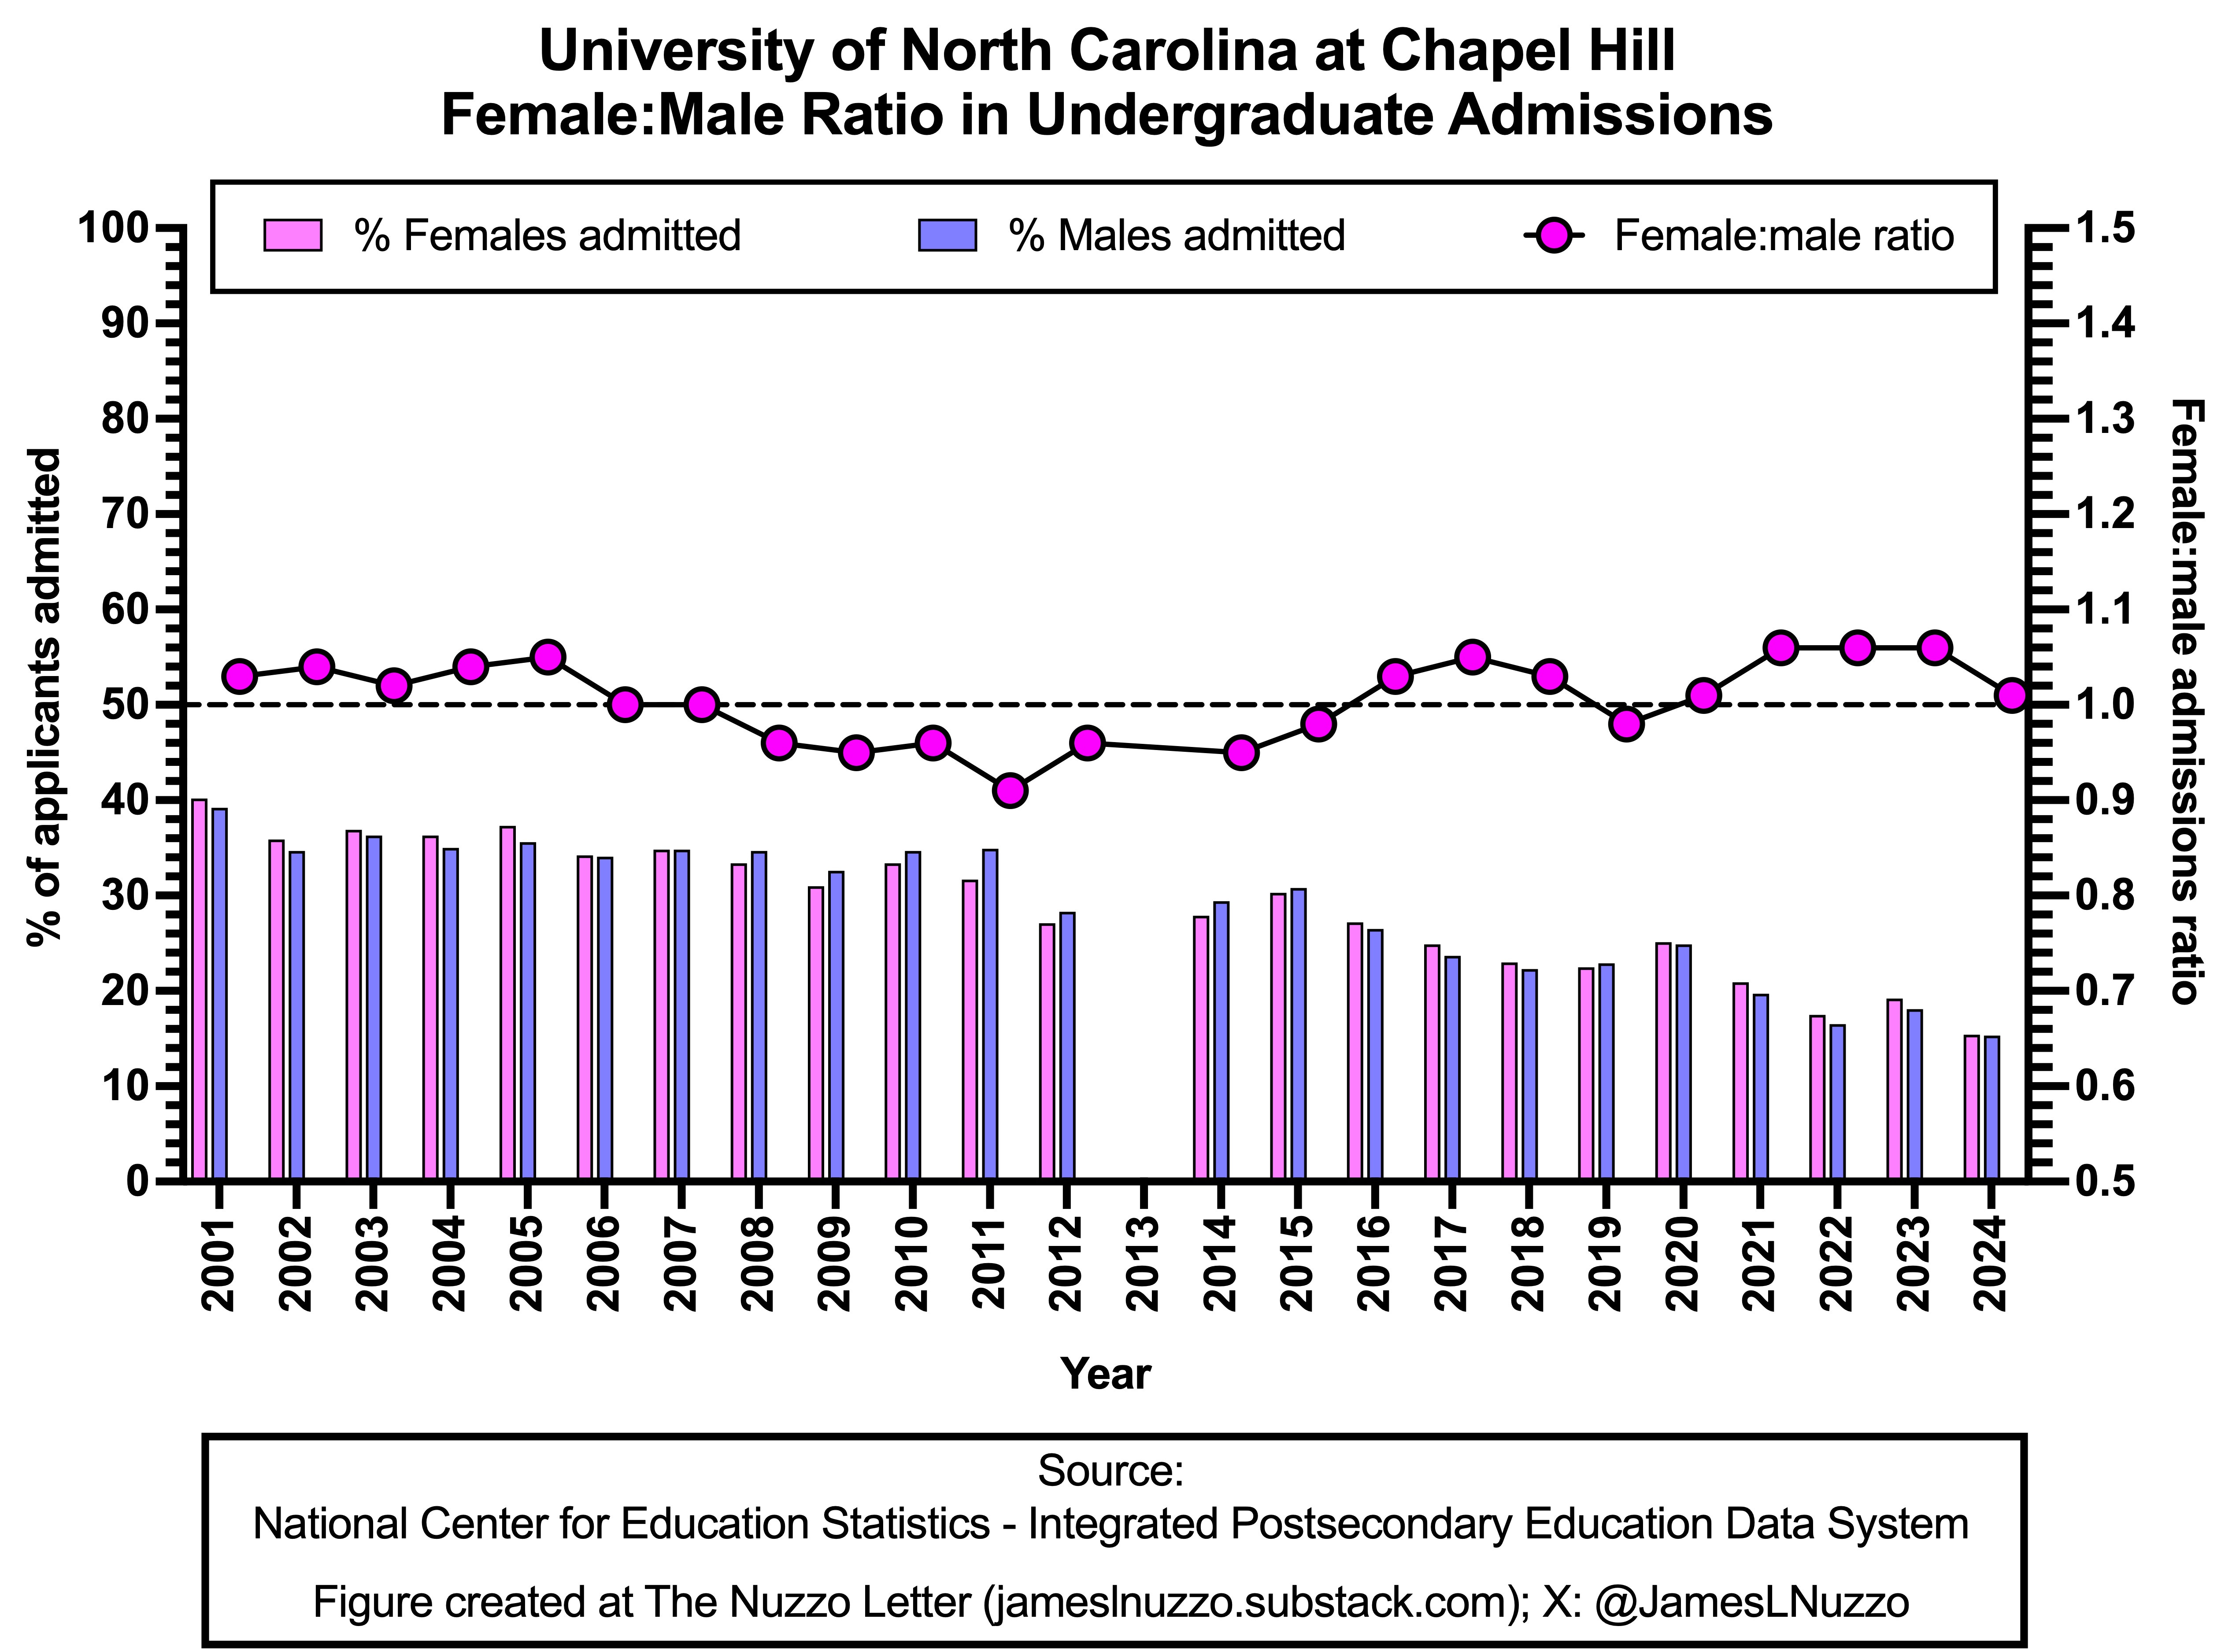
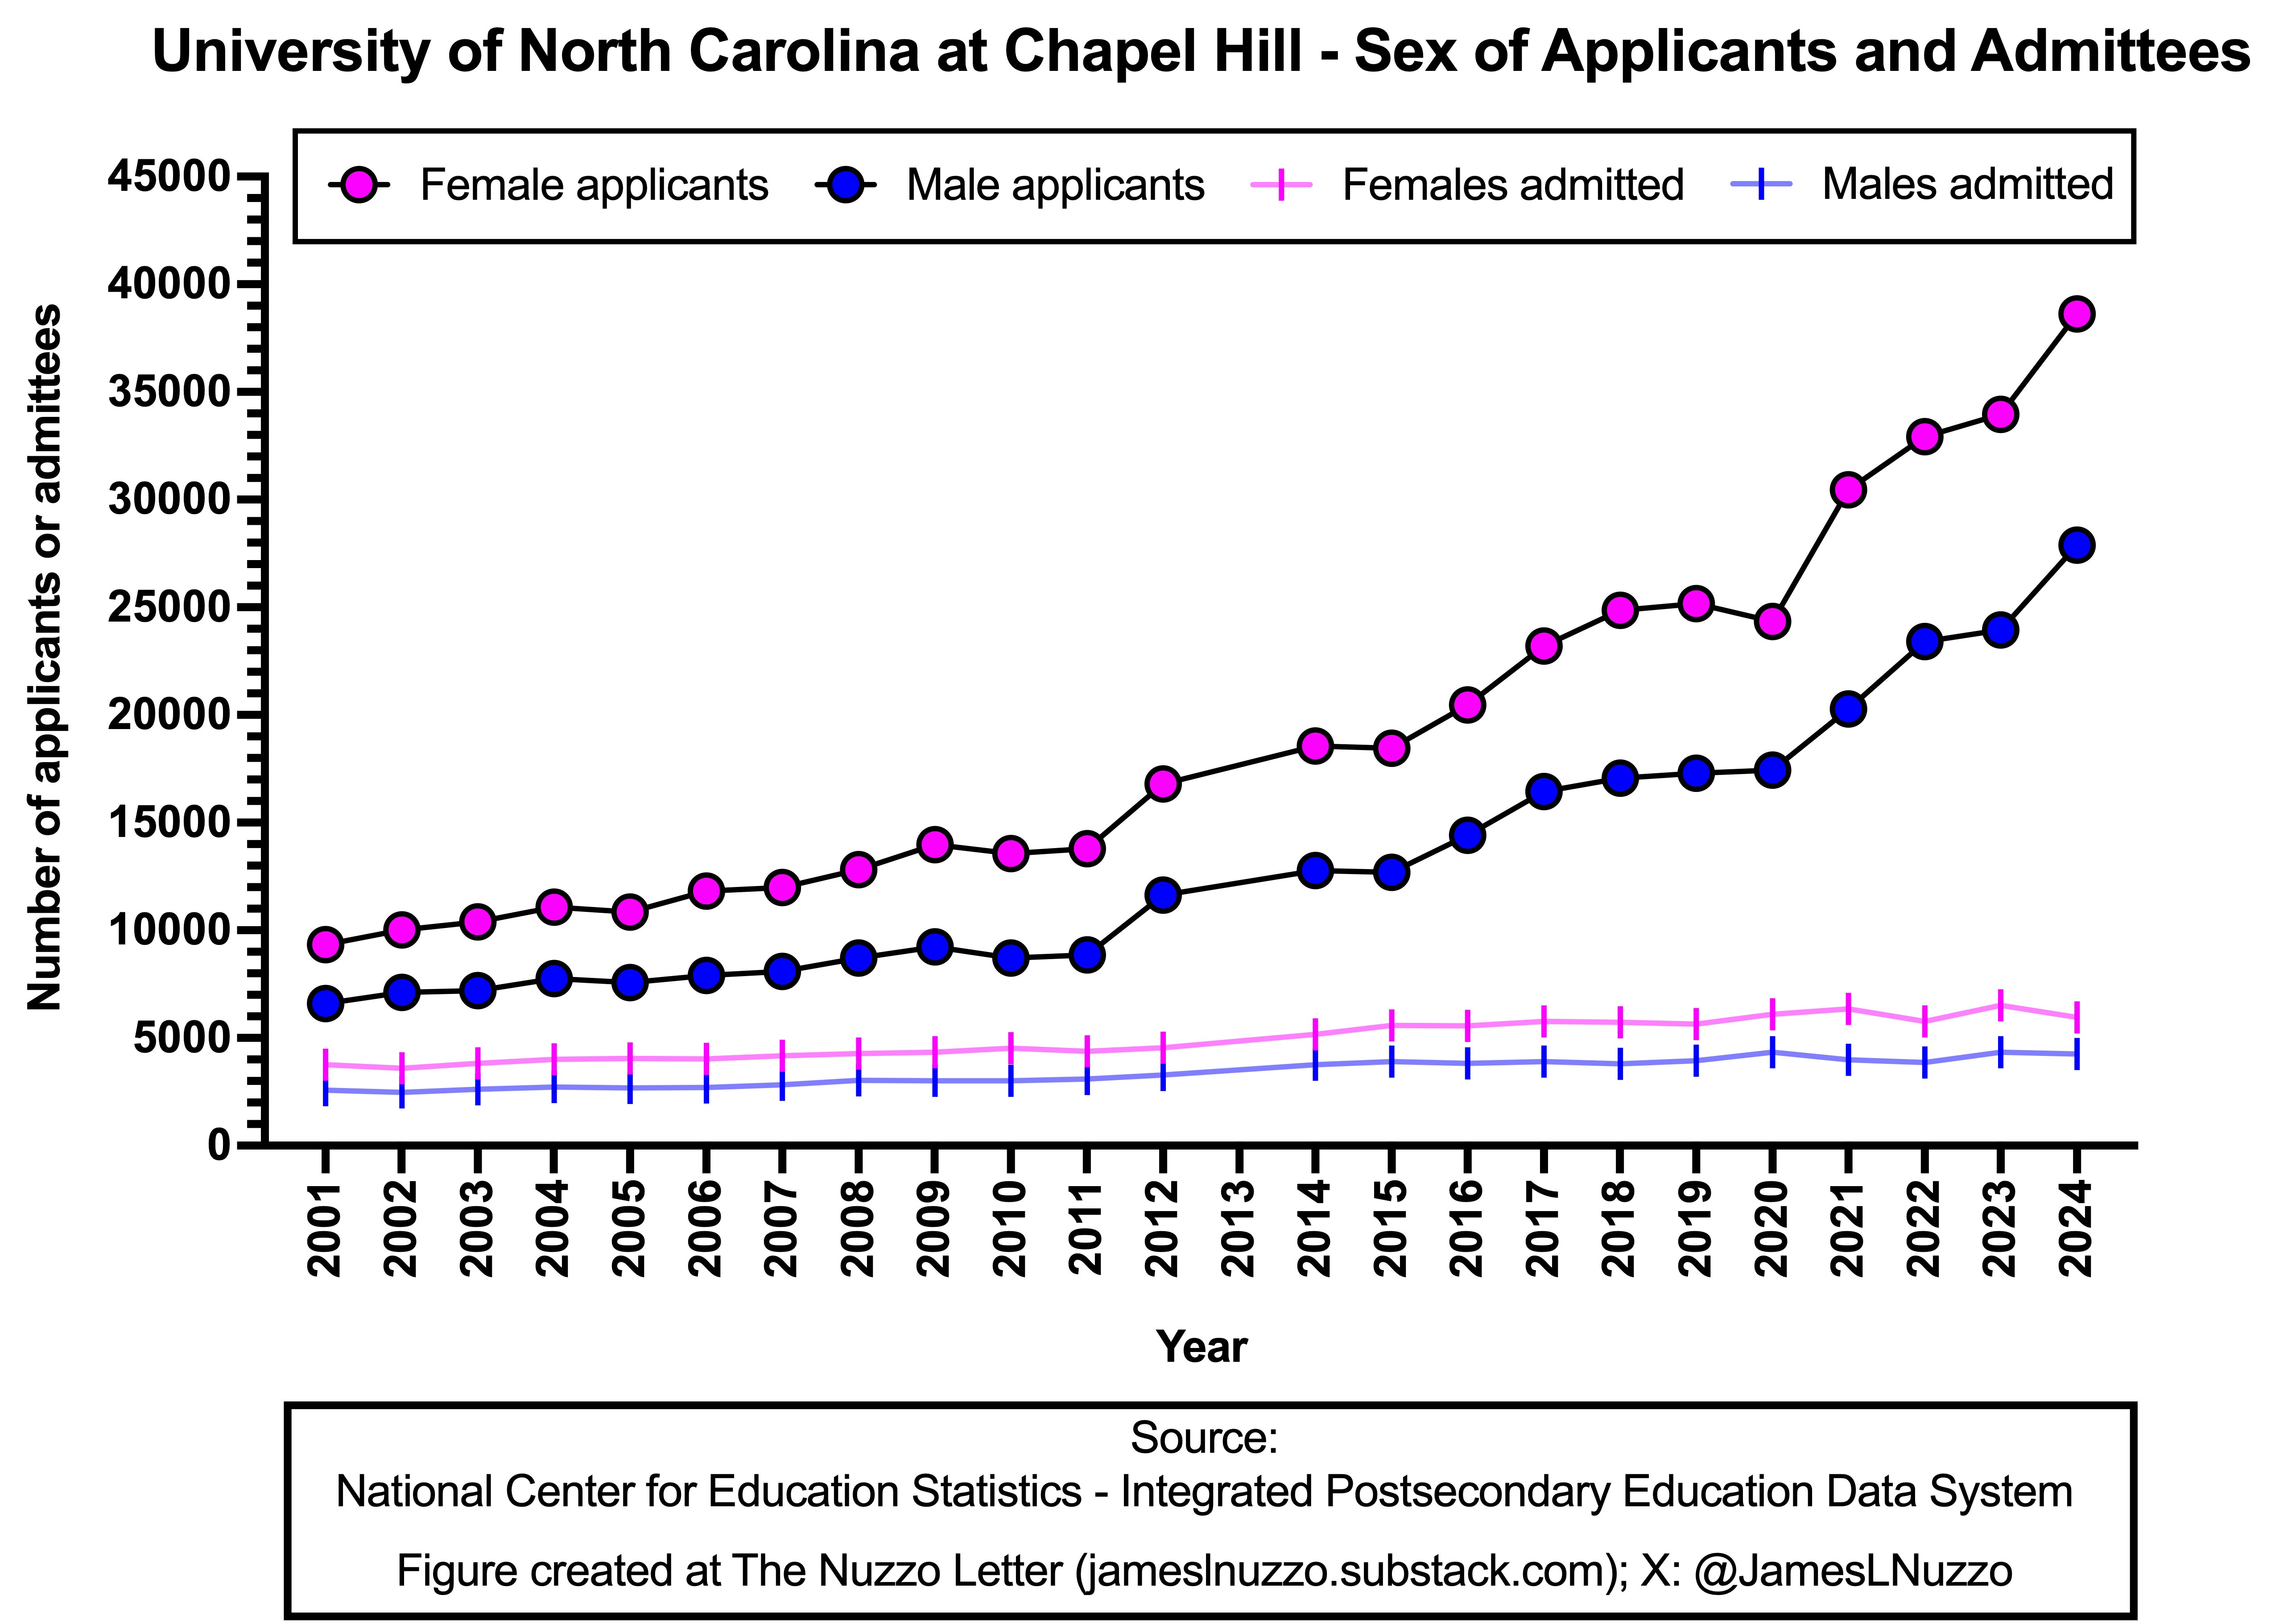
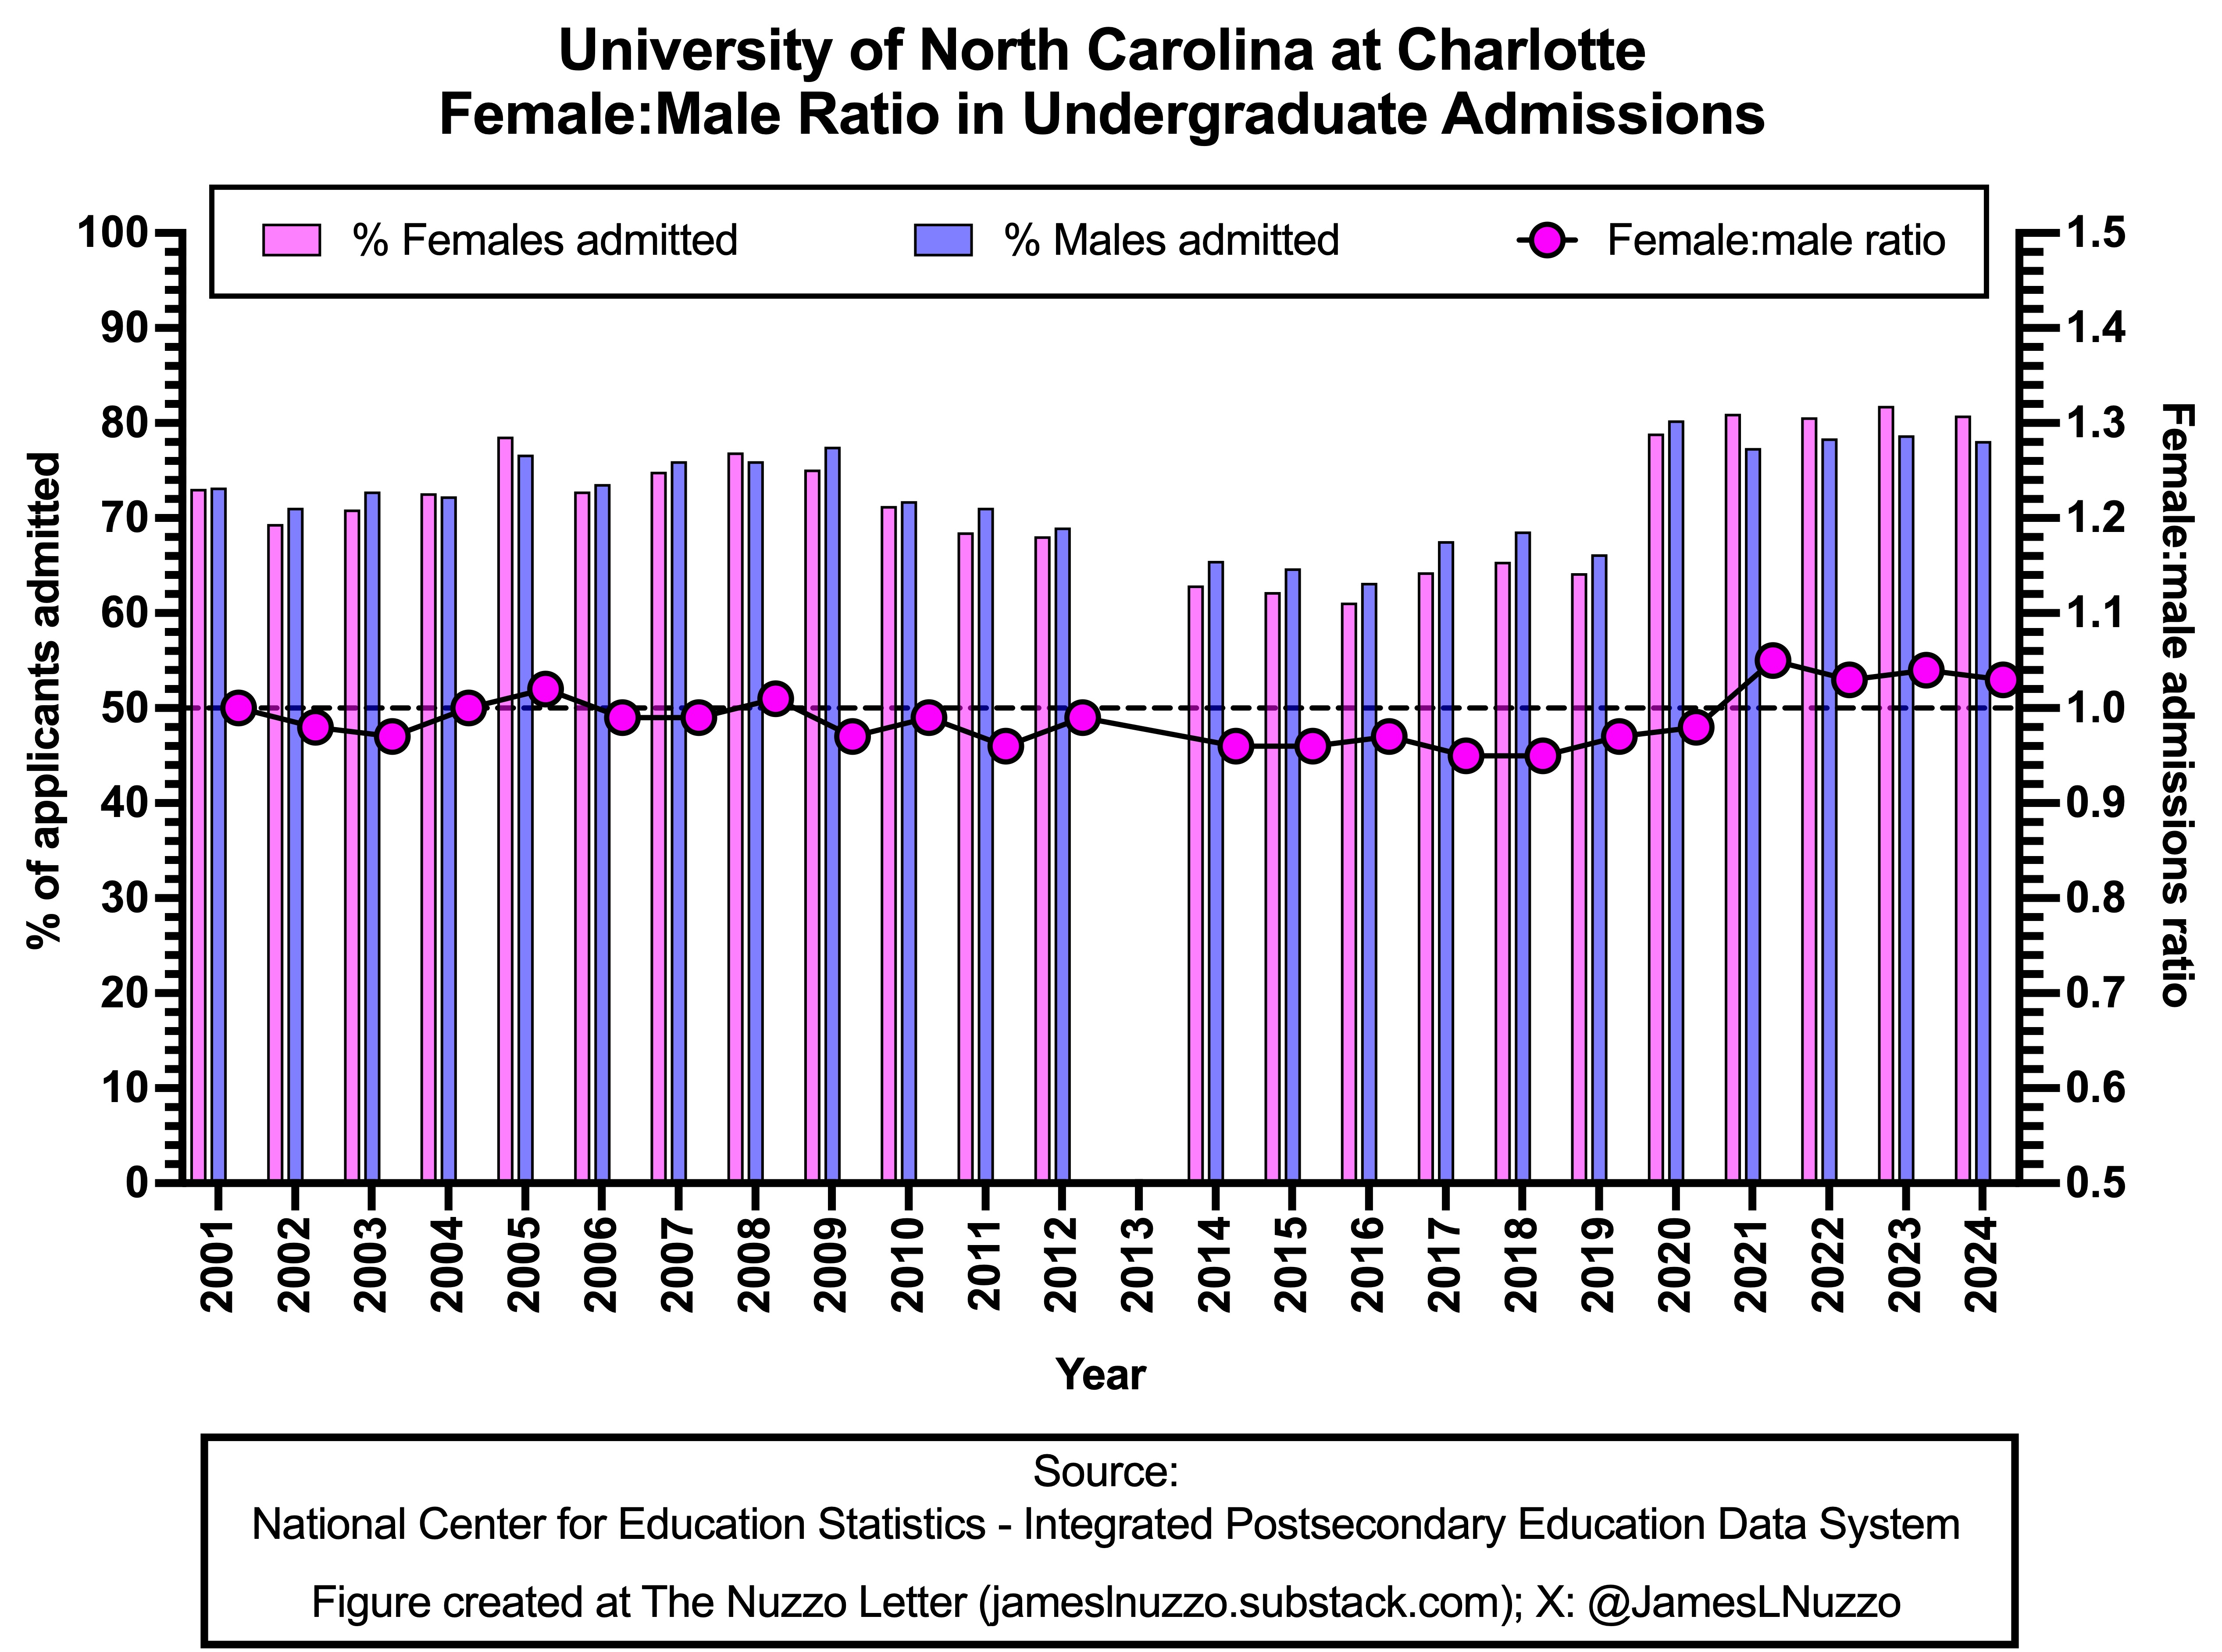
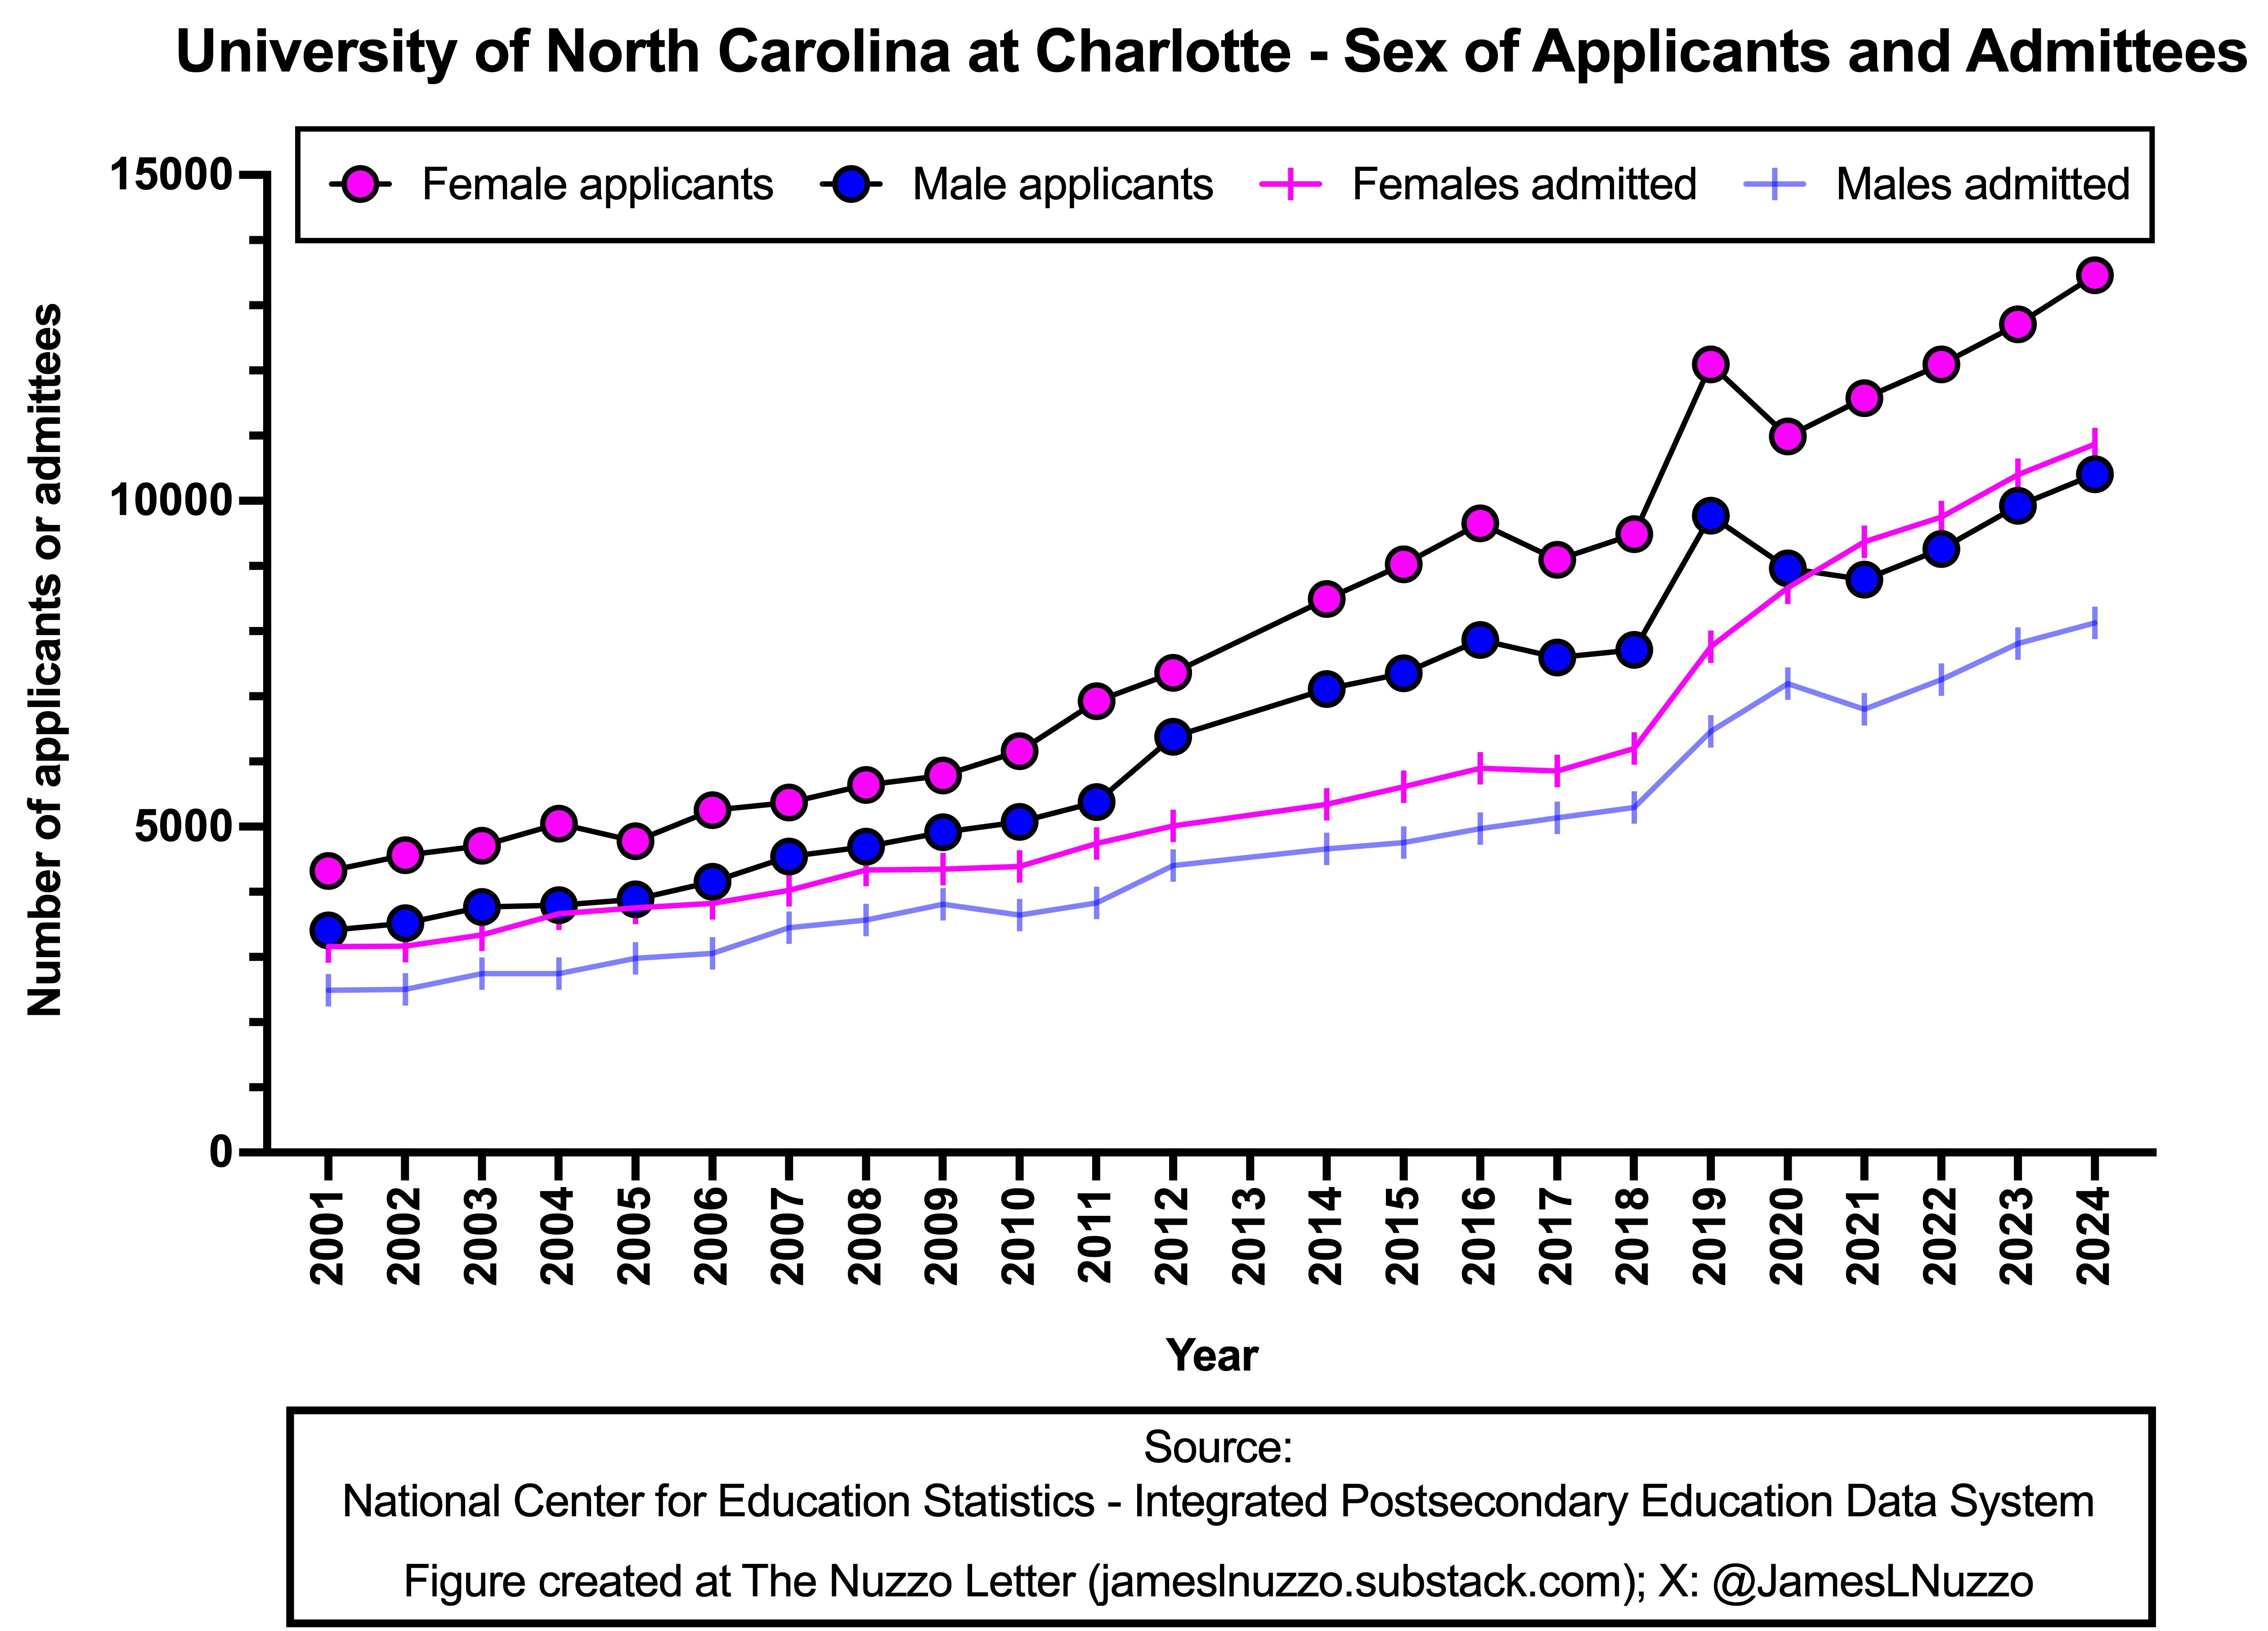
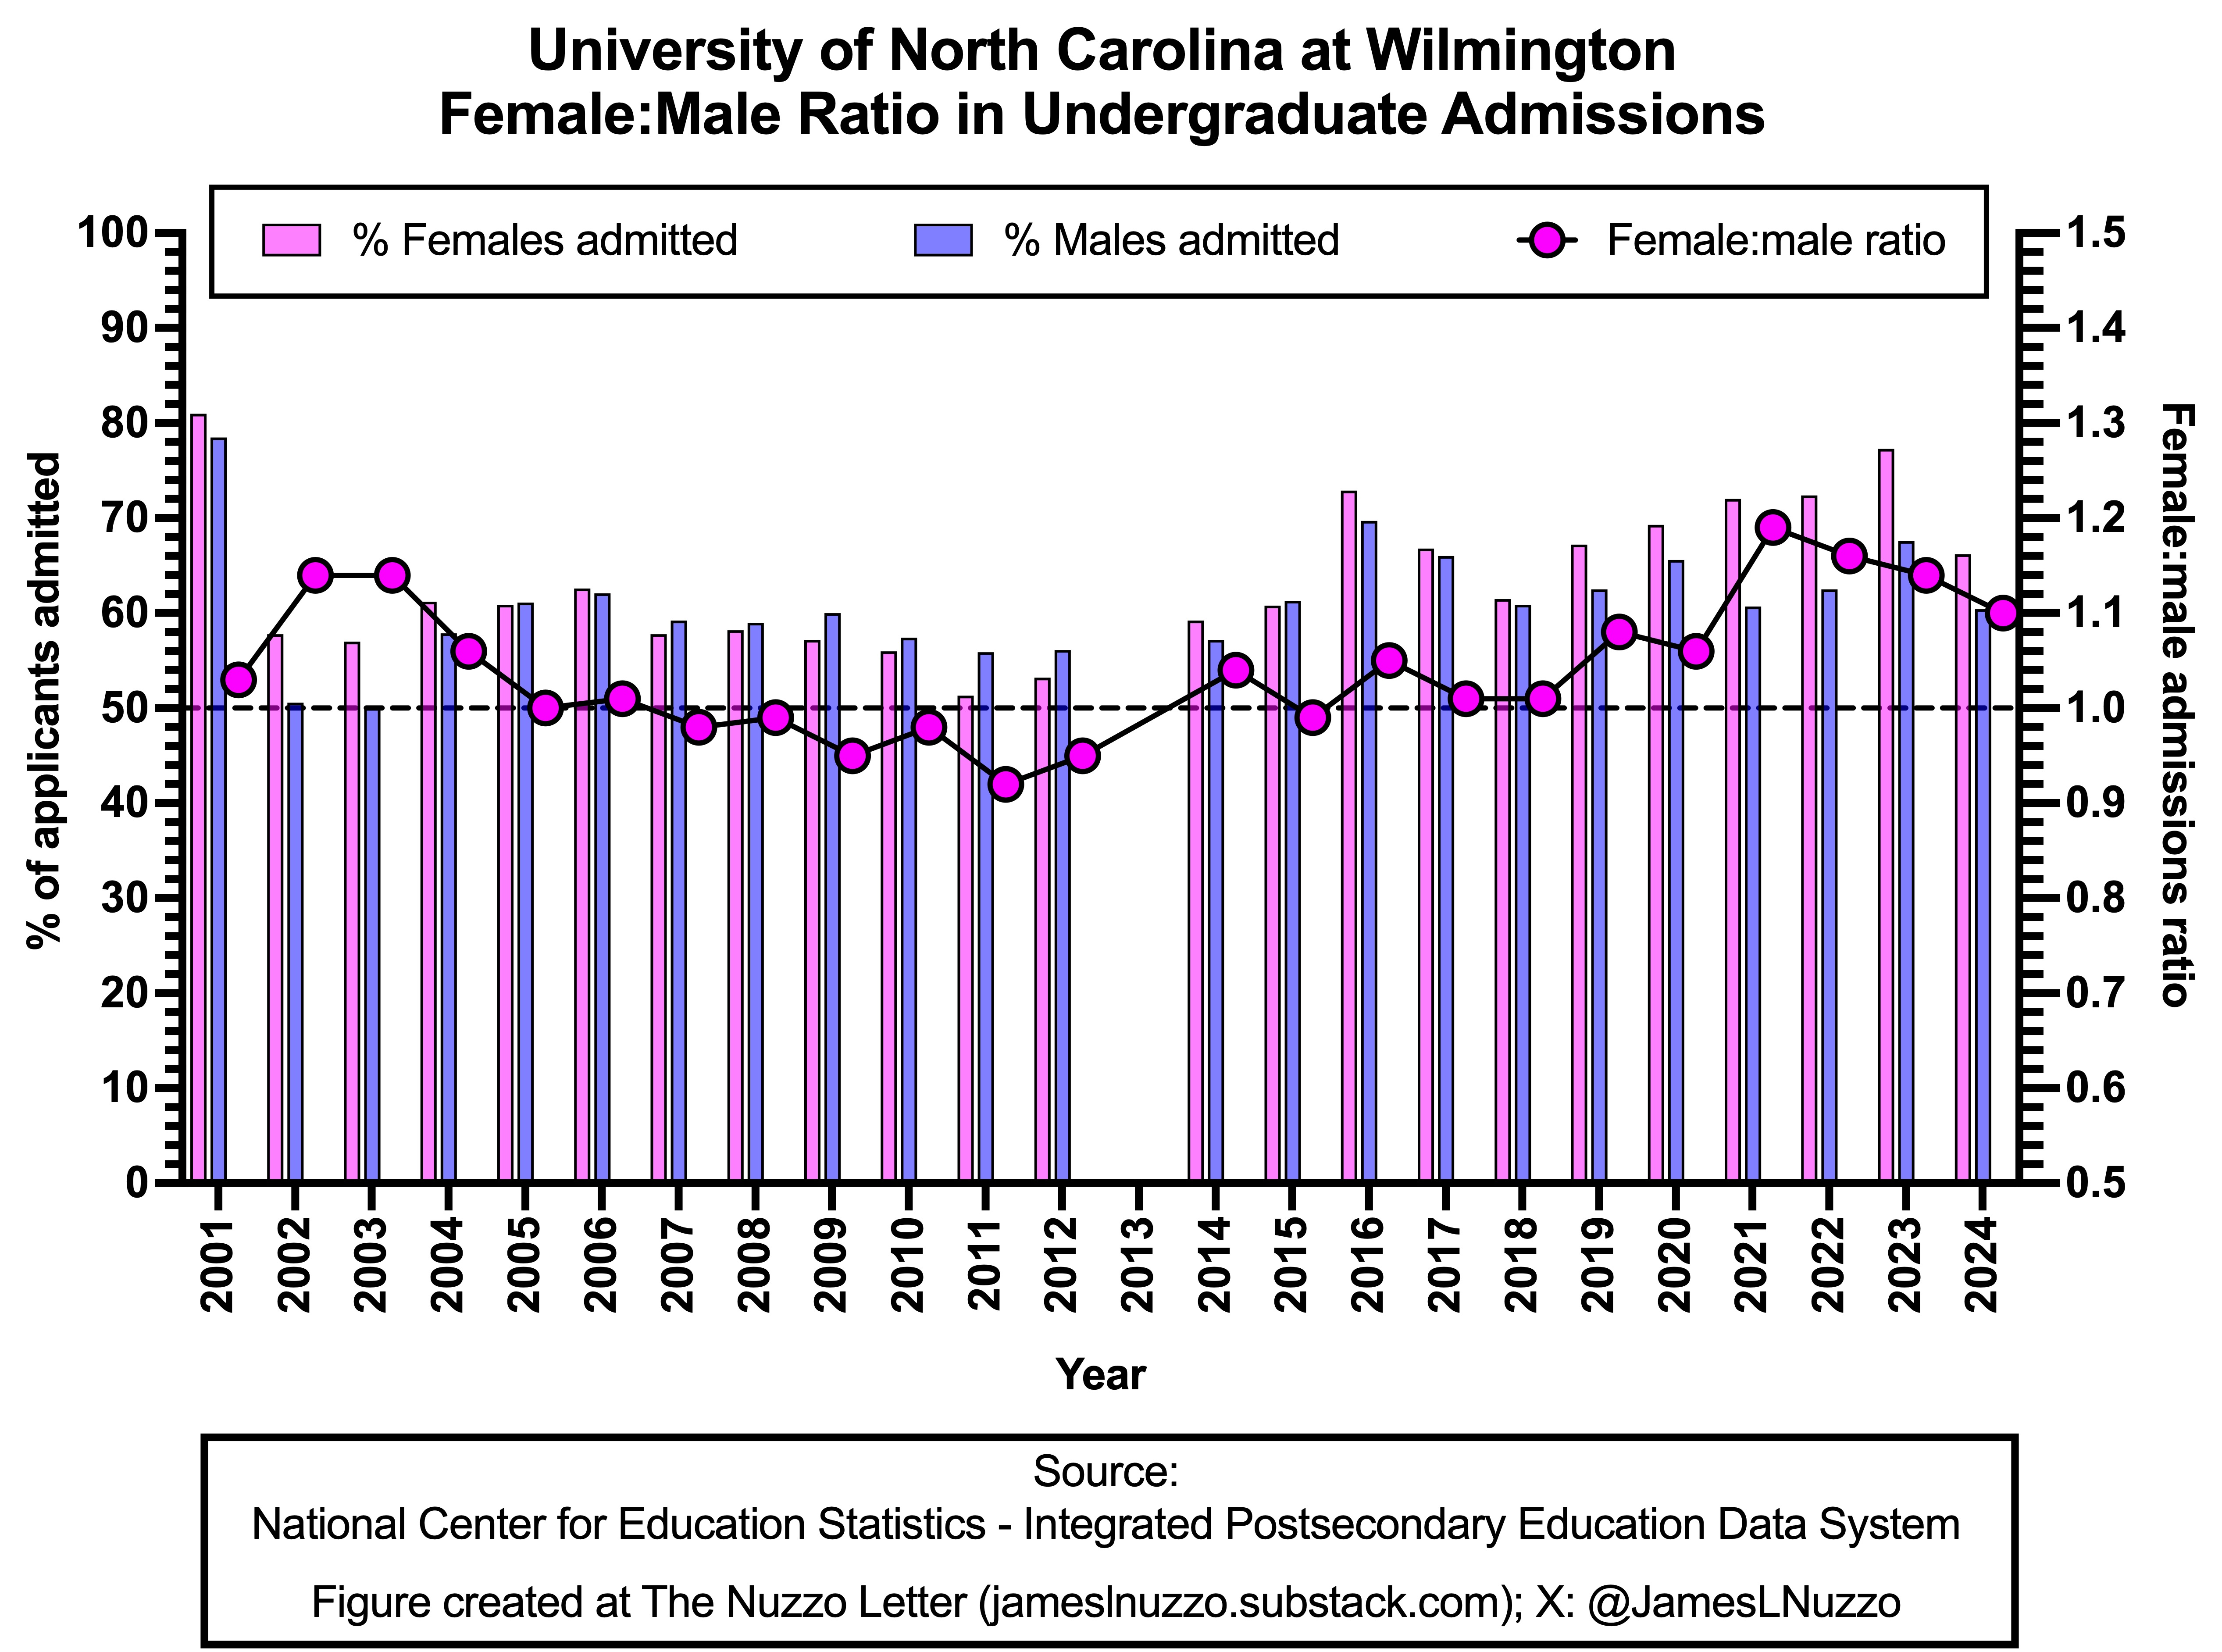
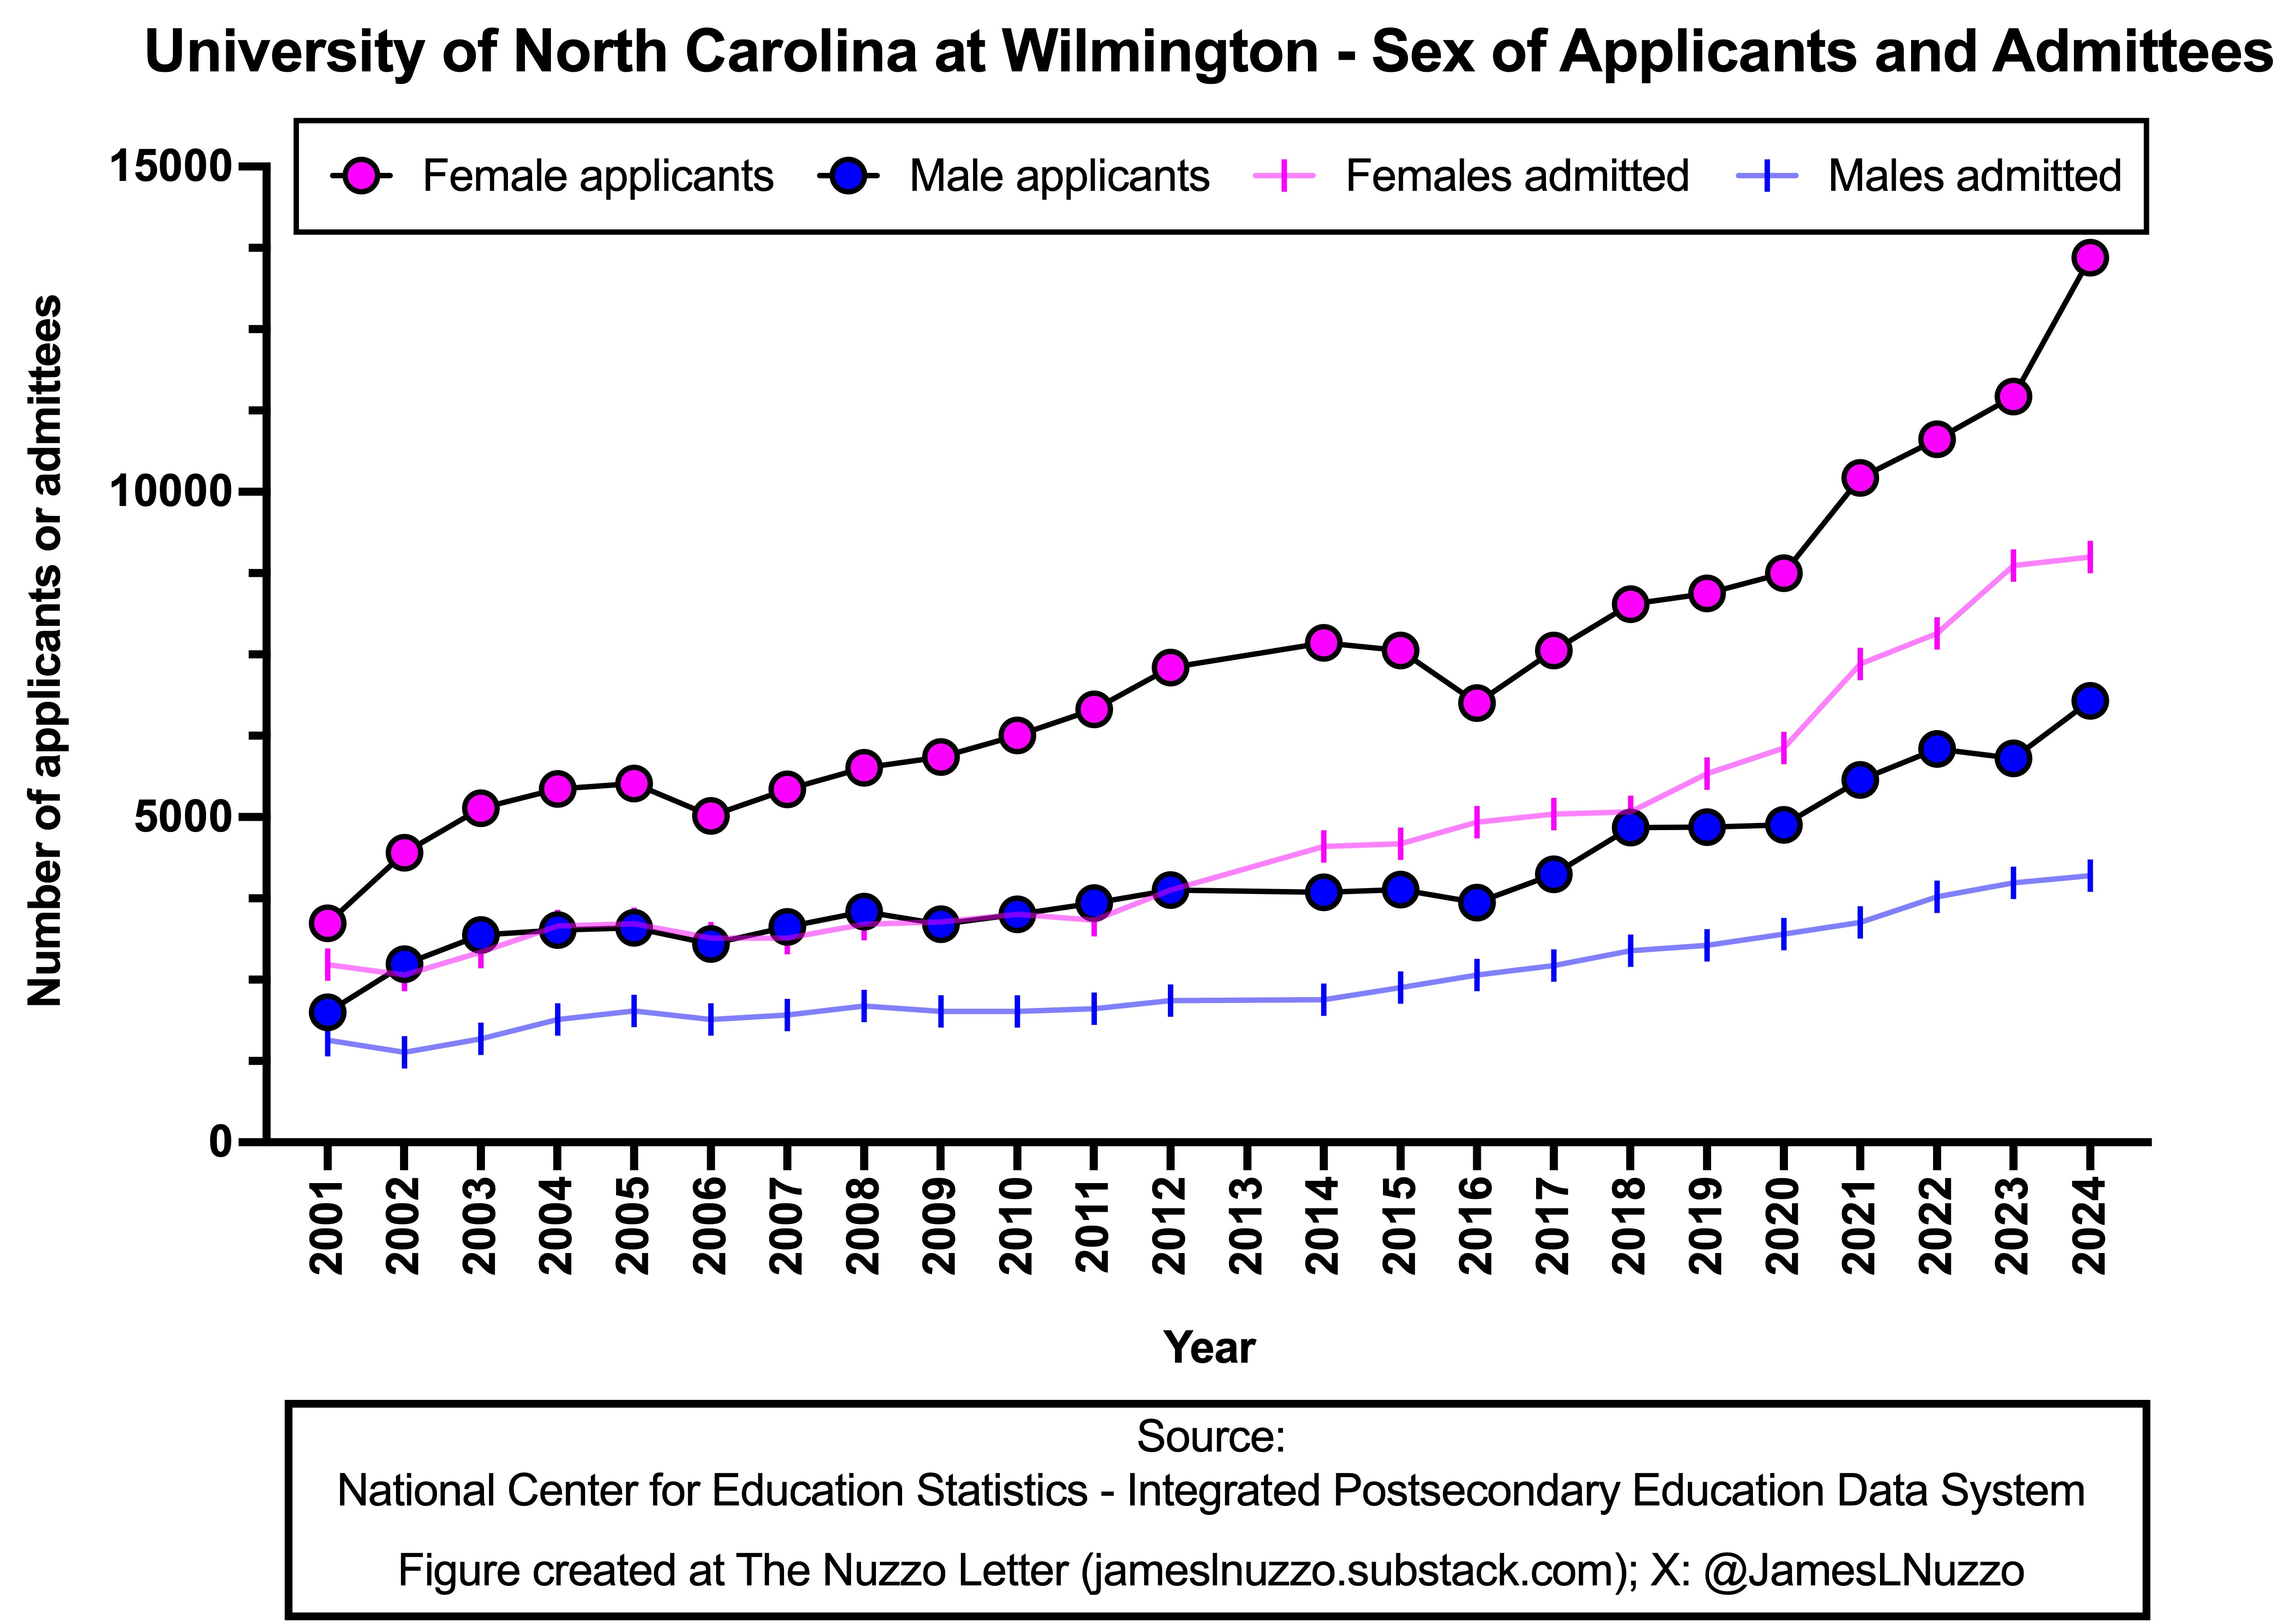
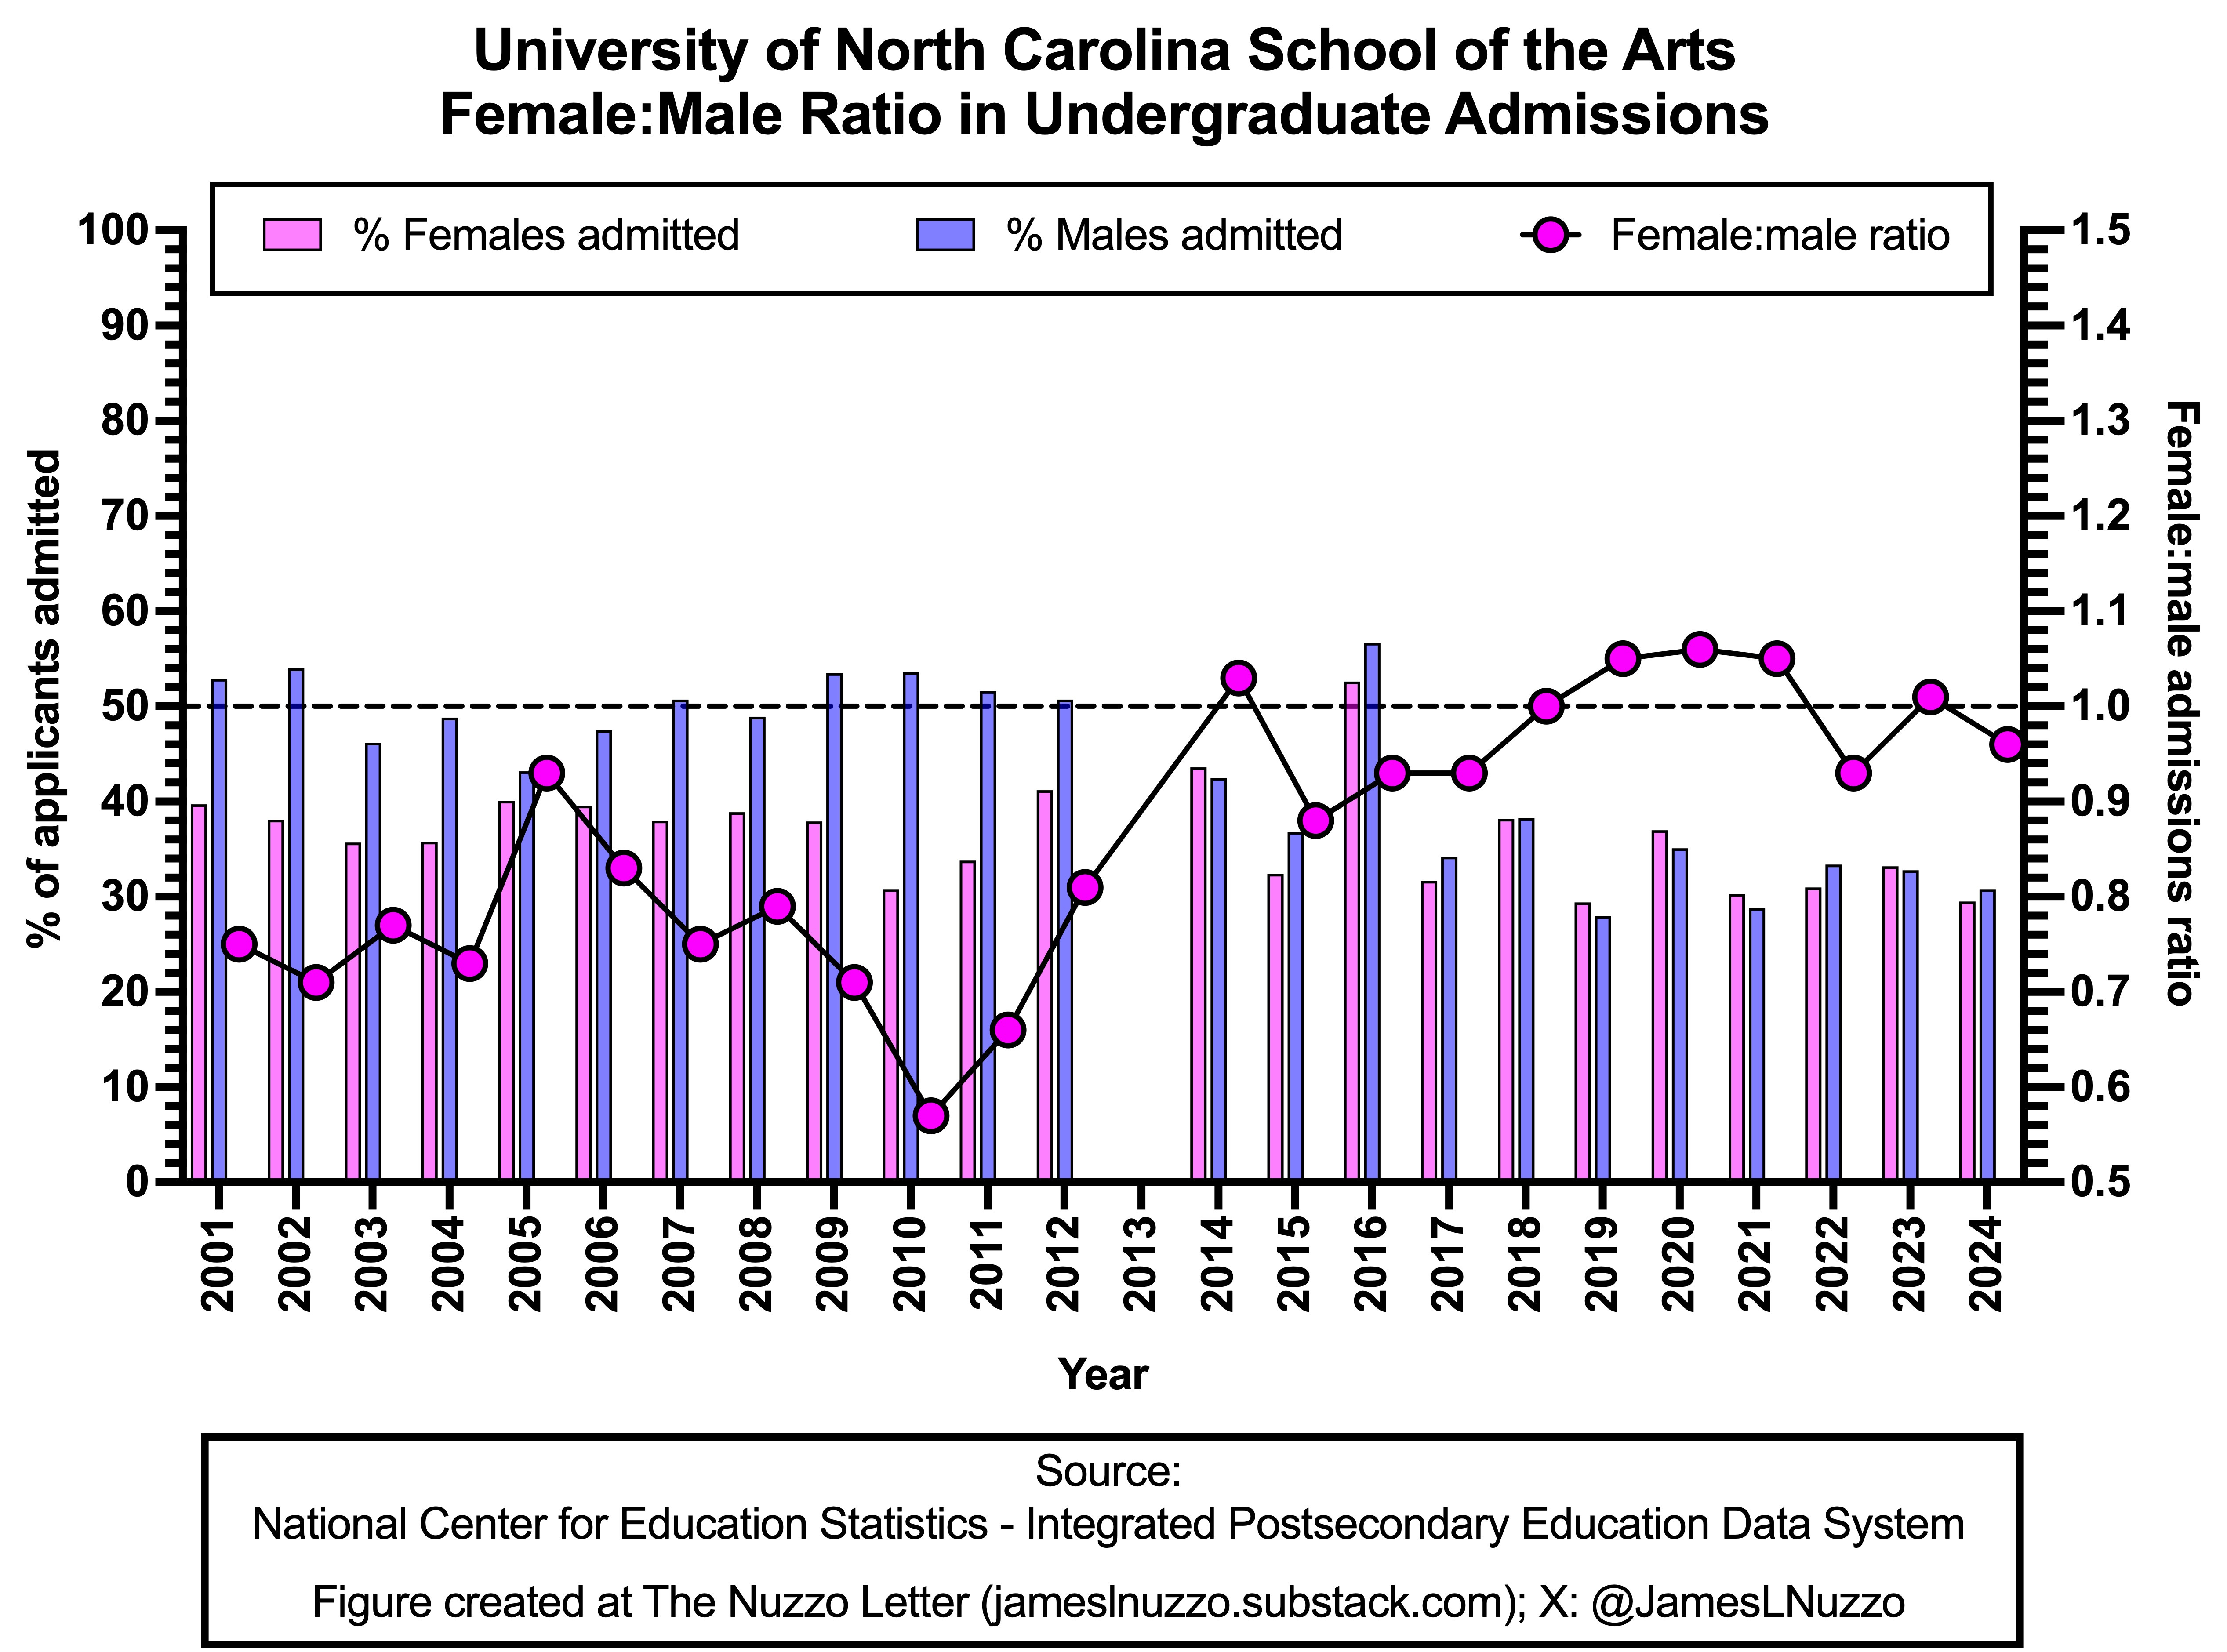
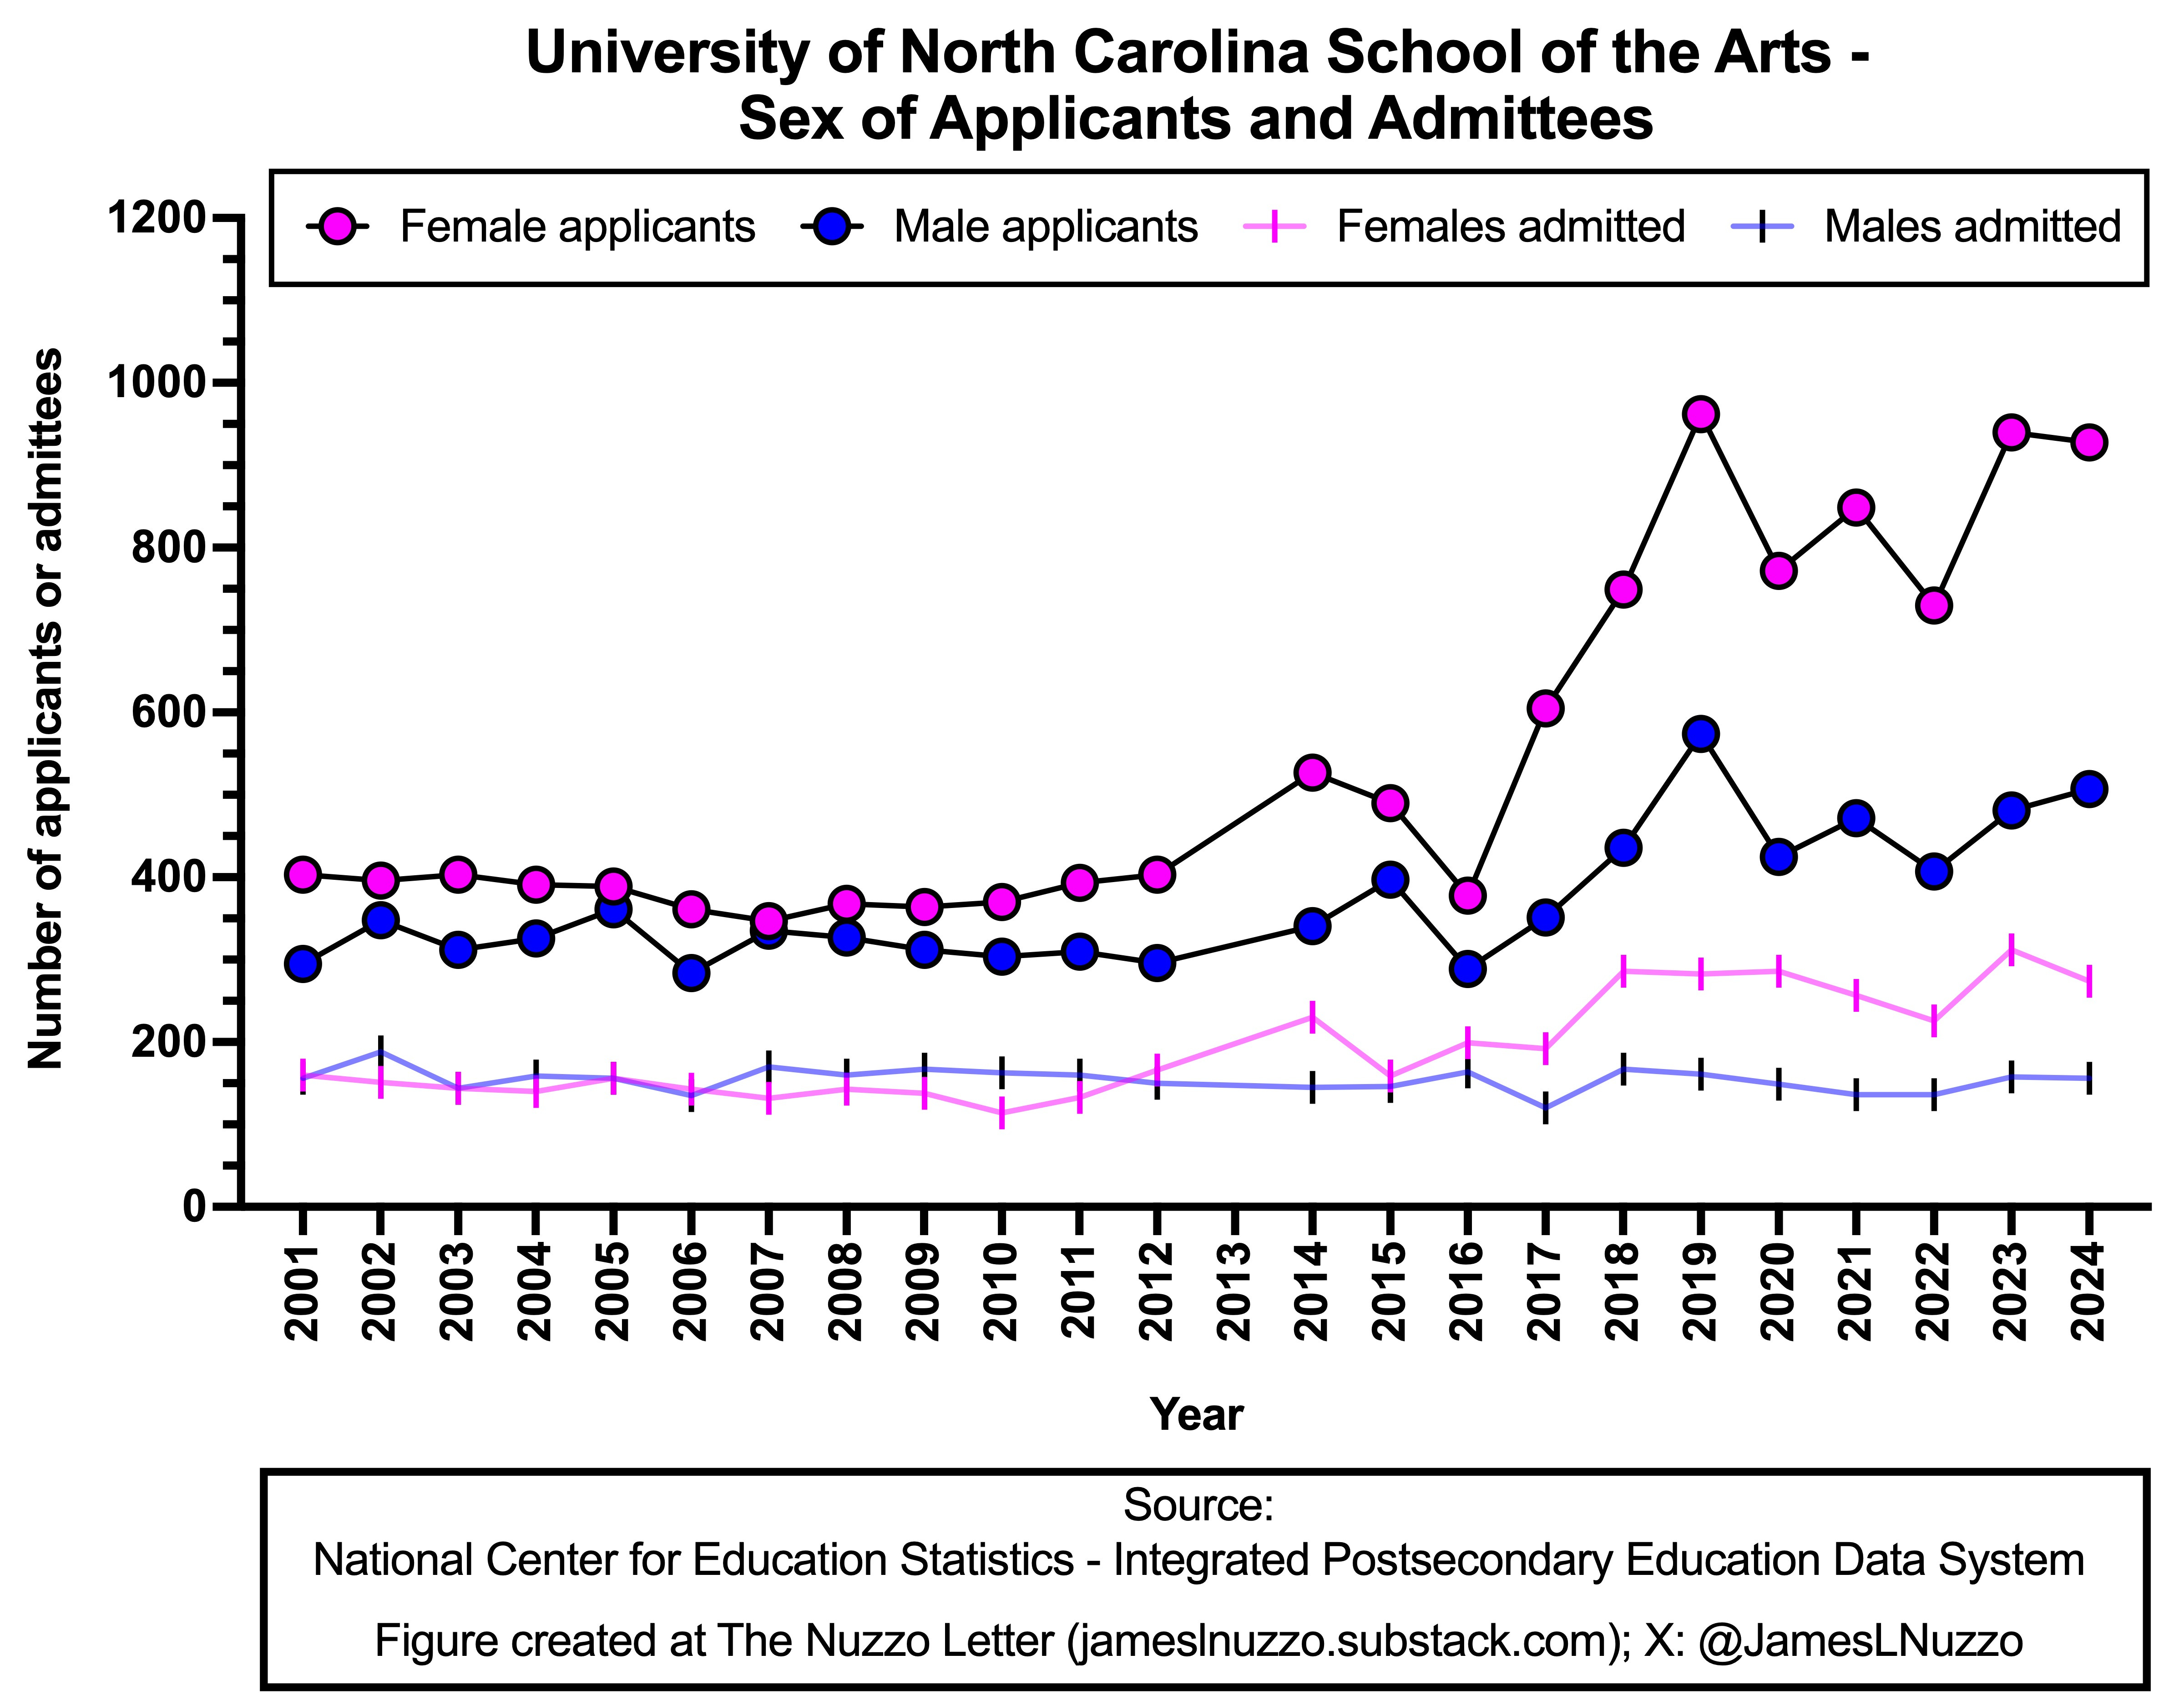
For each university, I present two graphs. The first graph shows the percent of males and females admitted (bars and left y-axis) and the resulting female:male admissions ratio (line and right y-axis). The horizontal dashed line on these graphs represents a female:male admissions ratio of 1.0 (i.e., no sex preference). The second graph shows the number of males and females who applied to the university each year and who were admitted to the university each year.
After presenting the graphs for each university, I then present graphs that compare (1) the female:male admissions ratio across all universities in the North Carolina system in 2024; (2) the female:male admissions ratio across all universities in the North Carolina system averaged between 2001 and 2024; (3) the number of applicants to universities in the North Carolina system in 2024; and (4) the admissions rates to universities in the North Carolina system in 2024.
Due to an issue in the IPEDS, data from 2013 are missing for most universities. The IPEDS offers a pulldown option for the year 2013, but inspection of the relevant documents reveals that the year 2012 (not 2013) is checked within those documents. This is also the case for many other years prior to 2013, where the year that is checked on the forms is one year earlier than the year on the pulldown list. From 2014 forward, the years on the pulldown list and the years checked in the forms are consistent with each other. I do not know the reasons for these inconsistencies in the reporting by the IPEDS.
Scroll to the end of this post to see my Bonus Commentary.
Each year between 2001 and 2024, Appalachian State University admitted a larger percentage of female than male applicants. Consequently, the female:male admissions ratio was greater than 1.0 each year.
Between 2001 and 2024, the average annual percentages of female and male applicants admitted to Appalachian State University were 73.3% and 66.6%, respectively. Admissions rates have increased markedly for both sexes since 2018.
Between 2001 and 2024, the average annual female:male admissions ratio at Appalachian State University was 1.10. In 2024, the ratio was 1.03.
The number of males and females who applied to Appalachian State University increased between 2001 and 2024, with a marked increase starting around 2018.
Each year between 2001 and 2024, more females than males applied to Appalachian State University.
In 2024, 14,274 females and 10,337 males applied to Appalachian State University (58.0% female applicants).
Between 2001 and 2024, the number of males and females who were admitted to Appalachian State University increased, with a notable increase beginning around 2018.
Each year between 2001 and 2024, more females than males were admitted to Appalachian State University.
In 2024, 13,033 females and 9,152 males were admitted to Appalachian State University (58.7% female admittees).
In all but one year between 2001 and 2024, East Carolina University admitted a larger percentage of female than male applicants. Consequently, the female:male admissions ratio was greater than 1.0 for most years.
Between 2001 and 2024, the average annual percentages of female and male applicants admitted to East Carolina University were 78.7% and 76.2%, respectively. Admissions rates have increased markedly in the past four years compared to previous years.
Between 2001 and 2024, the average annual female:male admissions ratio at East Carolina University was 1.03. In 2024, the ratio was 1.02.
The number of males and females who applied to East Carolina University increased between 2001 and 2024.
Each year between 2001 and 2024, more females than males applied to East Carolina University.
In 2024, 16,392 females and 9,736 males applied to East Carolina University (62.7% female applicants).
Between 2001 and 2024, the number of males and females who were admitted to East Carolina University increased, with notable increases occurring over the past 10 years.
Each year between 2001 and 2024, more females than males were admitted to East Carolina University.
In 2024, 14,729 females and 8,596 males were admitted to East Carolina University (63.1% female admittees).
Between 2001 and 2024, Elizabeth City State University admitted a larger percentage of female than male applicants each year. Consequently, the female:male admissions ratio was greater than 1.0 each year.
Between 2001 and 2024, the average annual percentages of female and male applicants admitted to Elizabeth City State University were 71.3% and 64.9%, respectively.
Between 2001 and 2024, the average annual female:male admissions ratio at Elizabeth City State University was 1.10. In 2024, the ratio was 1.07.
The numbers of males and females who applied to Elizabeth City State University increased between 2001 and 2012, declined for a couple of years, and then increased in most years thereafter.
Each year between 2001 and 2024, more females than males applied to Elizabeth City State University.
In 2024, 3,368 females and 2,118 males applied to Elizabeth City State University (61.3% female applicants).
The number of males and females who were admitted to Elizabeth City State University increased between 2001 and 2012, declined for a couple of years, and then increased in most years thereafter.
Each year between 2001 and 2024, more females than males were admitted to Elizabeth City State University.
In 2024, 2,220 females and 1,304 males were admitted to Elizabeth City State University (63.0% female admittees).
Between 2001 and 2024, Fayetteville State University admitted a larger percentage of female than male applicants each year. Consequently, the female:male admissions ratio was greater than 1.0 each year.
Between 2001 and 2024, the average annual percentages of female and male applicants admitted to Fayetteville State University were 74.6% and 68.5%, respectively.
Between 2001 and 2024, the average annual female:male admissions ratio at Fayetteville State University was 1.09. In 2024, the ratio was 1.09.
The numbers of males and females who applied to Fayetteville State University increased between 2001 and 2024.
Each year between 2001 and 2024, more females than males applied to Fayetteville State University.
In 2024, 4,373 females and 2,139 males applied to Fayetteville State University (67.2% female applicants).
The number of males and females who were admitted to Fayetteville State University remained mostly between 2001 and 2015 and then increased noticeably in the years thereafter, particularly in 2023 and 2024.
In 2024, 3,695 females and 1,654 males were admitted to Fayetteville State University (69.1% female admittees).
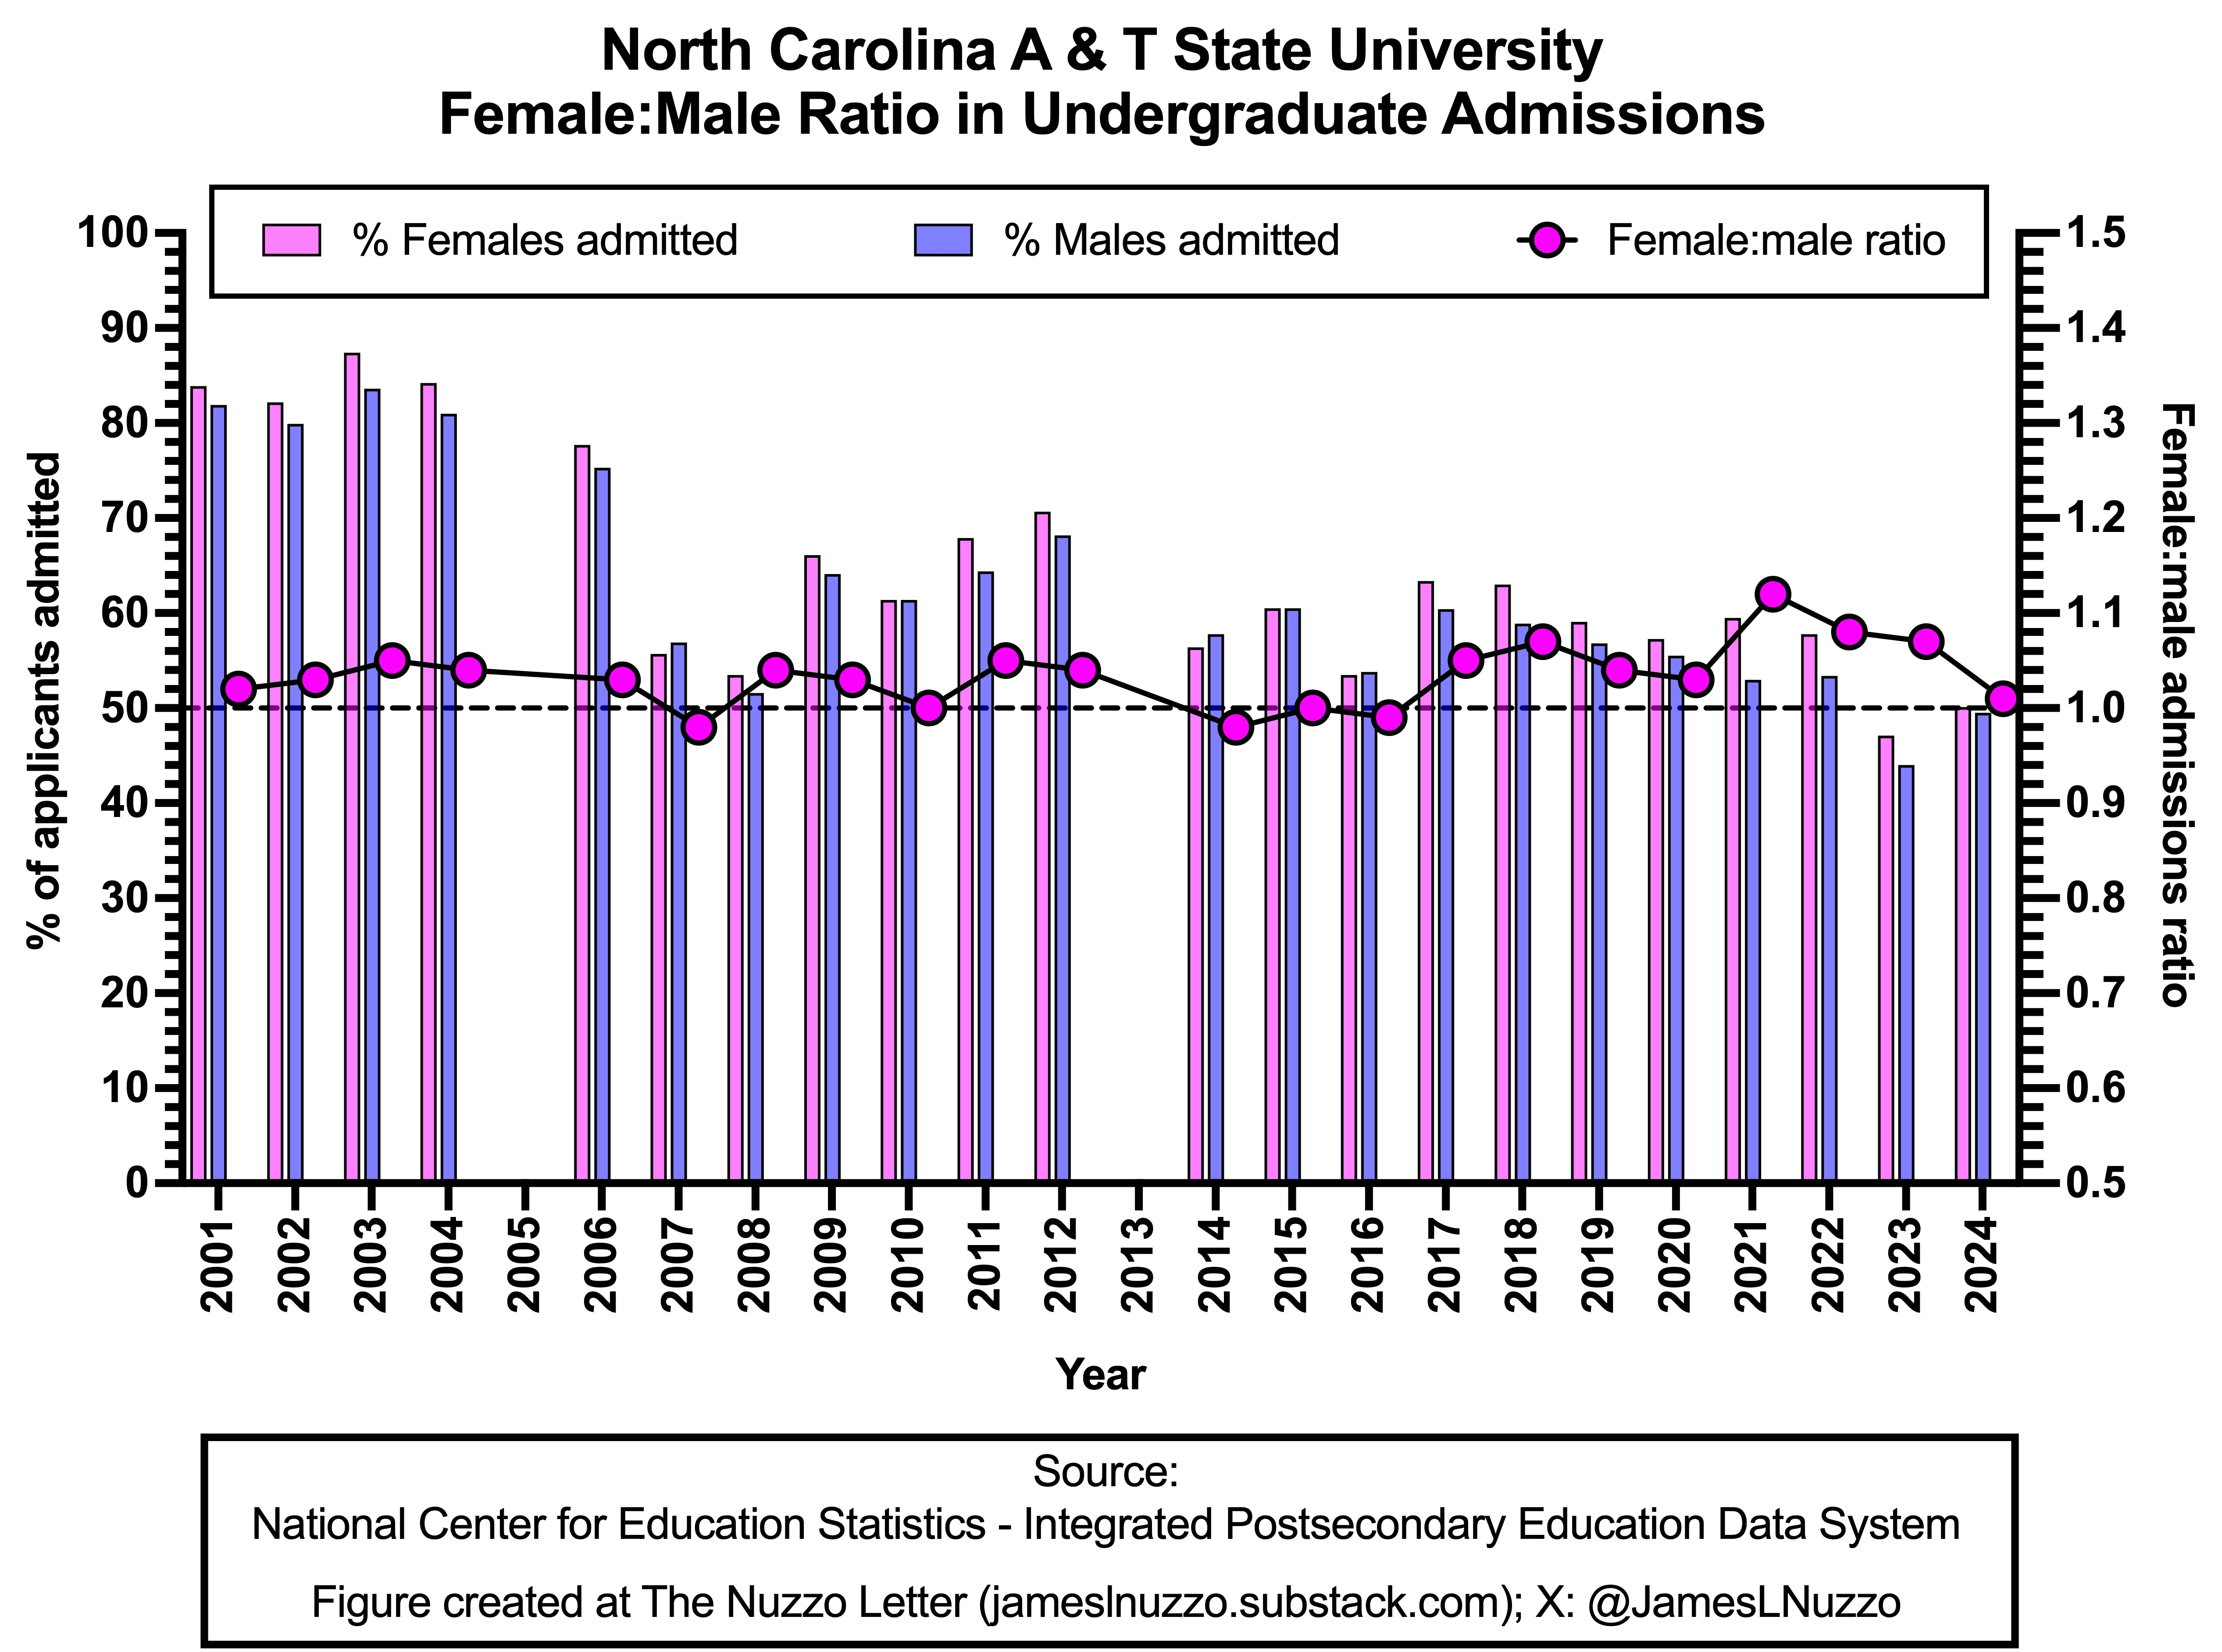
Each year between 2001 and 2024, North Carolina A & T University admitted nearly identical percentages of female and male applicants. Consequently, the female:male admissions ratio has been approximately 1.0 for most years since 2001.
Between 2001 and 2024, the average annual percentages of female and male applicants admitted to North Carolina A & T University were 6.6% and 6.7%, respectively. Admissions rates have increased markedly in the past four years compared to previous years.
Between 2001 and 2024, the average annual female:male admissions ratio at North Carolina A & T University was 1.03. In 2024, the ratio was 1.01.
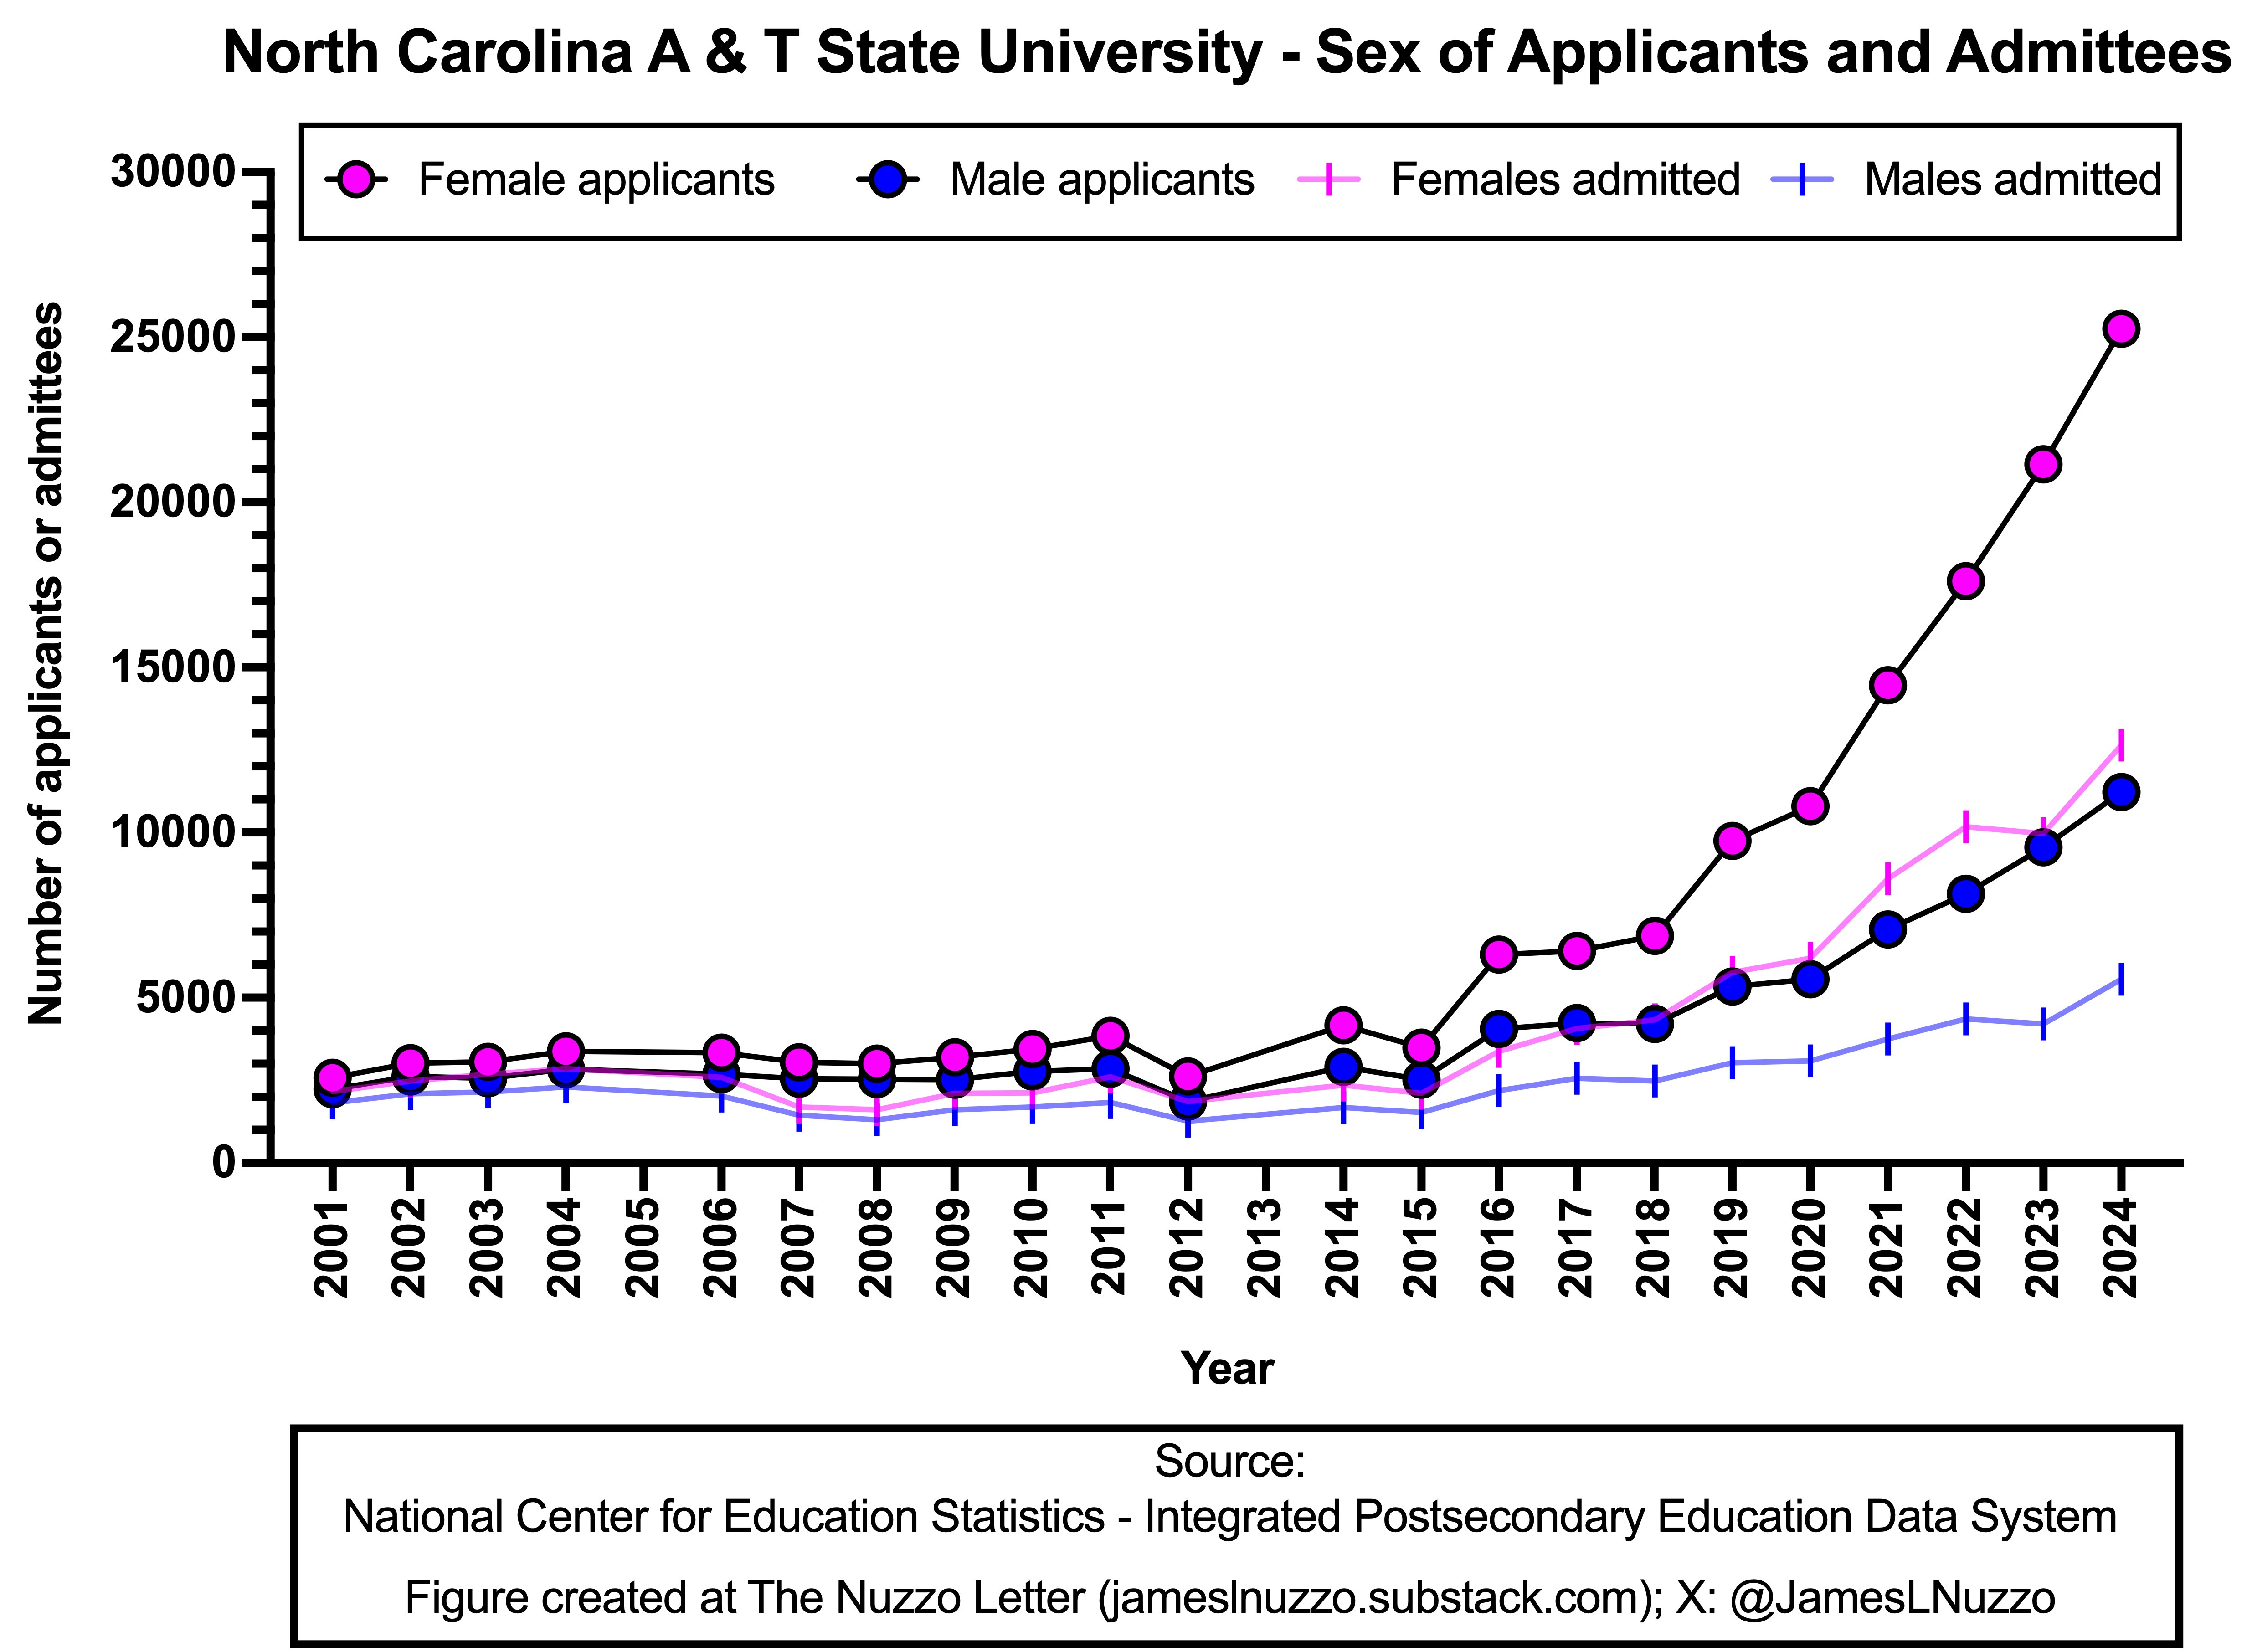
The number of males and females who applied to North Carolina A & T University remained roughly constant between 2001 and 2015 and then increased markedly in subsequent years, particularly between 2021 and 2024.
Each year between 2001 and 2024, more females than males applied to North Carolina A & T University.
In 2024, 25,254 females and 11,234 males applied to North Carolina A & T University (69.2% female applicants).
The number of males and females who were admitted to North Carolina A & T University remained roughly constant between 2001 and 2018 and then increased noticeably in the years thereafter, particularly among females between 2021 and 2024.
Each year between 2001 and 2024, more females than males were admitted to North Carolina A & T University.
In 2024, 12,645 females and 5,563 males were admitted to North Carolina A & T University (69.4% female admittees).
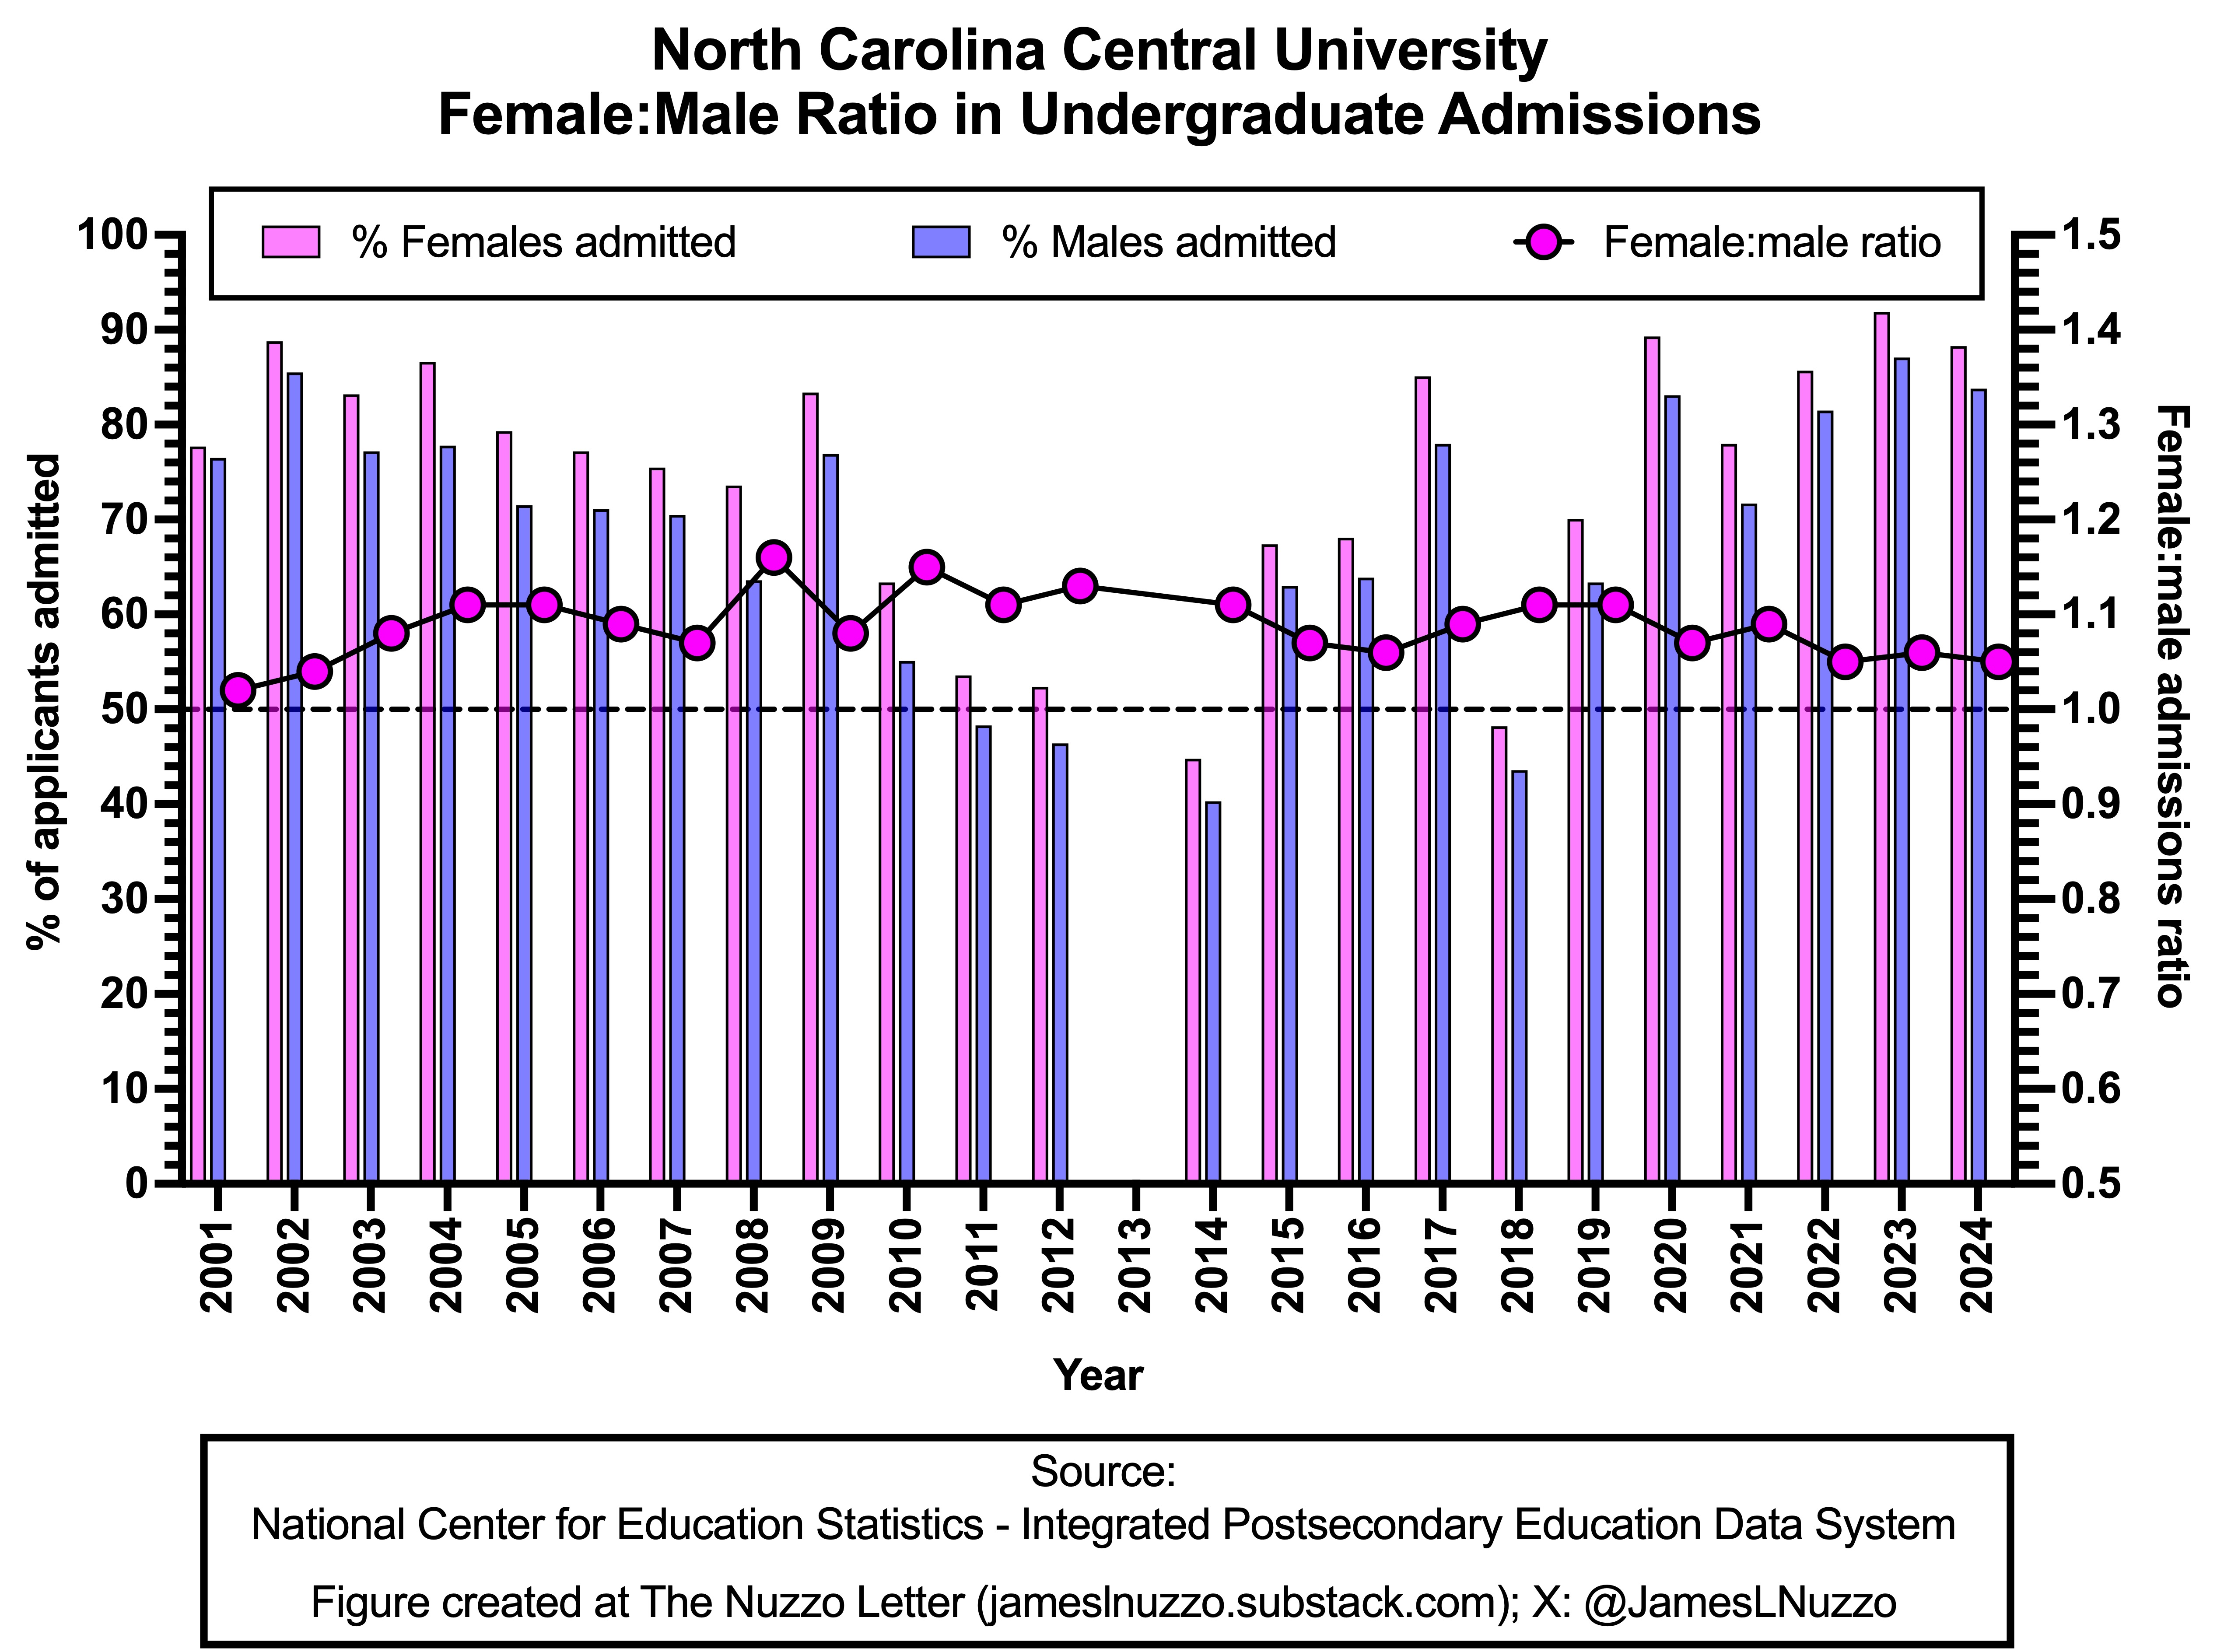
Between 2001 and 2024, North Carolina Central University admitted a larger percentage of female than male applicants each year. Consequently, the female:male admissions ratio was greater than 1.0 each year.
Between 2001 and 2024, the average annual percentages of female and male applicants admitted to North Carolina Central University were 74.4% and 68.7%, respectively.
Between 2001 and 2024, the average annual female:male admissions ratio at North Carolina Central University was 1.09. In 2024, the ratio was1.05.
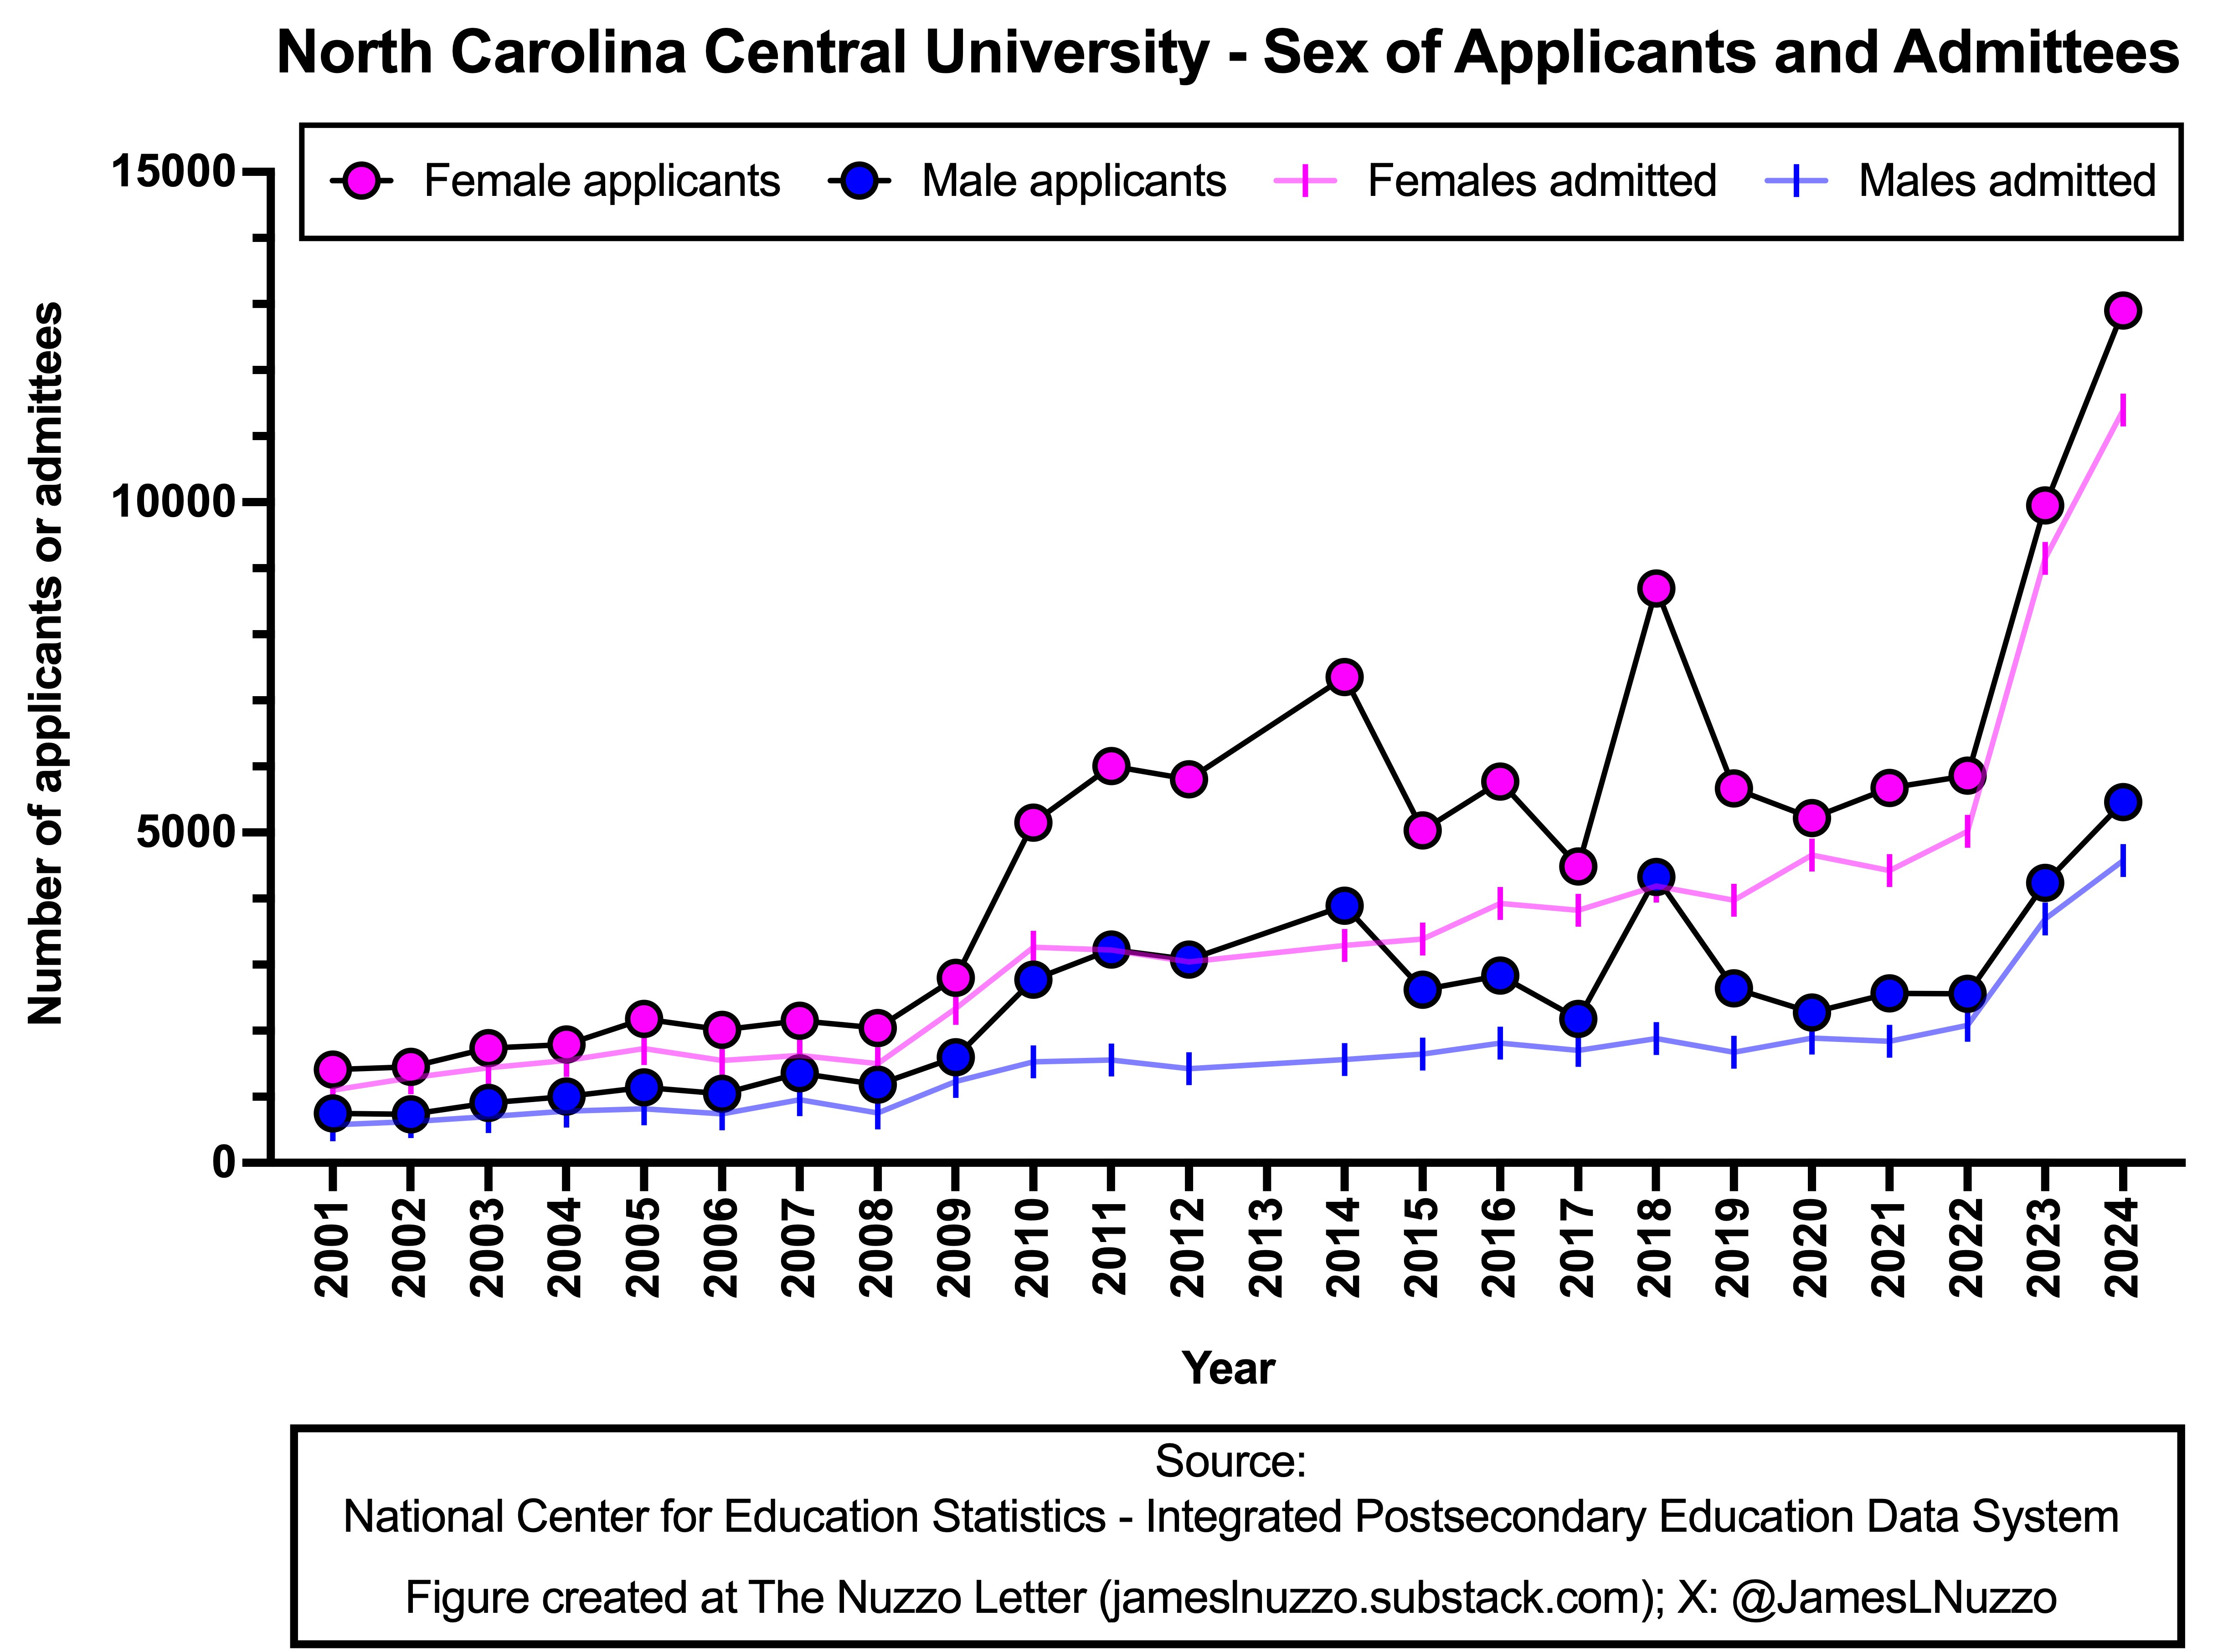
The number of males and females who applied to North Carolina Central University generally increased over time with sharp increases seen in 2010, 2018, 2023, and 2024.
Each year between 2001 and 2024, more females than males applied to North Carolina Central University.
In 2024, 12,903 females and 5,460 males applied to North Carolina Central University (70.3% female applicants).
The number of males and females who were admitted to North Carolina Central University was roughly constant between 2001 and 2008, increased in 2009, remained constant again until 2022, and then increased markedly in 2023 and 2024.
Each year between 2001 and 2024, more females than males were admitted to North Carolina Central University.
In 2024, 11,395 females and 4,576 males were admitted to North Carolina Central University (71.3% female applicants).
Between 2001 and 2024, North Carolina State University admitted a larger percentage of female than male applicants each year. Consequently, the female:male admissions ratio was greater than 1.0 each year.
Between 2001 and 2024, the average annual percentages of female and male applicants admitted to North Carolina State University were 50.3% and 56.0%, respectively.
Between 2001 and 2024, the average annual female:male admissions ratio at North Carolina State University was 1.12. In 2024, the ratio was 1.22.
The number of males and females who applied to North Carolina State University increased gradually over time with a notable exponential increase in 2016 and then accelerated increases between 2022 and 2024.
Each year between 2001 and 2018, more males than females applied to North Carolina State University. Each year between 2019 and 2024, more females than males to North Carolina State University
In 2024, 22,777 females and 21,260 males applied to North Carolina State University (51.7% female applicants).
The number of males and females who were admitted to North Carolina State University was roughly similar and constant between 2001 and 2015. However, the number admittees then increased noticeably in 2016 and increased further in most years thereafter.
For most years between 2001 and 2015, slightly more males than females were admitted to North Carolina State University. Between 2016 and 2024, more females than males were admitted to North Carolina State University, and the gap between the number of females and males admitted increased between 2017 and 2024.
In 2024, 10,401 females and 7,980 males were admitted to North Carolina State University (56.6% female applicants).
Between 2001 and 2024, the University of North Carolina at Asheville admitted a larger percentage of male than female applicants each year. Consequently, the female:male admissions ratio was less than 1.0 each year.
Between 2001 and 2024, the average annual percentages of female and male applicants admitted to the University of North Carolina at Asheville were 79.6% and 72.4%, respectively. Admissions rates increased markedly in 2023 and 2024.
Between 2001 and 2024, the average annual female:male admissions ratio at the University of North Carolina at Asheville was 1.11. In 2024, the ratio was 1.02.
The number of males and females who applied to the University of North Carolina at Asheville increased markedly in 2021 and then again in 2023 and 2024.
Each year between 2001 and 2024, more females than males applied to the University of North Carolina at Asheville.
In 2024, 4,664 females and 2,713 males applied to the University of North Carolina at Asheville (63.2% female applicants).
The number of males and females who were admitted to the University of North Carolina at Asheville increased most noticeably starting around 2015, with exponential increases occurring in 2023 and 2024
Each year between 2001 and 2024, more females than males were admitted to the University of North Carolina at Asheville.
In 2024, 4,295 females and 2,486 males were admitted to the University of North Carolina at Asheville (63.3% female applicants).
Between 2001 and 2024, the University of North Carolina at Chapel Hill admitted a larger percentage of male than female applicants in some years and a larger percentage of females than males in other years. Consequently, the female:male admissions ratio was less than 1.0 in some years and greater than 1.0 in other years.
Between 2001 and 2024, the average annual percentages of female and male applicants admitted to the University of North Carolina at Chapel Hill were 29.0% and 28.9%, respectively. Admissions rates decreased for both males and females tended to decrease each year after 2015.
Between 2001 and 2024, the average annual female:male admissions ratio at the University of North Carolina at Chapel Hill was 1.01. In 2024, the ratio was 1.01.
The number of males and females who applied to the University of North Carolina at Chapel Hill increased over time, particularly between 2016 and 2018 and then more sharply between 2021 and 2024.
Each year between 2001 and 2024, more females than males applied to the University of North Carolina at Chapel Hill.
In 2024, 5,953 females and 4,256 males applied to the University of North Carolina at Chapel Hill (58.3% female applicants).
The number of males and females who were admitted to the University of North Carolina at Chapel Hill increased by about 2,000 for each sex between 2001 to 2024 (2,584 to 4,256 for males; 3,755 to 5,953 for females).
Each year between 2001 and 2024, more females than males were admitted to the University of North Carolina at Chapel Hill
In 2024, 4,295 females and 2,486 males were admitted to the University of North Carolina at Chapel Hill (63.3% female applicants).
Between 2001 and 2024, the University of North Carolina at Charlotte tended to admit a larger percentage of male than female applicants each year, though, in more recent years, the University of North Carolina at Charlotte has admitted a larger percentage of female than male applicants. Consequently, the female:male admissions ratio has been elevated above 1.0 in recent years, but it was historically slightly below 1.0 in most years.
Between 2001 and 2024, the average annual percentages of female and male applicants admitted to the University of North Carolina at Charlotte were 72.0% and 72.6%, respectively. Admissions rates increased noticeably in 2020 compared the six years prior.
Between 2001 and 2024, the average annual female:male admissions ratio was 0.99. In 2024, the ratio was 1.03.
The number of males and females who applied to the University of North Carolina at Charlotte increased steadily between 2001 and 2024.
Each year between 2001 and 2024, more females than males applied to the University of North Carolina at Charlotte.
In 2024, 13,465 females and 10,408 males applied to the University of North Carolina at Charlotte (56.4% female applicants).
The number of males and females who were admitted to the University of North Carolina at Charlotte increased gradually between 2001 and 2018 and then increased exponentially in 2019 and then continued to increase in the years thereafter, particularly for females.
Each year between 2001 and 2024, more females than males were admitted to the University of North Carolina at Charlotte.
In 2024, 10,875 females and 8,130 males were admitted to the University of North Carolina at Charlotte (57.2% female applicants).
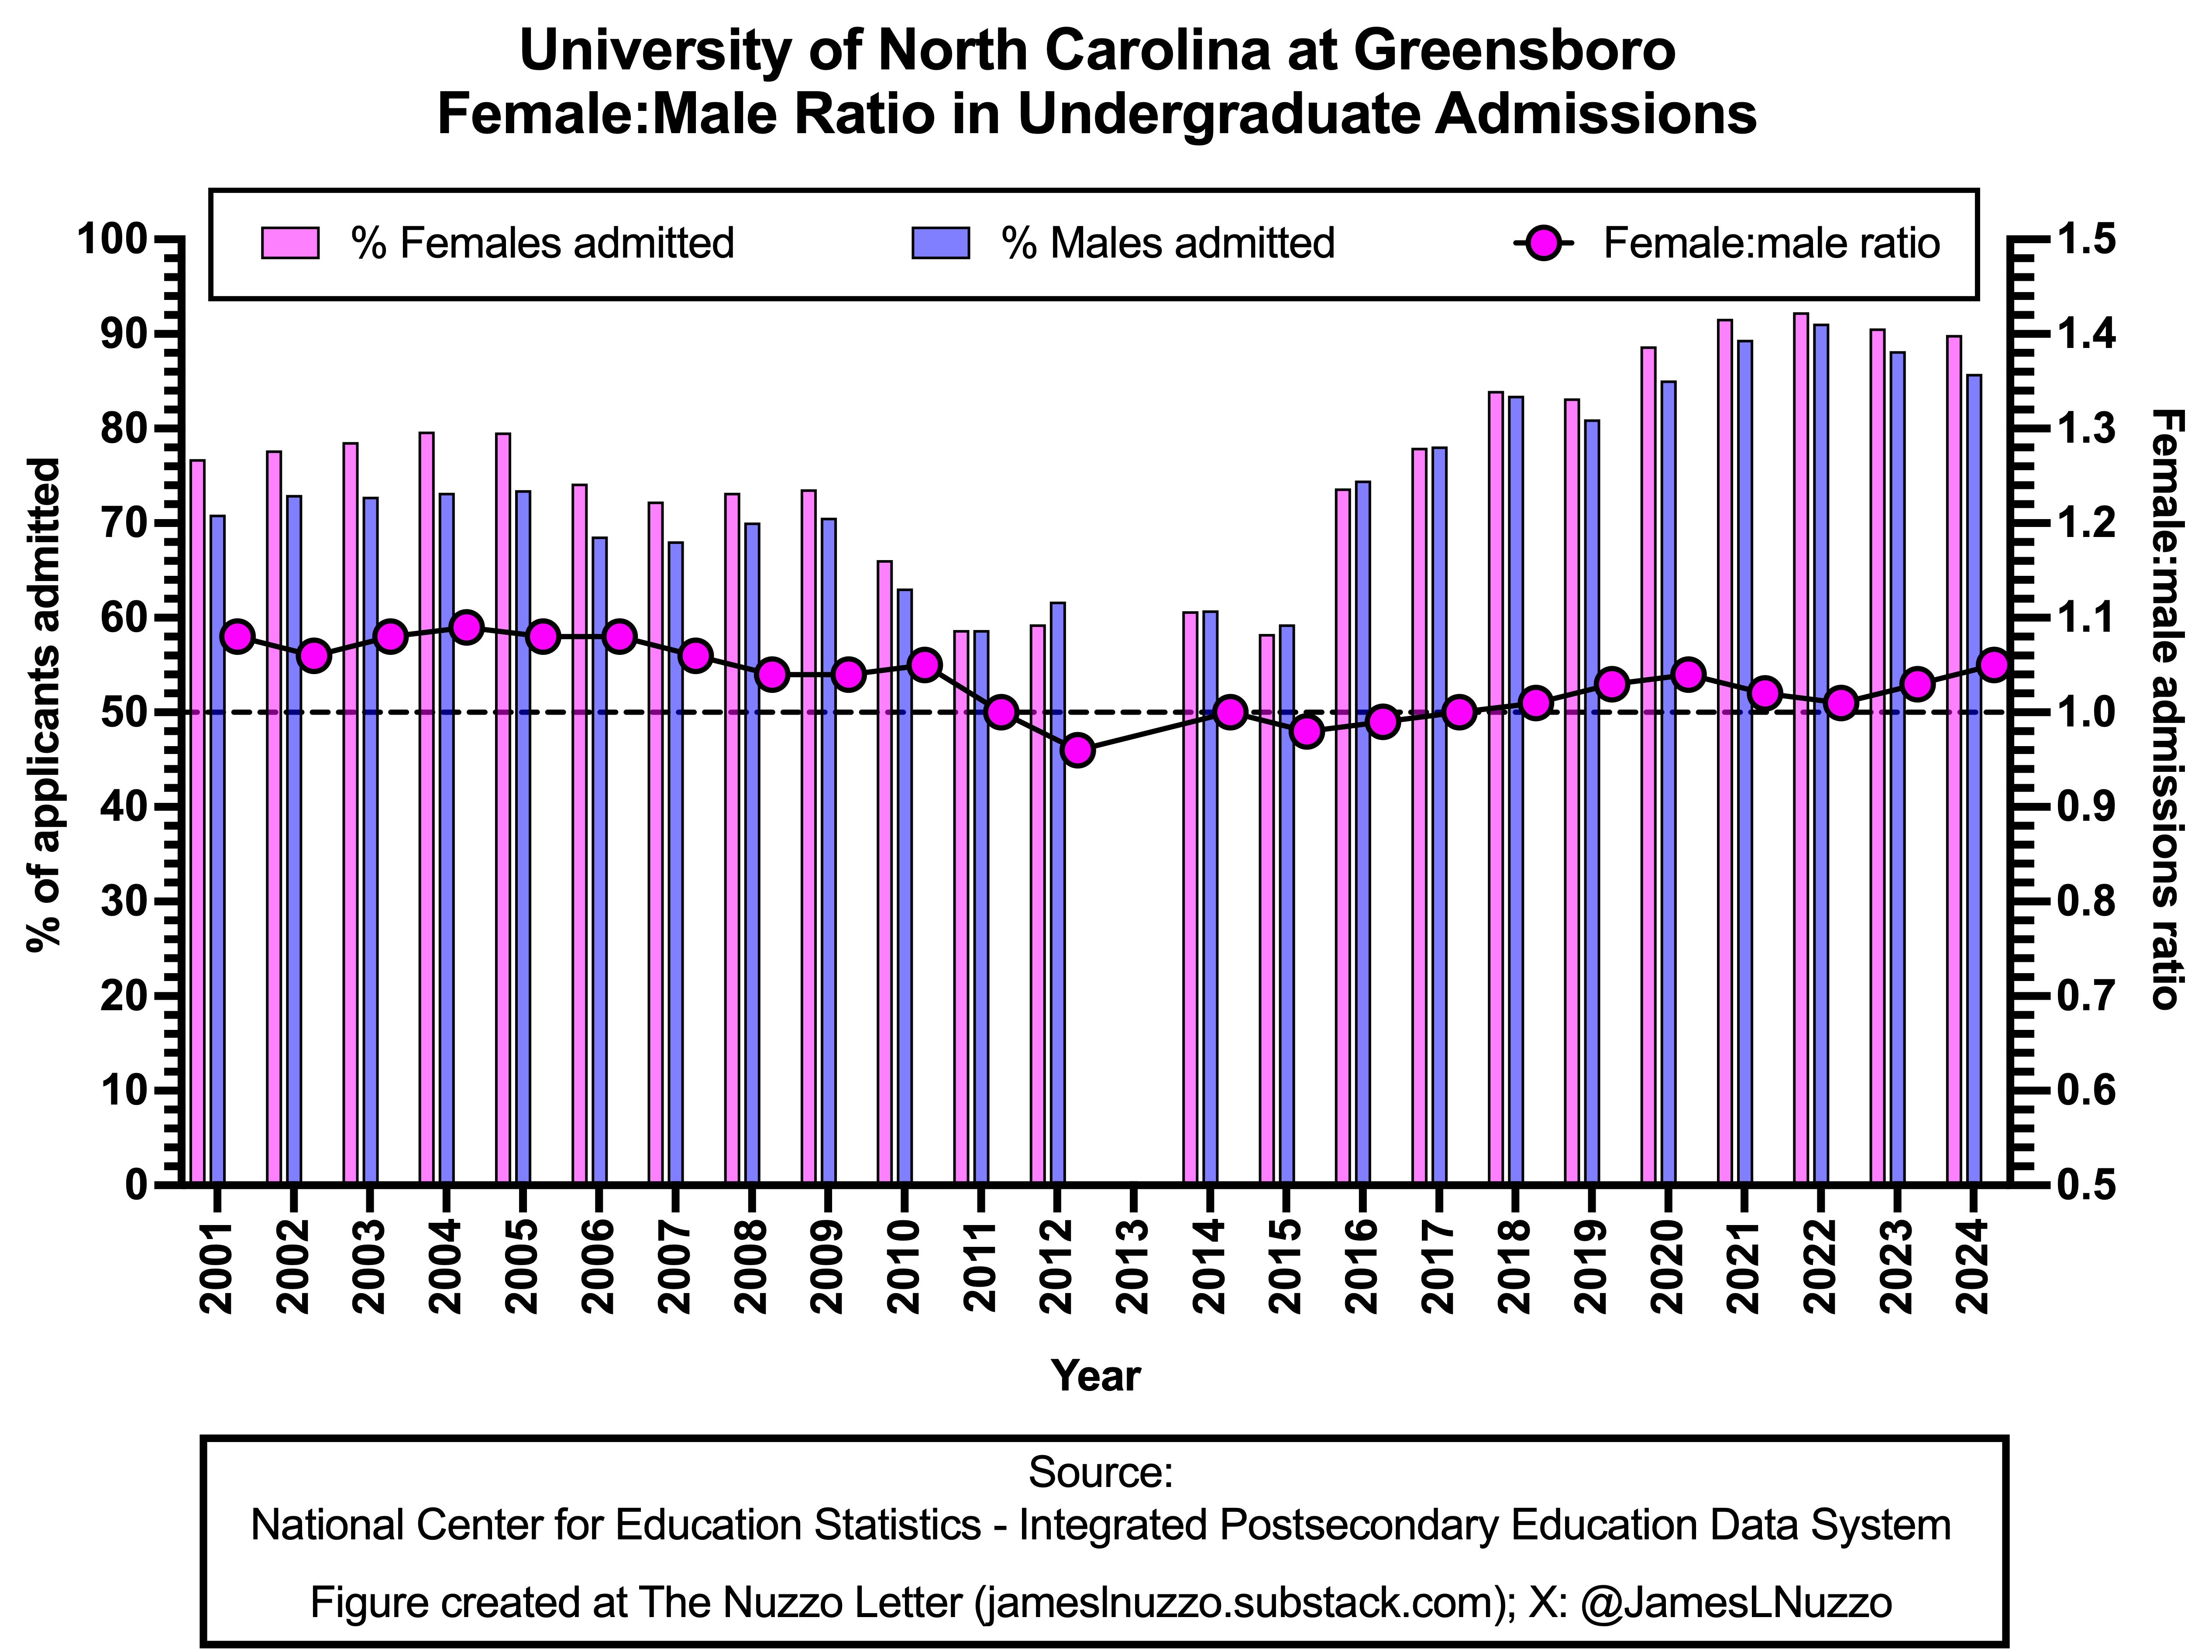
Between 2001 and 2024, the University of North Carolina at Greensboro admitted a larger percentage of female than male applicants in most years. Consequently, the female:male admissions ratio was more than 1.0 for most years.
Between 2001 and 2024, the average annual percentages of female and male applicants admitted to the University of North Carolina at Greensboro were 76.6% and 74.0%, respectively. Admissions rates decreased in 2010 for a few years and then increased markedly starting in 2016.
Between 2001 and 2024, the average annual female:male admissions ratio at the University of North Carolina at Greensboro was 1.03. In 2024, the ratio was 1.05.
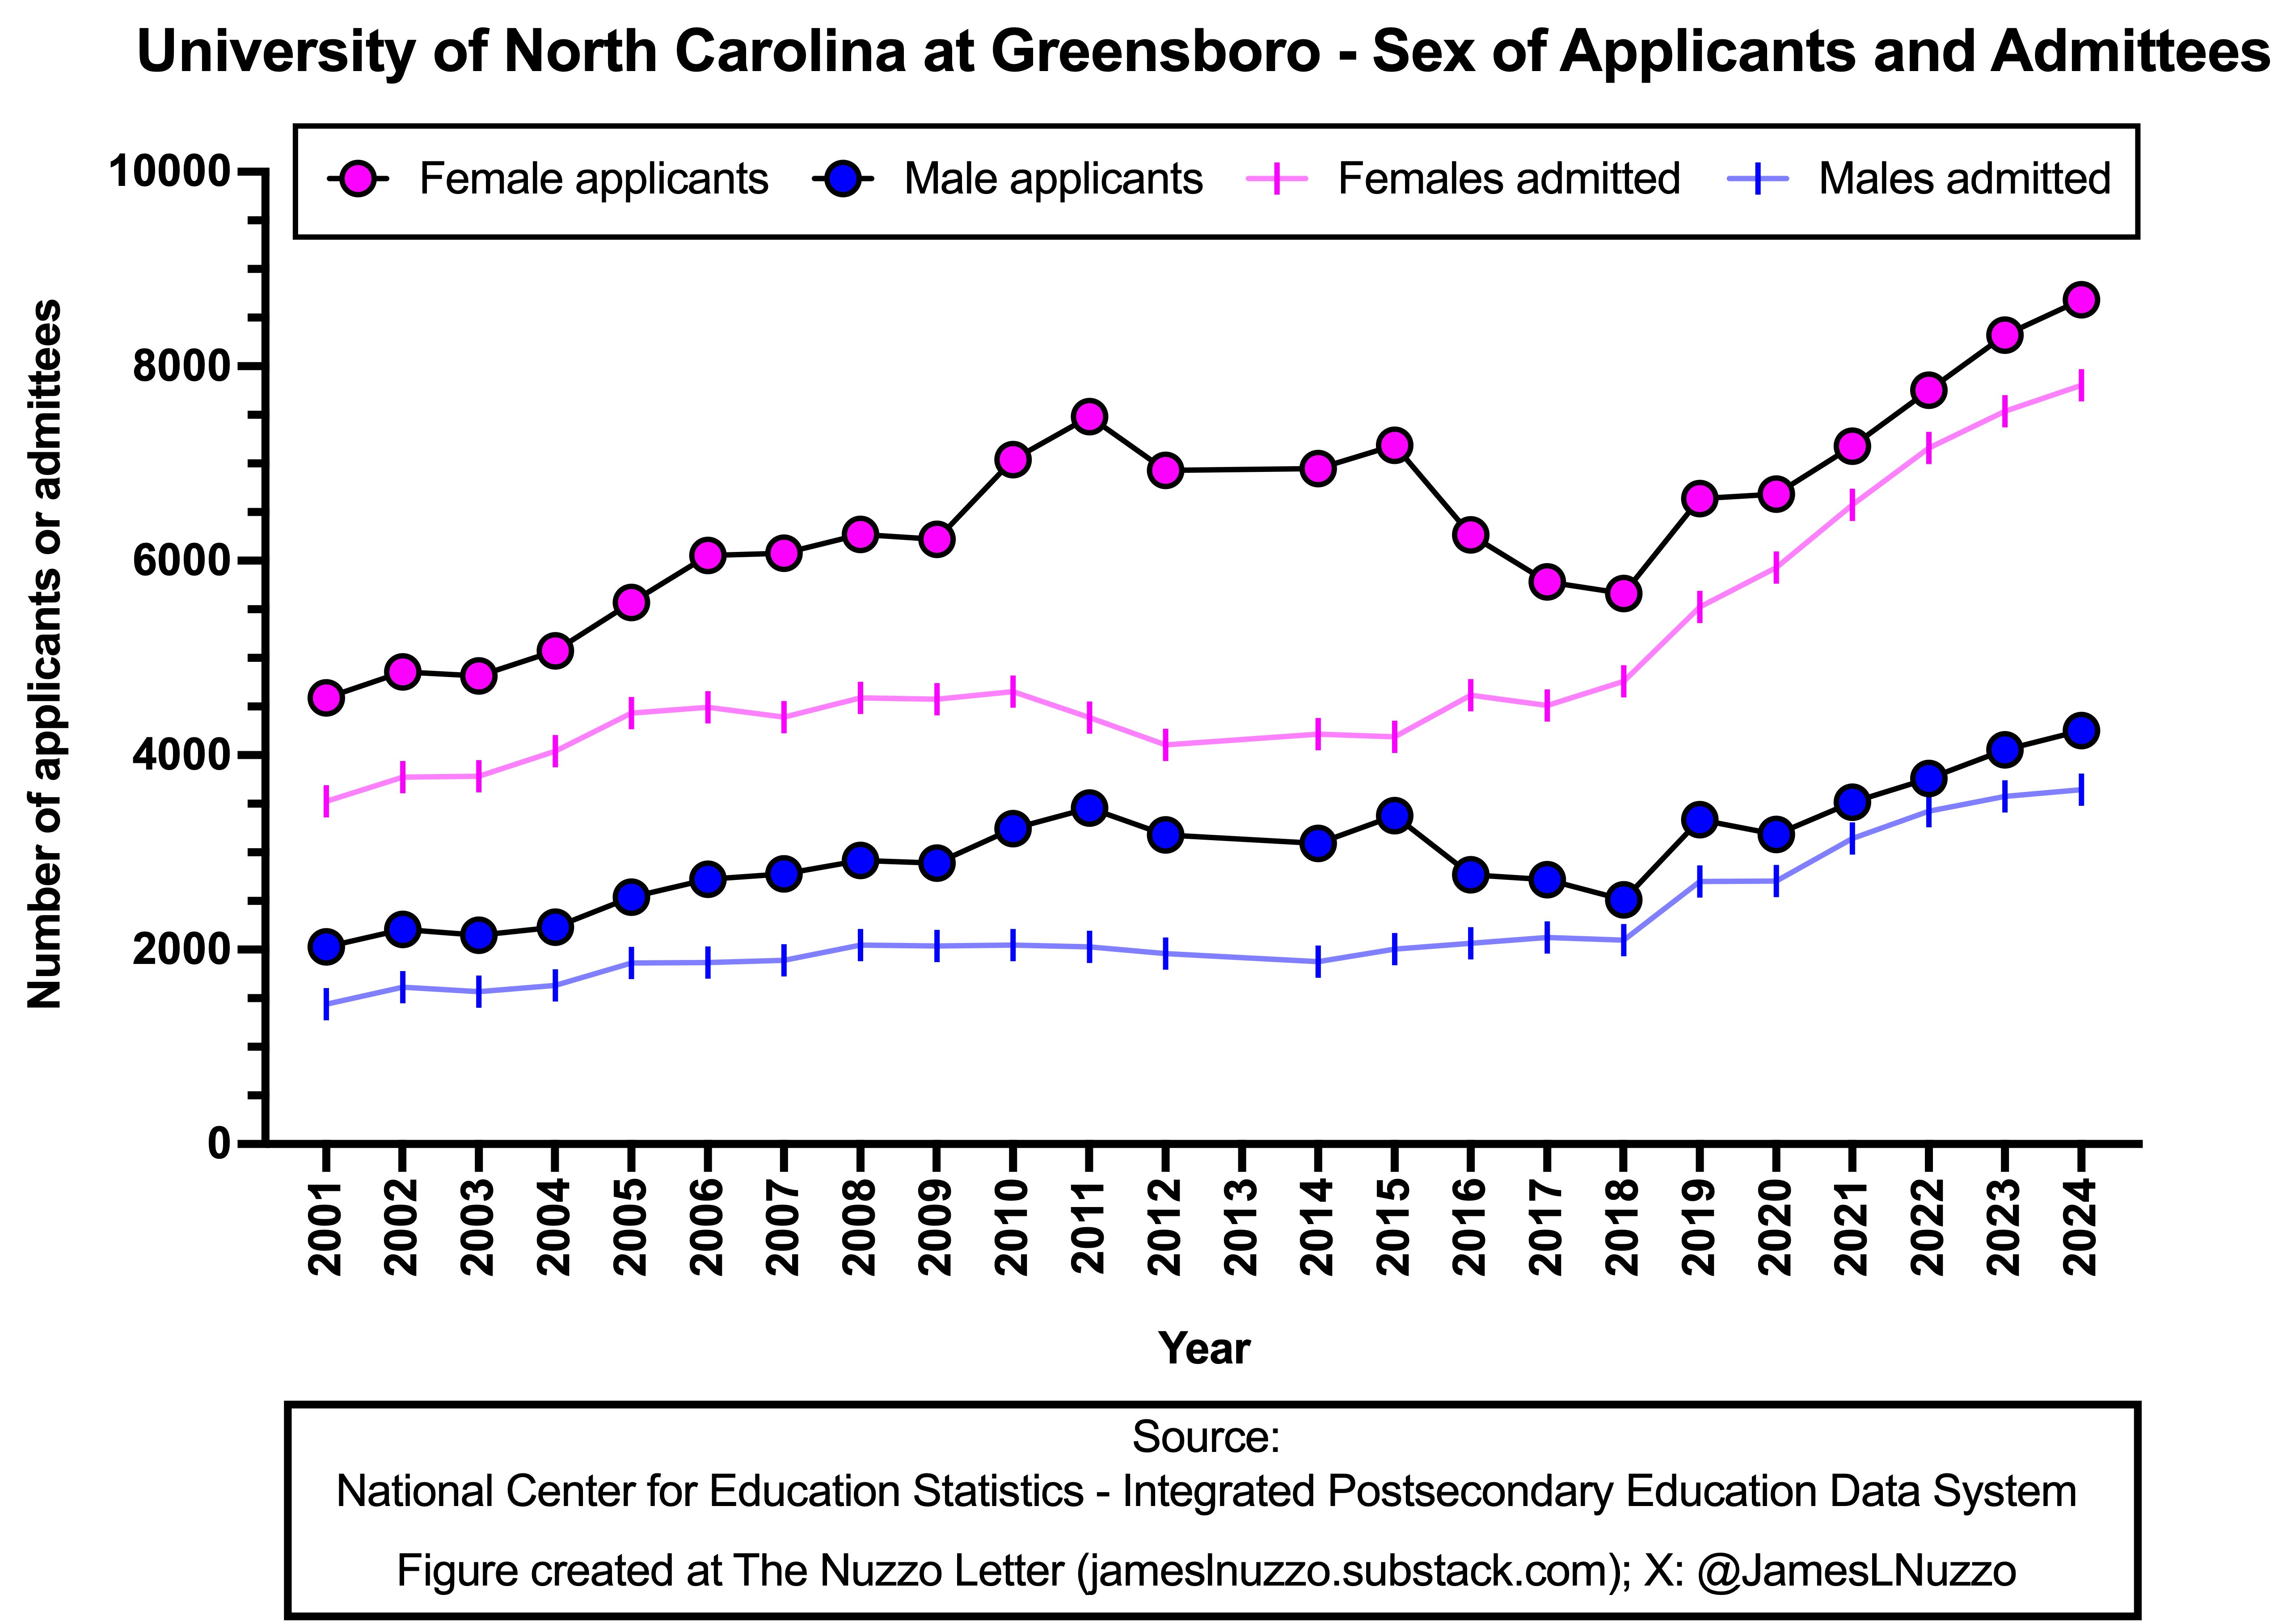
The number of males and females who applied to the University of North Carolina at Greensboro increased between 2001 and 2011, plateaued between 2011 and 2015, decreased between 2015 and 2018, and then increased between 2019 and 2024.
Each year between 2001 and 2024, more females than males applied to the University of North Carolina at Greensboro.
In 2024, 8,684 females and 4,254 males applied to the University of North Carolina at Greensboro (67.1% female applicants).
The number of males and females who were admitted to the University of North Carolina at Greensboro increased between 2001 and 2005, remained constant until 2018, and then increased noticeably each year thereafter.
Each year between 2001 and 2024, more females than males were admitted to the University of North Carolina at Greensboro.
In 2024, 7,804 females and 3,648 males were admitted to the University of North Carolina at Greensboro (68.1% female applicants).
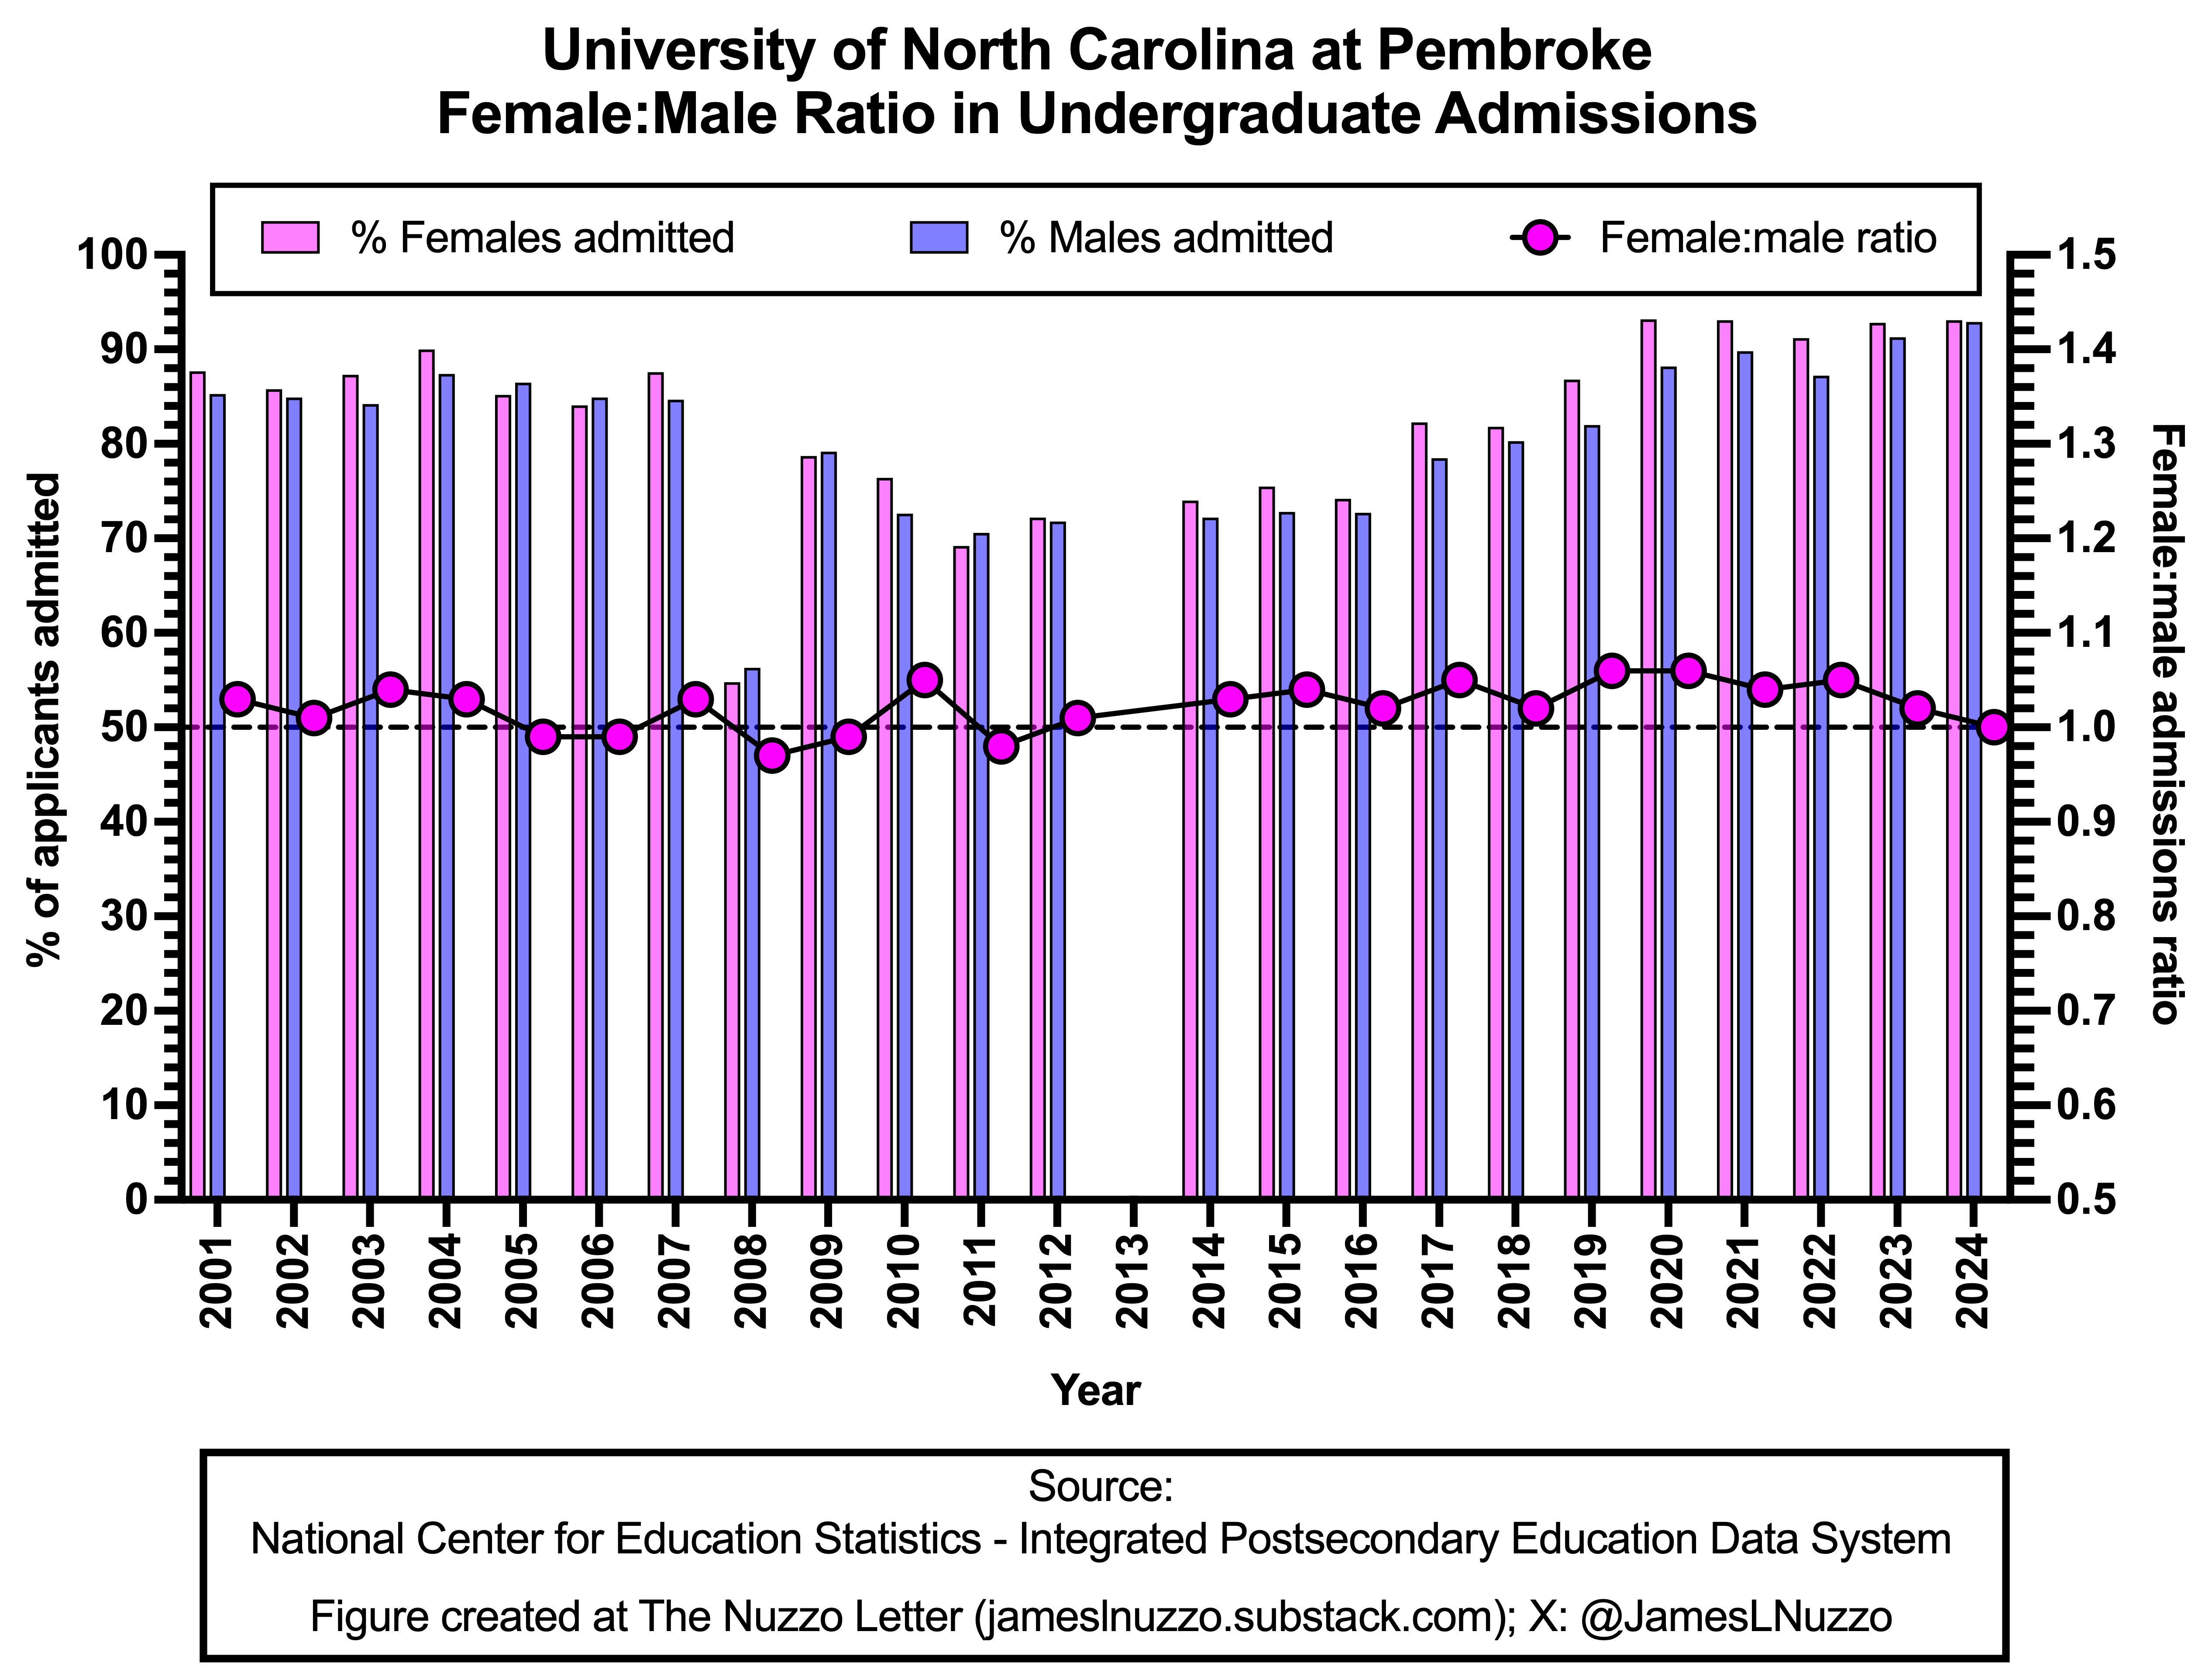
Between 2001 and 2024, the University of North Carolina at Pembroke admitted a larger percentage of female than male applicants most years. Consequently, the female:male admissions ratio was more than 1.0 for most years.
Between 2001 and 2024, the average annual percentages of female and male applicants admitted to the University of North Carolina at Pembroke were 82.5% and 80.7%, respectively.
Between 2001 and 2024, the average annual female:male admissions ratio at the University of North Carolina at Pembroke was 1.02. In 2024, the ratio was 1.00.
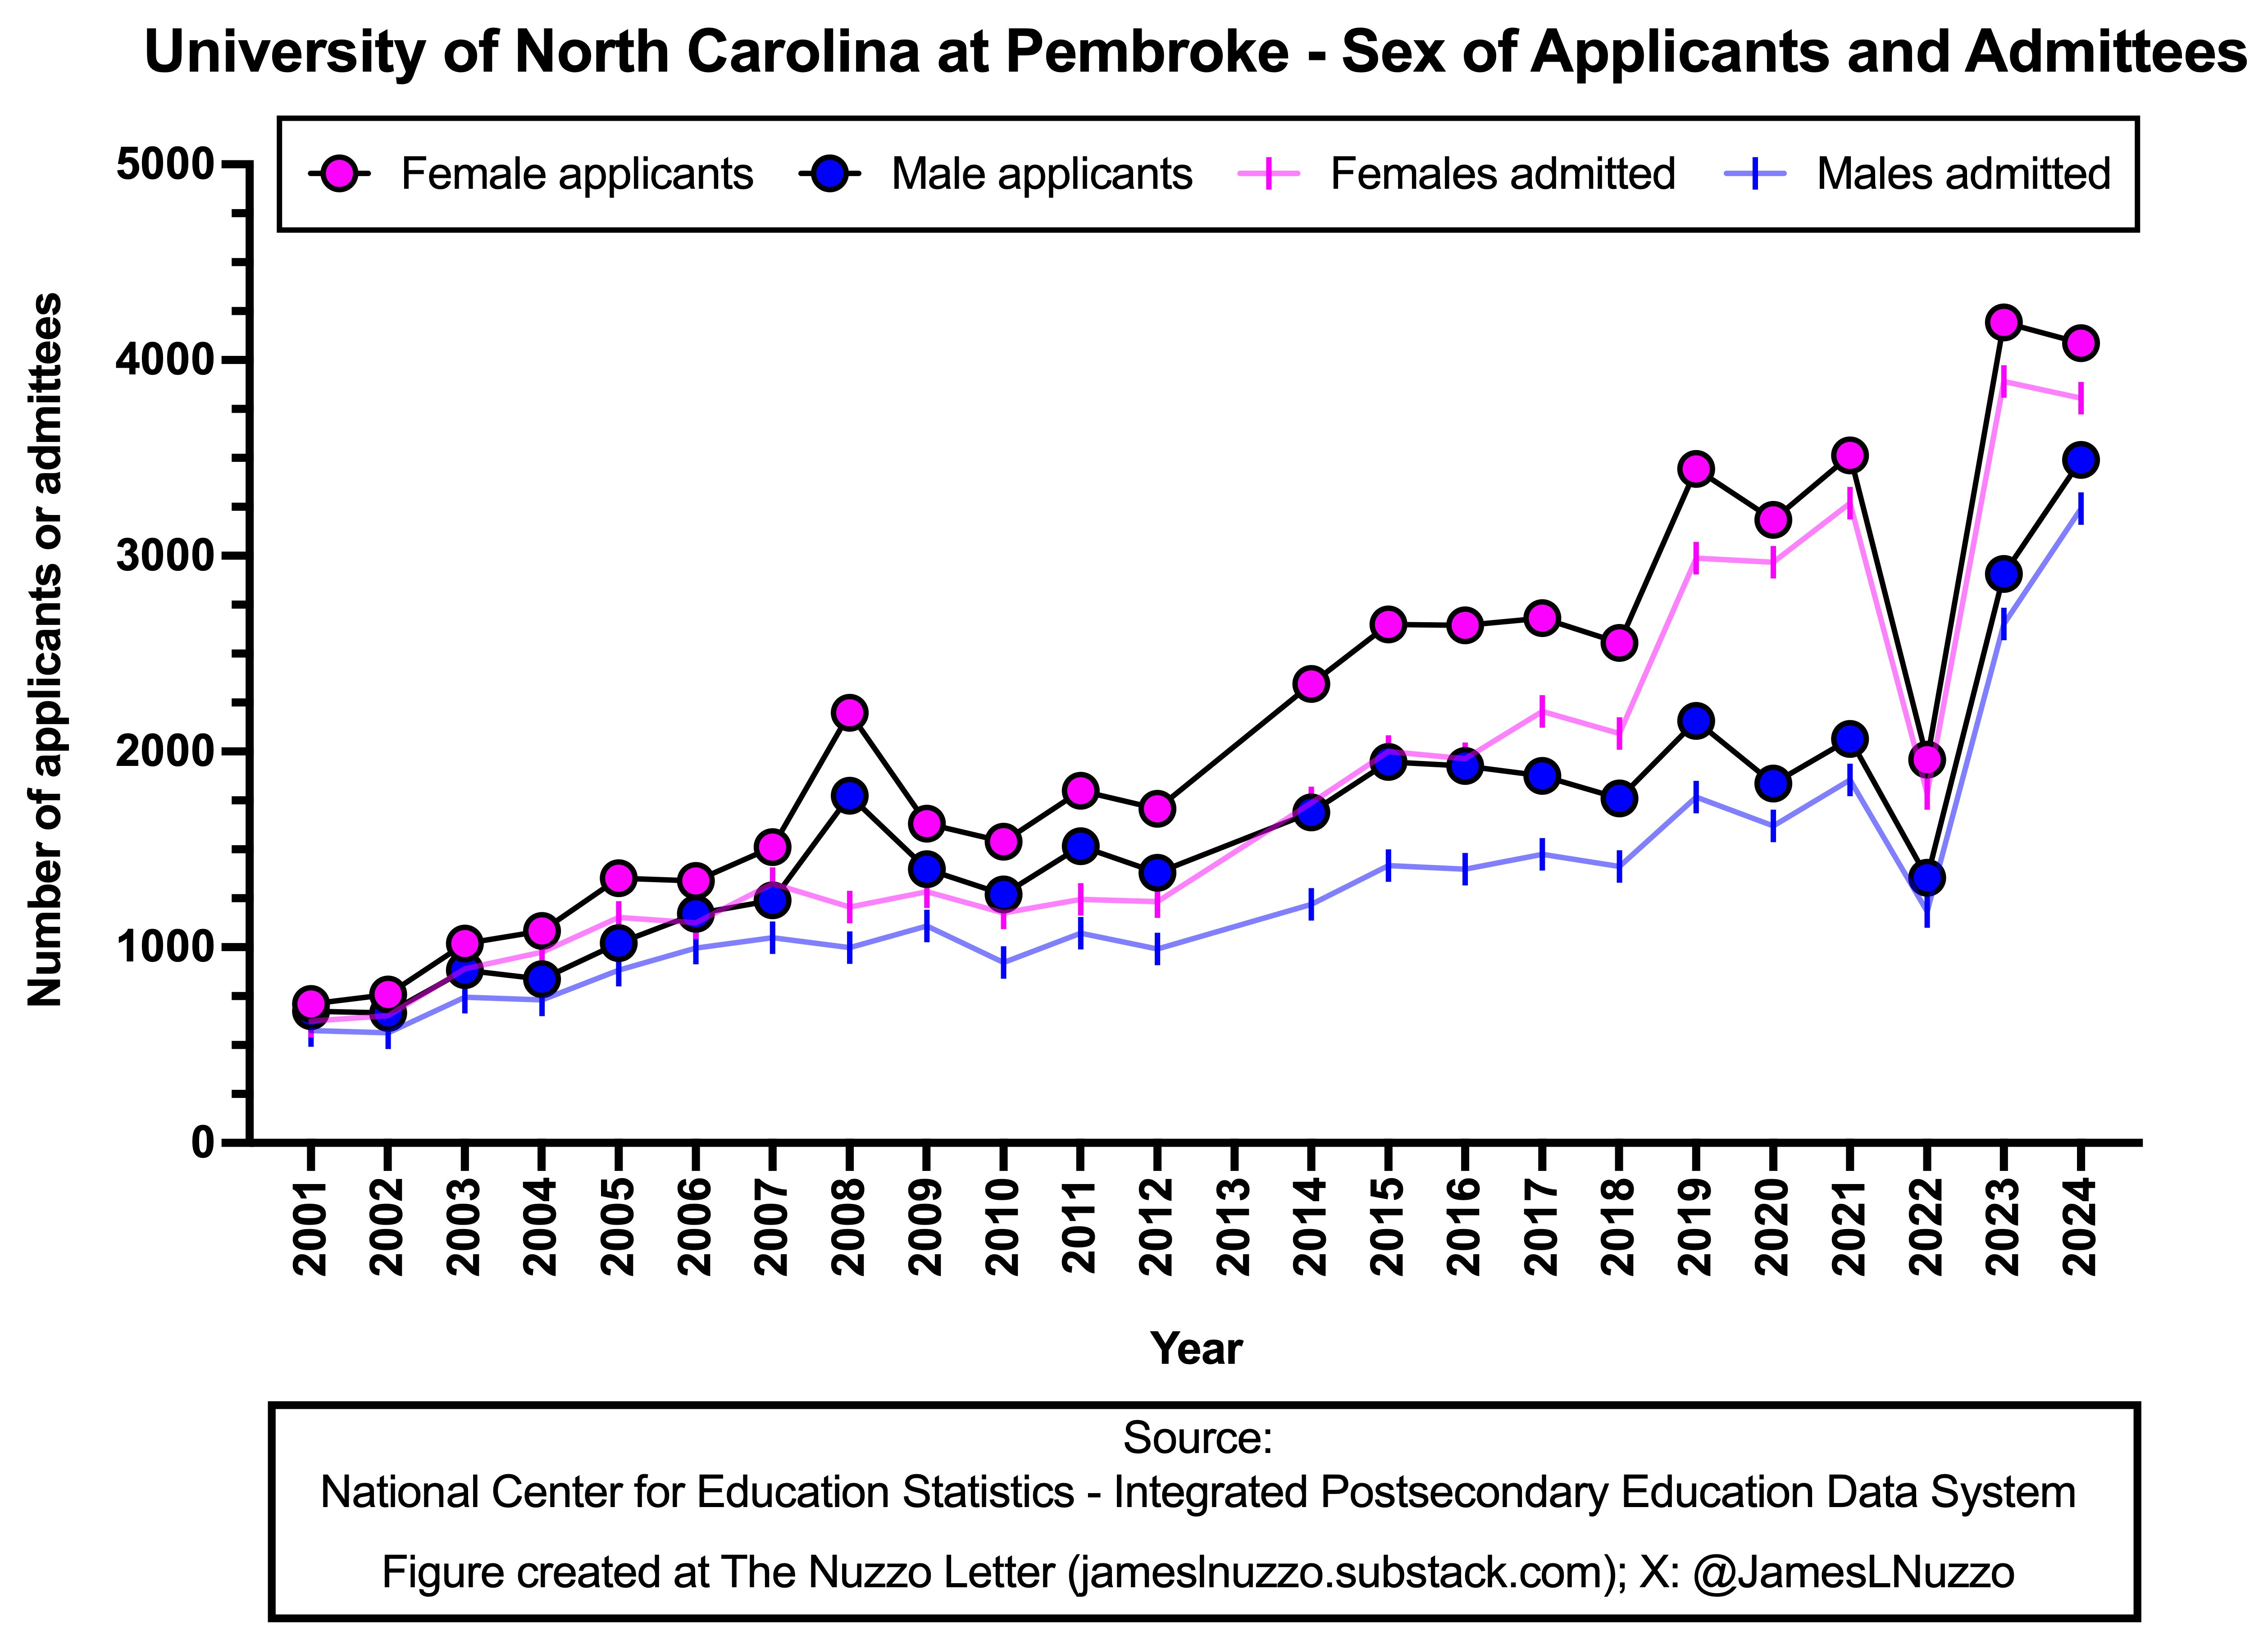
The number of males and females who applied to the University of North Carolina at Pembroke increased over time, with a significant one-year reduction in 2022, followed by a substantial increase.
Each year between 2001 and 2024, more females than males applied to the University of North Carolina at Pembroke.
In 2024, 4,086 females and 3,490 males applied to the University of North Carolina at Pembroke (53.9% female applicants).
The number of males and females who were admitted to the University of North Carolina at Pembroke increased over time, with a marked increase occurring in 2019, followed by a significant reduction in 2022 and then substantial increase in 2023.
Each year between 2001 and 2024, more females than males were admitted to the University of North Carolina at Pembroke.
In 2024, 3,805 females and 3,242 males were admitted to the University of North Carolina at Pembroke (54.0% female applicants).
Between 2001 and 2024, the University of North Carolina at Wilmington admitted a larger percentage of female than male applicants in some years and a larger percentage of male than female applicants in other years. Consequently, in some years, the female:male admissions ratio was greater than 1.0 each year. In other years, the ratio was below 1.0.
Between 2001 and 2024, the average annual percentages of female and male applicants admitted to the University of North Carolina at Wilmington were 63.5% and 61.0%, respectively.
Between 2001 and 2024, the average annual female:male admissions ratio at the University of North Carolina at Wilmington was 1.04. In 2024, the ratio was 1.10.
The number of males and females who applied to the University of North Carolina at Wilmington increased over time, with a notable exponential increase occurring starting in 2021.
Each year between 2001 and 2024, more females than males applied to the University of North Carolina at Wilmington.
In 2024, 13,602 females and 6,787 males applied to the University of North Carolina at Wilmington (66.7% female applicants).
The number of males and females who were admitted to the University of North Carolina at Wilmington was fairly constant between 2001 and 2011 and then gradually increased until 2020, after which, the number of females admitted increased exponentially.
Each year between 2001 and 2024, more females than males were admitted to the University of North Carolina at Wilmington.
In 2024, 9,000 females and 4,100 males were admitted to the University of North Carolina at Wilmington (68.7% female applicants).
Between 2001 and 2024, the University of North Carolina School of the Arts admitted a larger percentage of male than female applicants each year between 2001 and 2012 and for select years thereafter. Consequently, the female:male admissions ratio was less than 1.0 for most years.
Between 2001 and 2024, the average annual percentages of female and male applicants admitted to the University of North Carolina School of the Arts were 36.5% and 43.4%, respectively. Admissions rates were lowest in the most recent years.
Between 2001 and 2024, the average annual female:male admissions ratio at the University of North Carolina School of the Arts was 0.86. In 2024, the ratio was 0.96.
The number of males and females who applied to the University of North Carolina School of the Arts was roughly constant between 2001 and 2012 and then increased noticeably in later years, particularly among female applicants.
Each year between 2001 and 2024, more males than females applied to the University of North Carolina School of the Arts.
In 2024, 928 females and 507 males applied to the University of North Carolina School of the Arts (64.7% female applicants).
The number of males and females who were admitted to the University of North Carolina School of the Arts was roughly constant between 2001 and 2012 but then increased noticeably in 2018.
Roughly equal numbers of males and females were admitted to the University of North Carolina School of the Arts between 2001 and 2012. A marked increase in the number of females admitted started in 2018 and remained each year thereafter.
In 2024, 928 females and 507 males were admitted to the University of North Carolina School of the Arts (64.7% female applicants).
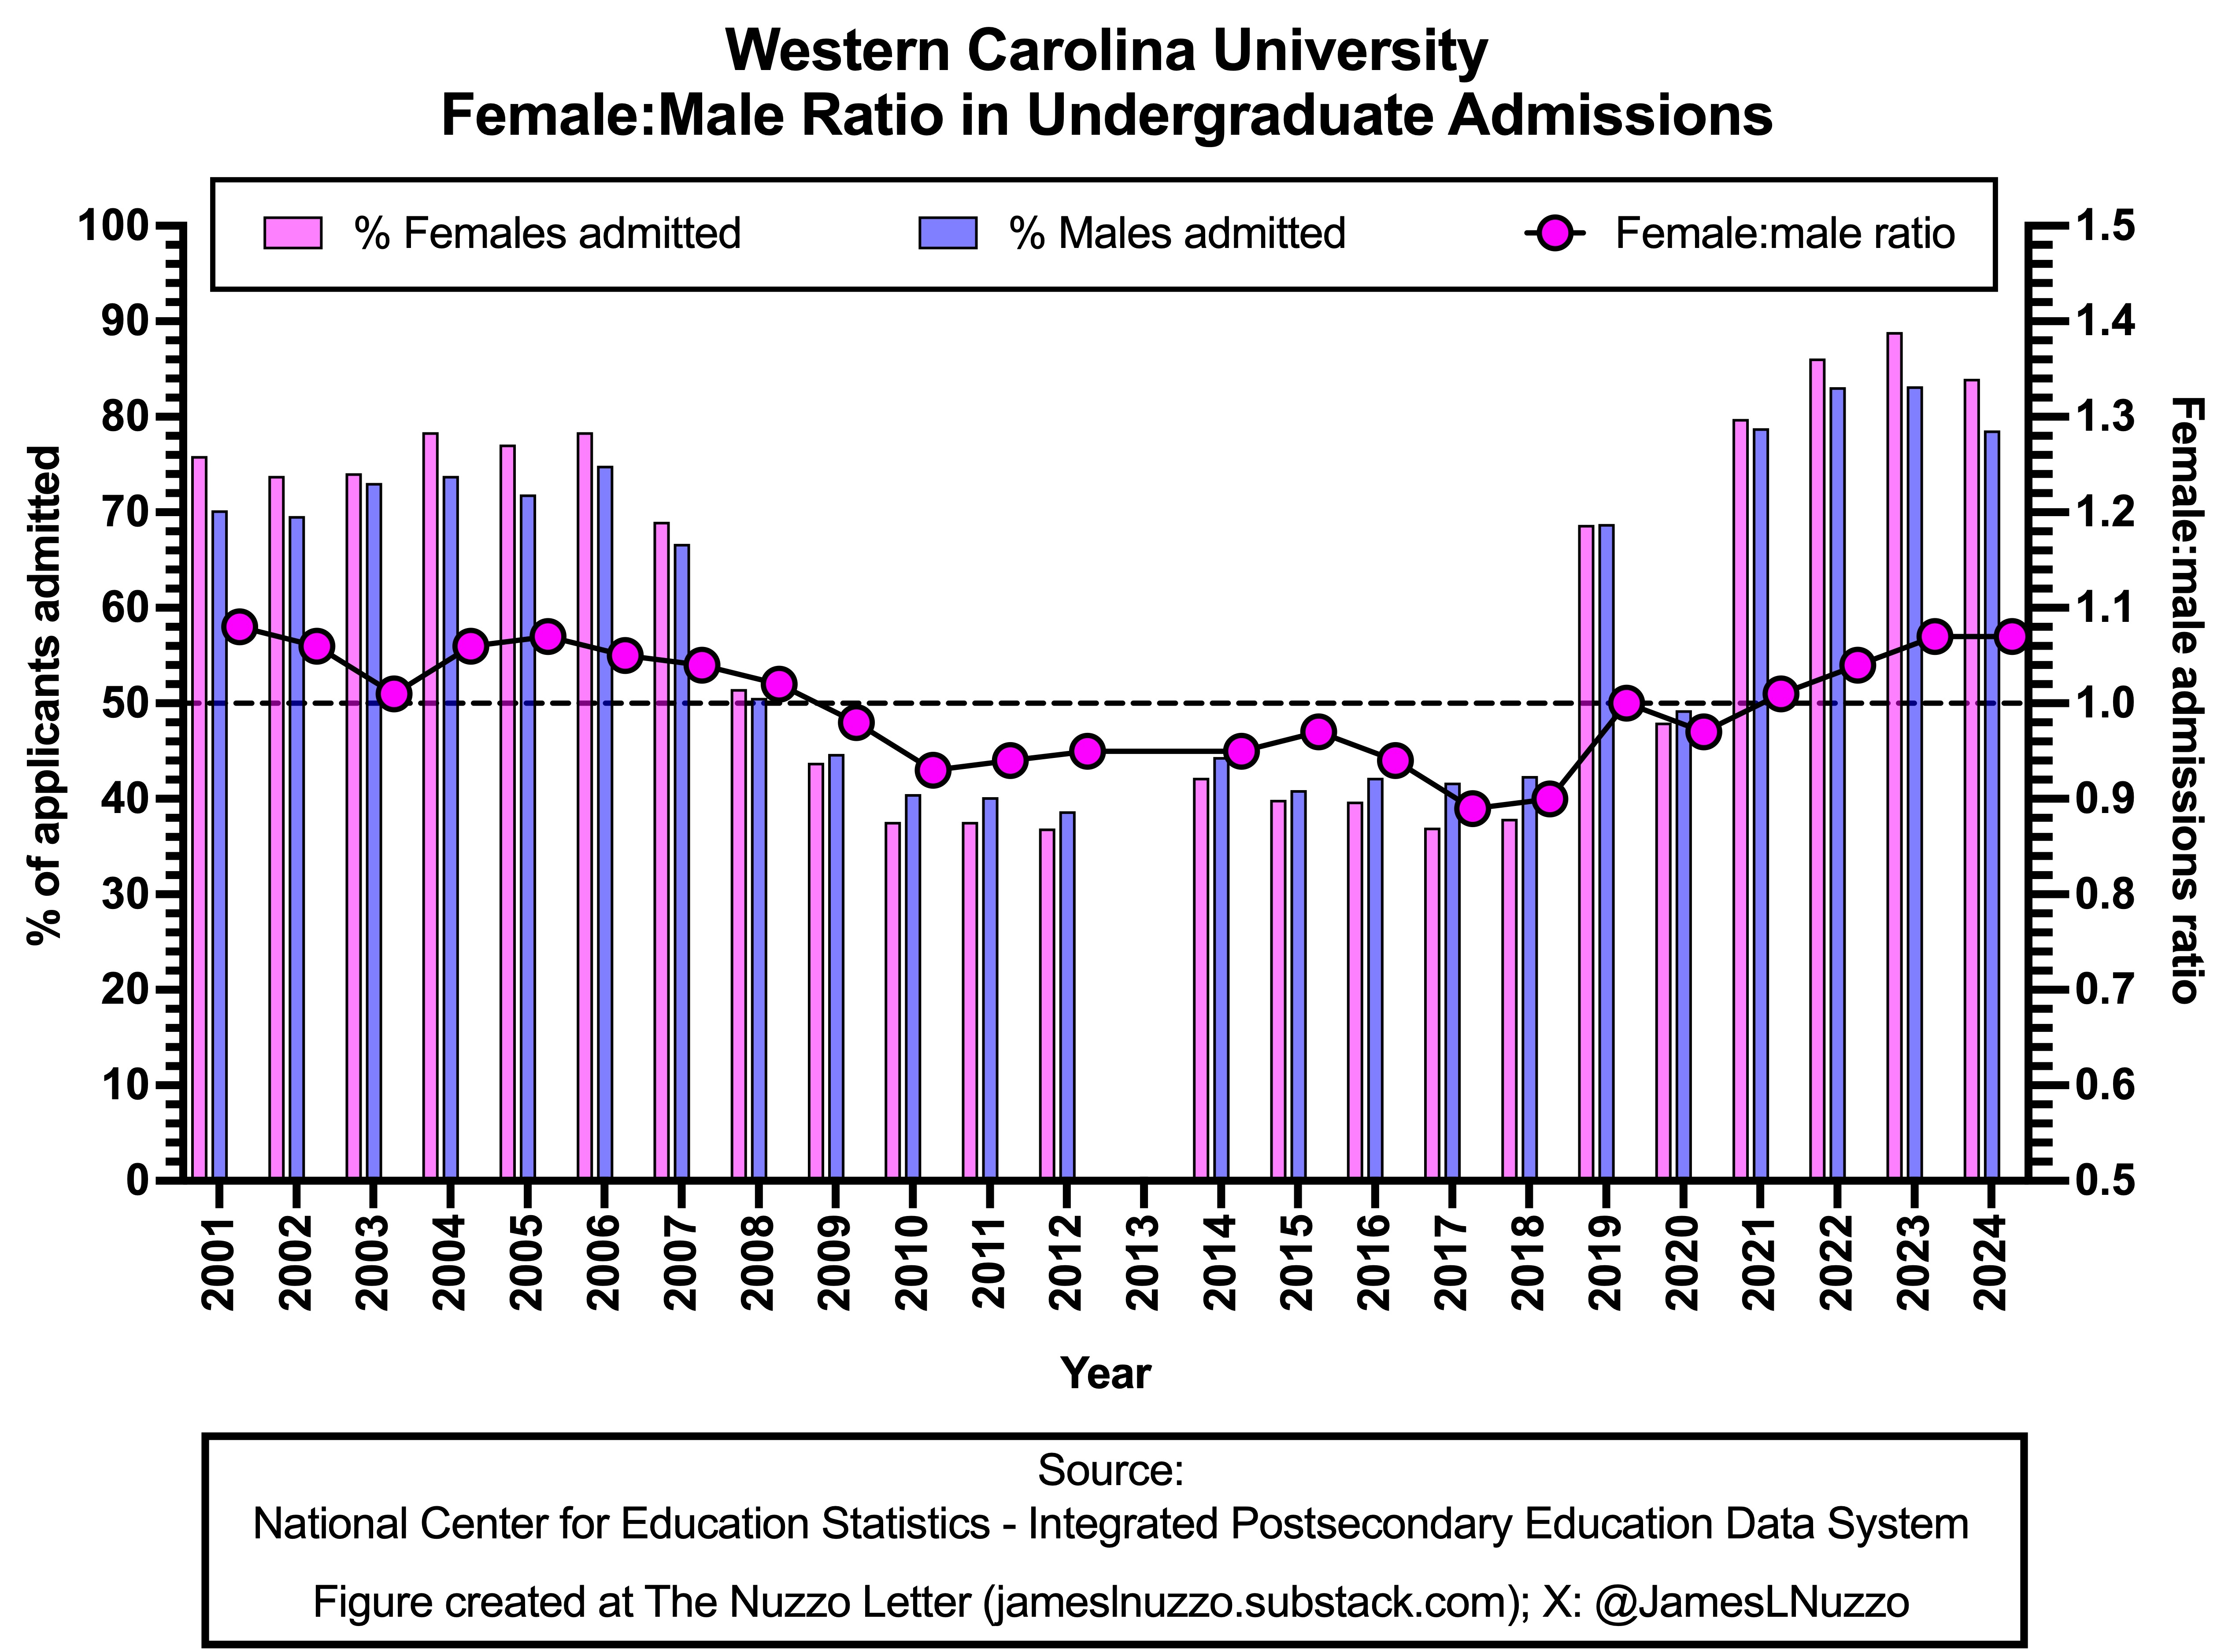
Between 2001 and 2024, Western Carolina University admitted a larger percentage of female than male applicants between 2001 and 2008 and then again between 2021 and 2024. Consequently, the female:male admissions ratio was greater than 1.0 each year for those years. For all other years, the female:male admissions ratio was less than 1.0.
Between 2001 and 2024, the average annual percentages of female and male applicants admitted to Western Carolina University were 60.3% and 59.5%, respectively. Admissions rates decreased markedly starting in 2008, remained relatively consistent until 2018, increased substantially in 2019, decreased back to previous levels in 2020, and then increased markedly again starting in 2021.
Between 2001 and 2024, the average annual female:male admissions ratio at Western Carolina University was 1.00. In 2024, the ratio was 1.07.
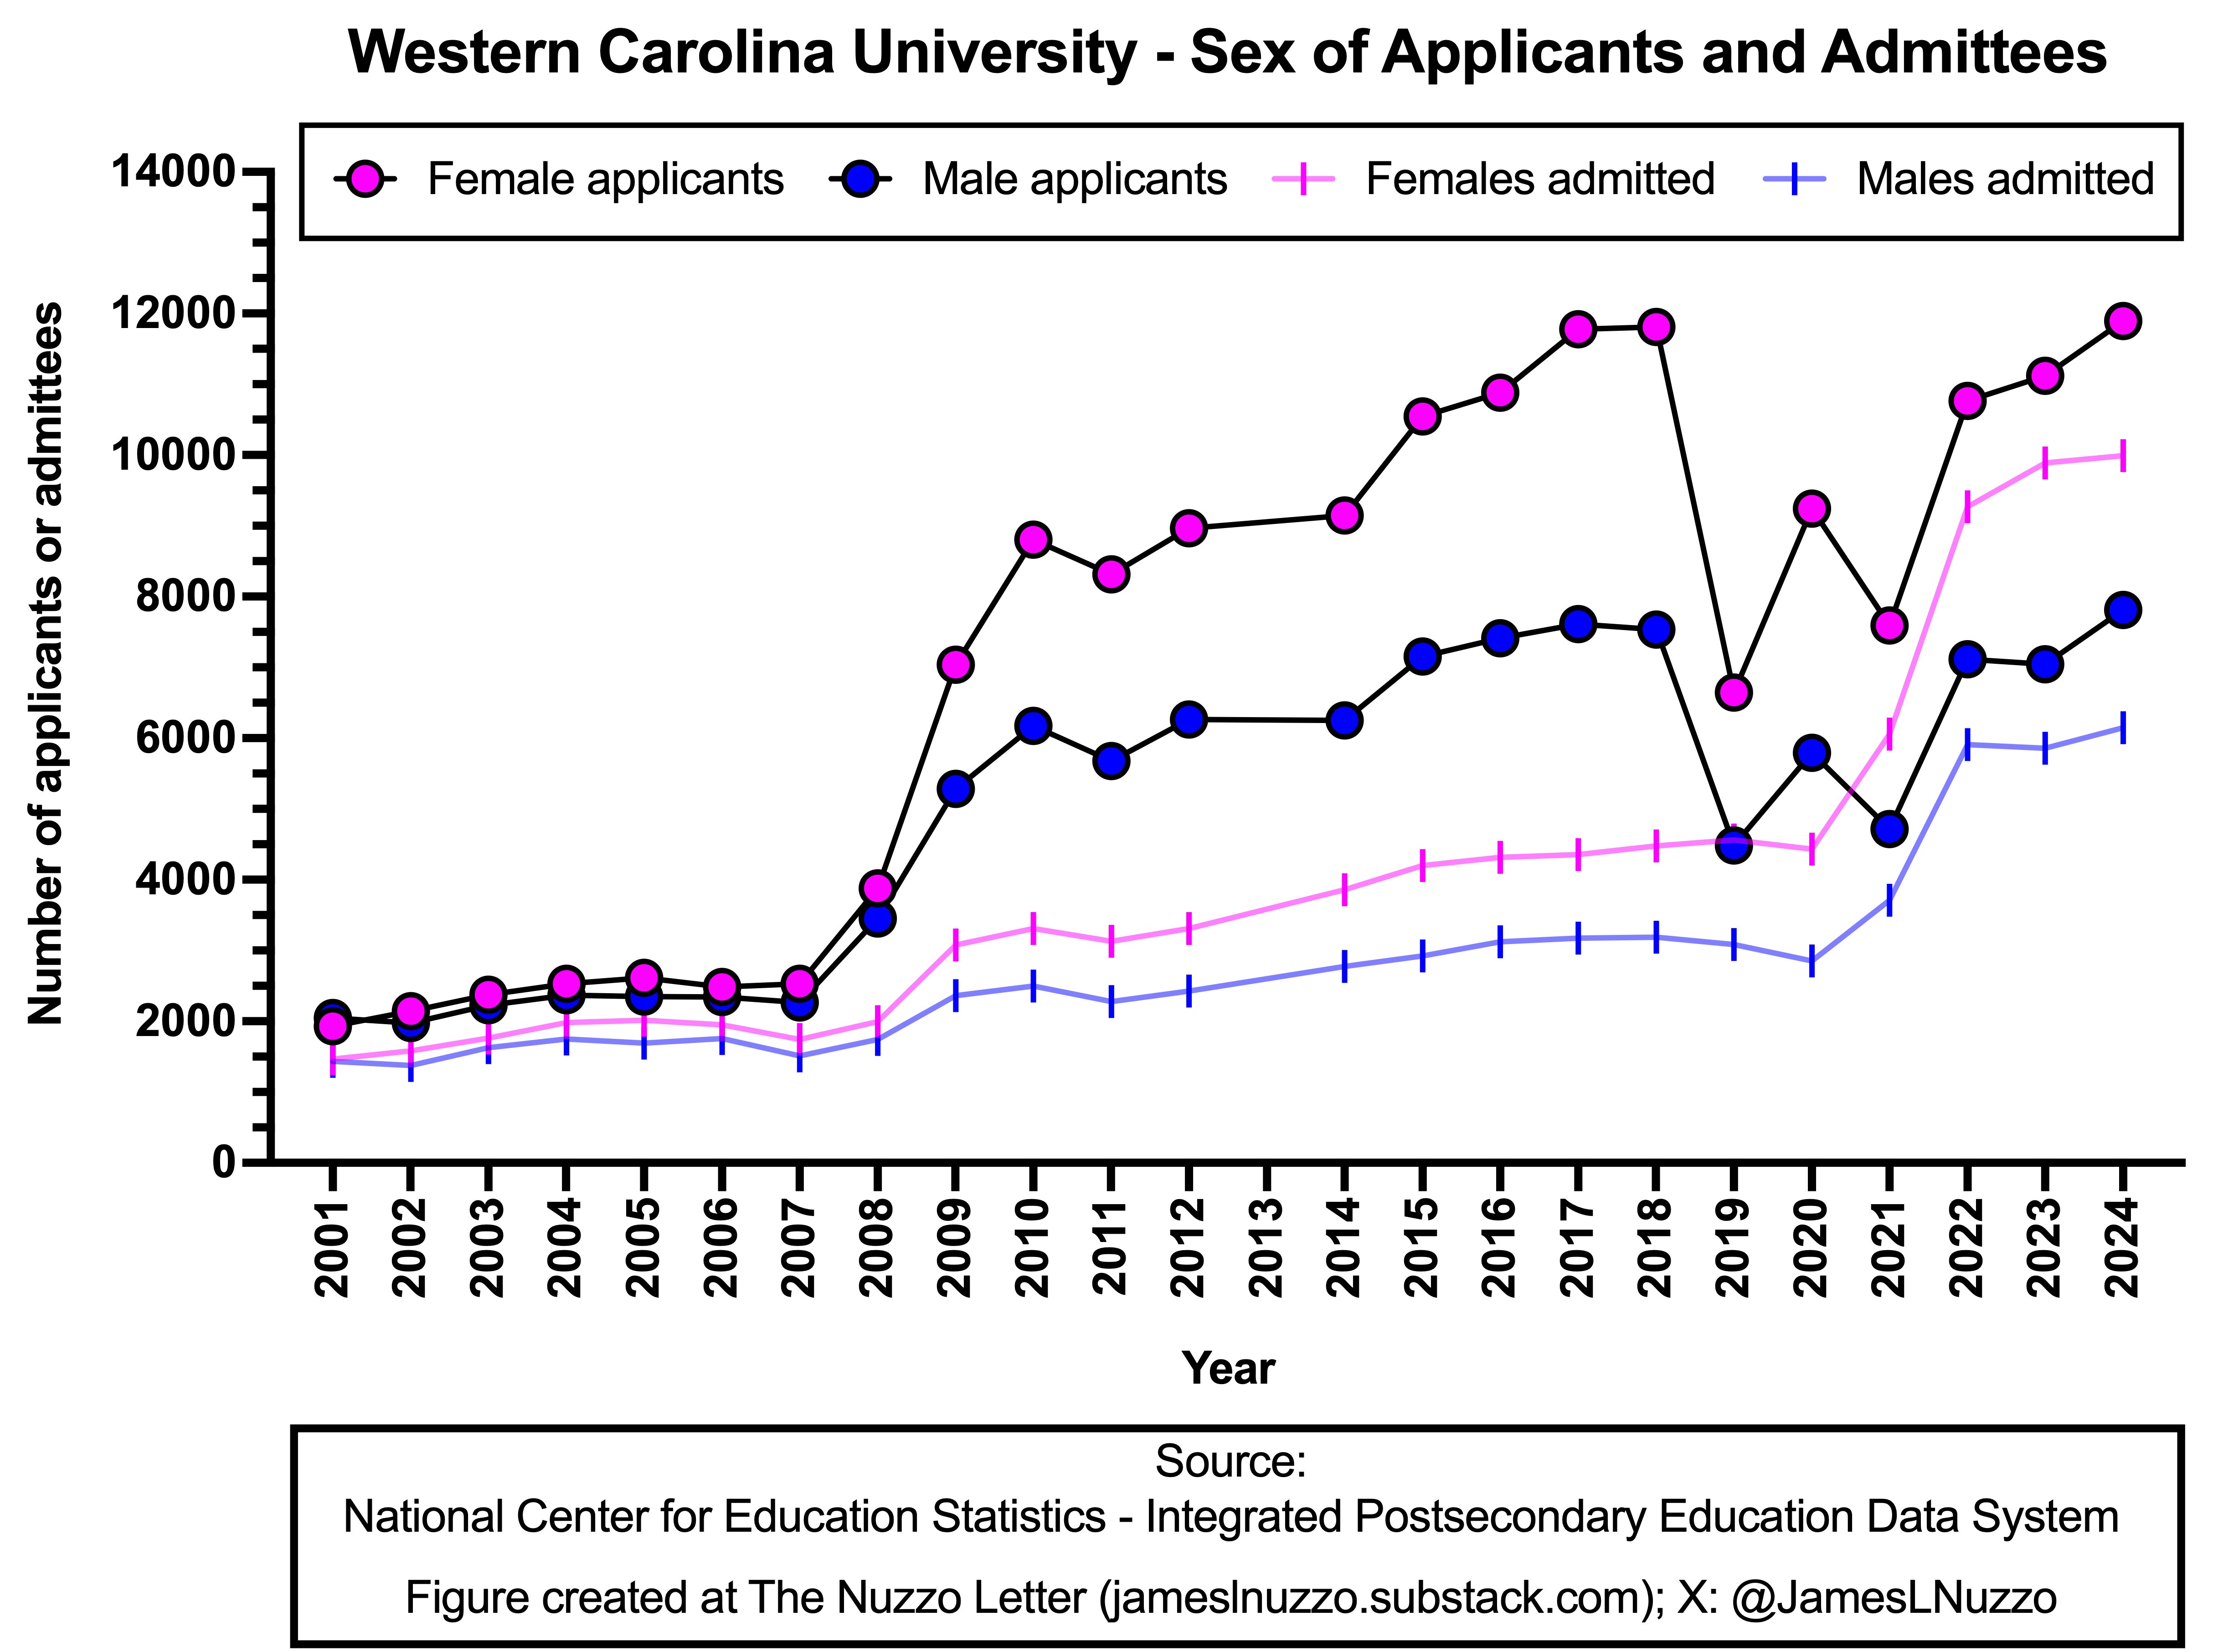
The number of males and females who applied to Western Carolina University was fairly constant between 2001 and 2007 then increased markedly between 2008 and 2018, decreased between 2019 and 2021, and then increased in the years thereafter.
Each year between 2001 and 2024, more females than males applied to Western Carolina University.
In 2024, 11,892 females and 7,815 males applied to Western Carolina University (61.9% female applicants).
The number of males and females who were admitted to Western Carolina University was fairly constant between 2001 and 2008, increased in 2009, remained constant for a few more years, then increased gradually until 2020 after which the number increased significantly.
Each year between 2001 and 2024, more females than males were admitted to Western Carolina University.
In 2024, 9,990 females and 6,146 males were admitted to Western Carolina University (61.9% female applicants).
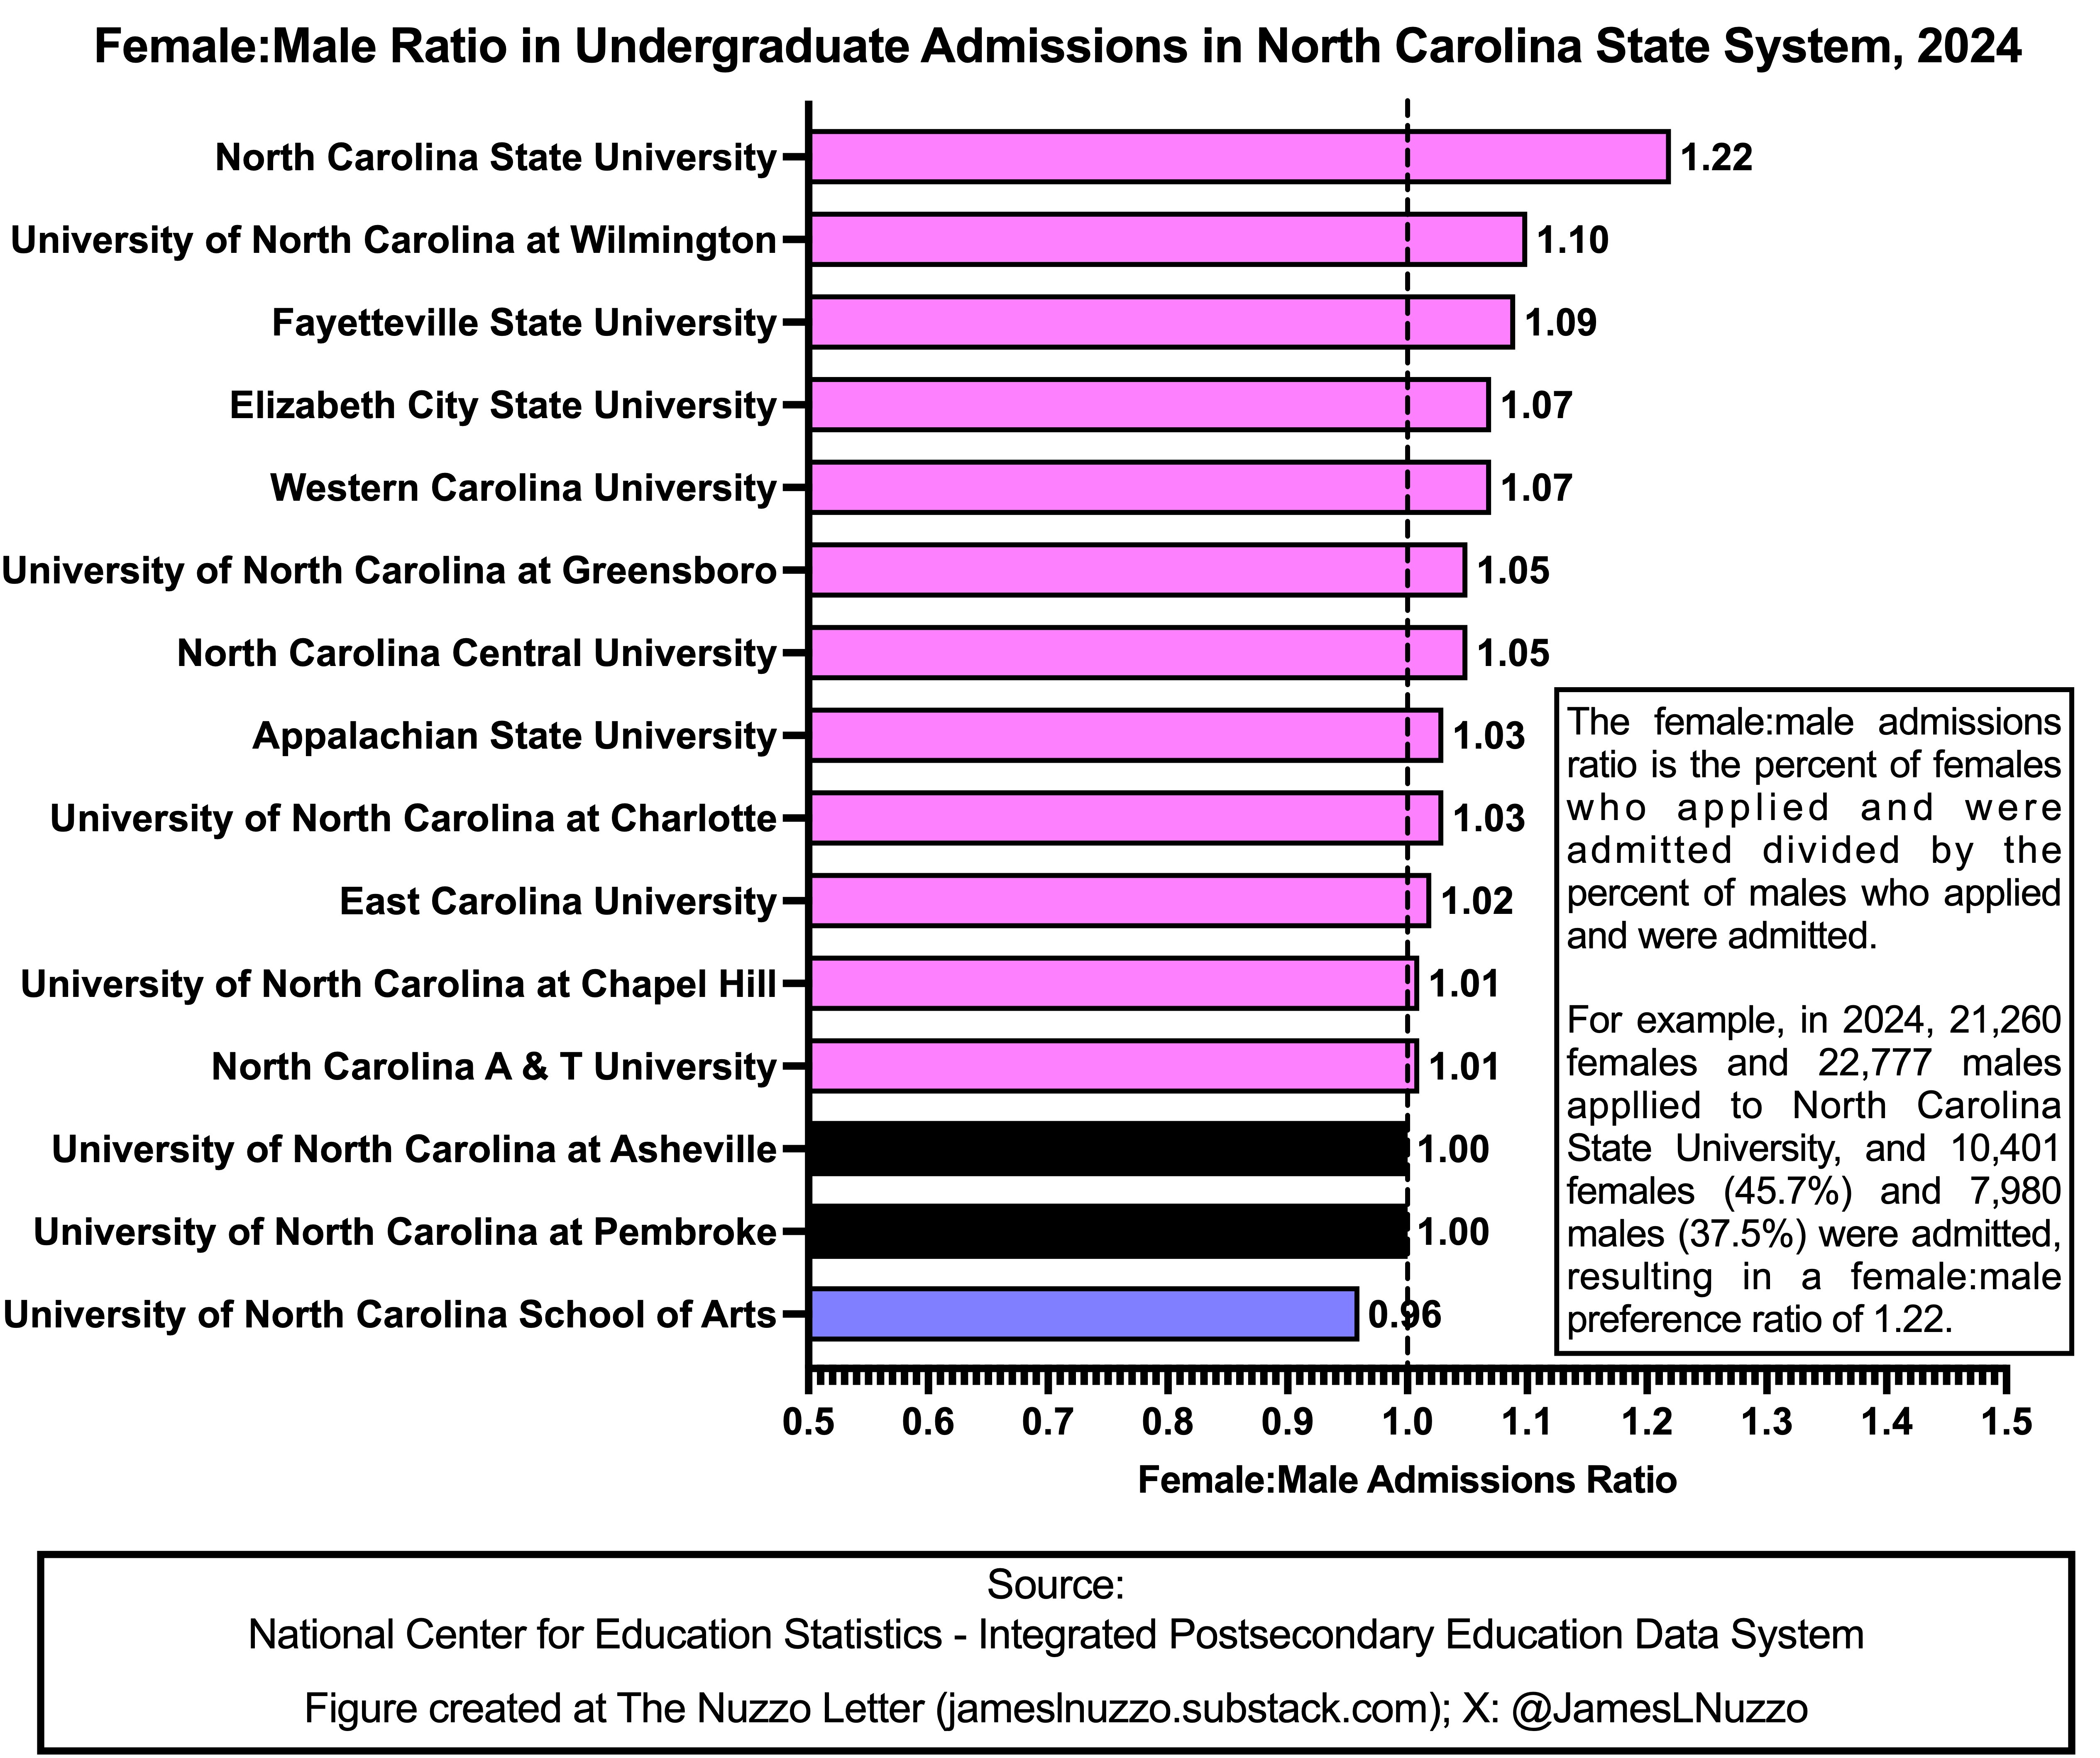
The data in the graph below are organized from top to bottom by greatest female:male admissions ratio in 2024.
Of the 15 universities, 12 had a female:male admissions ratio greater than 1.0 (i.e., female preference), one had a female:male admissions ratio less than 1.0 (i.e., male preference), and two had a female:male admissions ratio equal to one (i.e., no sex preference).
The university in the North Carolina state system that had the greatest female:male admissions ratio in 2024 was North Carolina State University (1.22).
The universities in the North Carolina state system that have had the lowest female:male admissions ratio in 2024 was the University of North Carolina School of Arts (0.96).
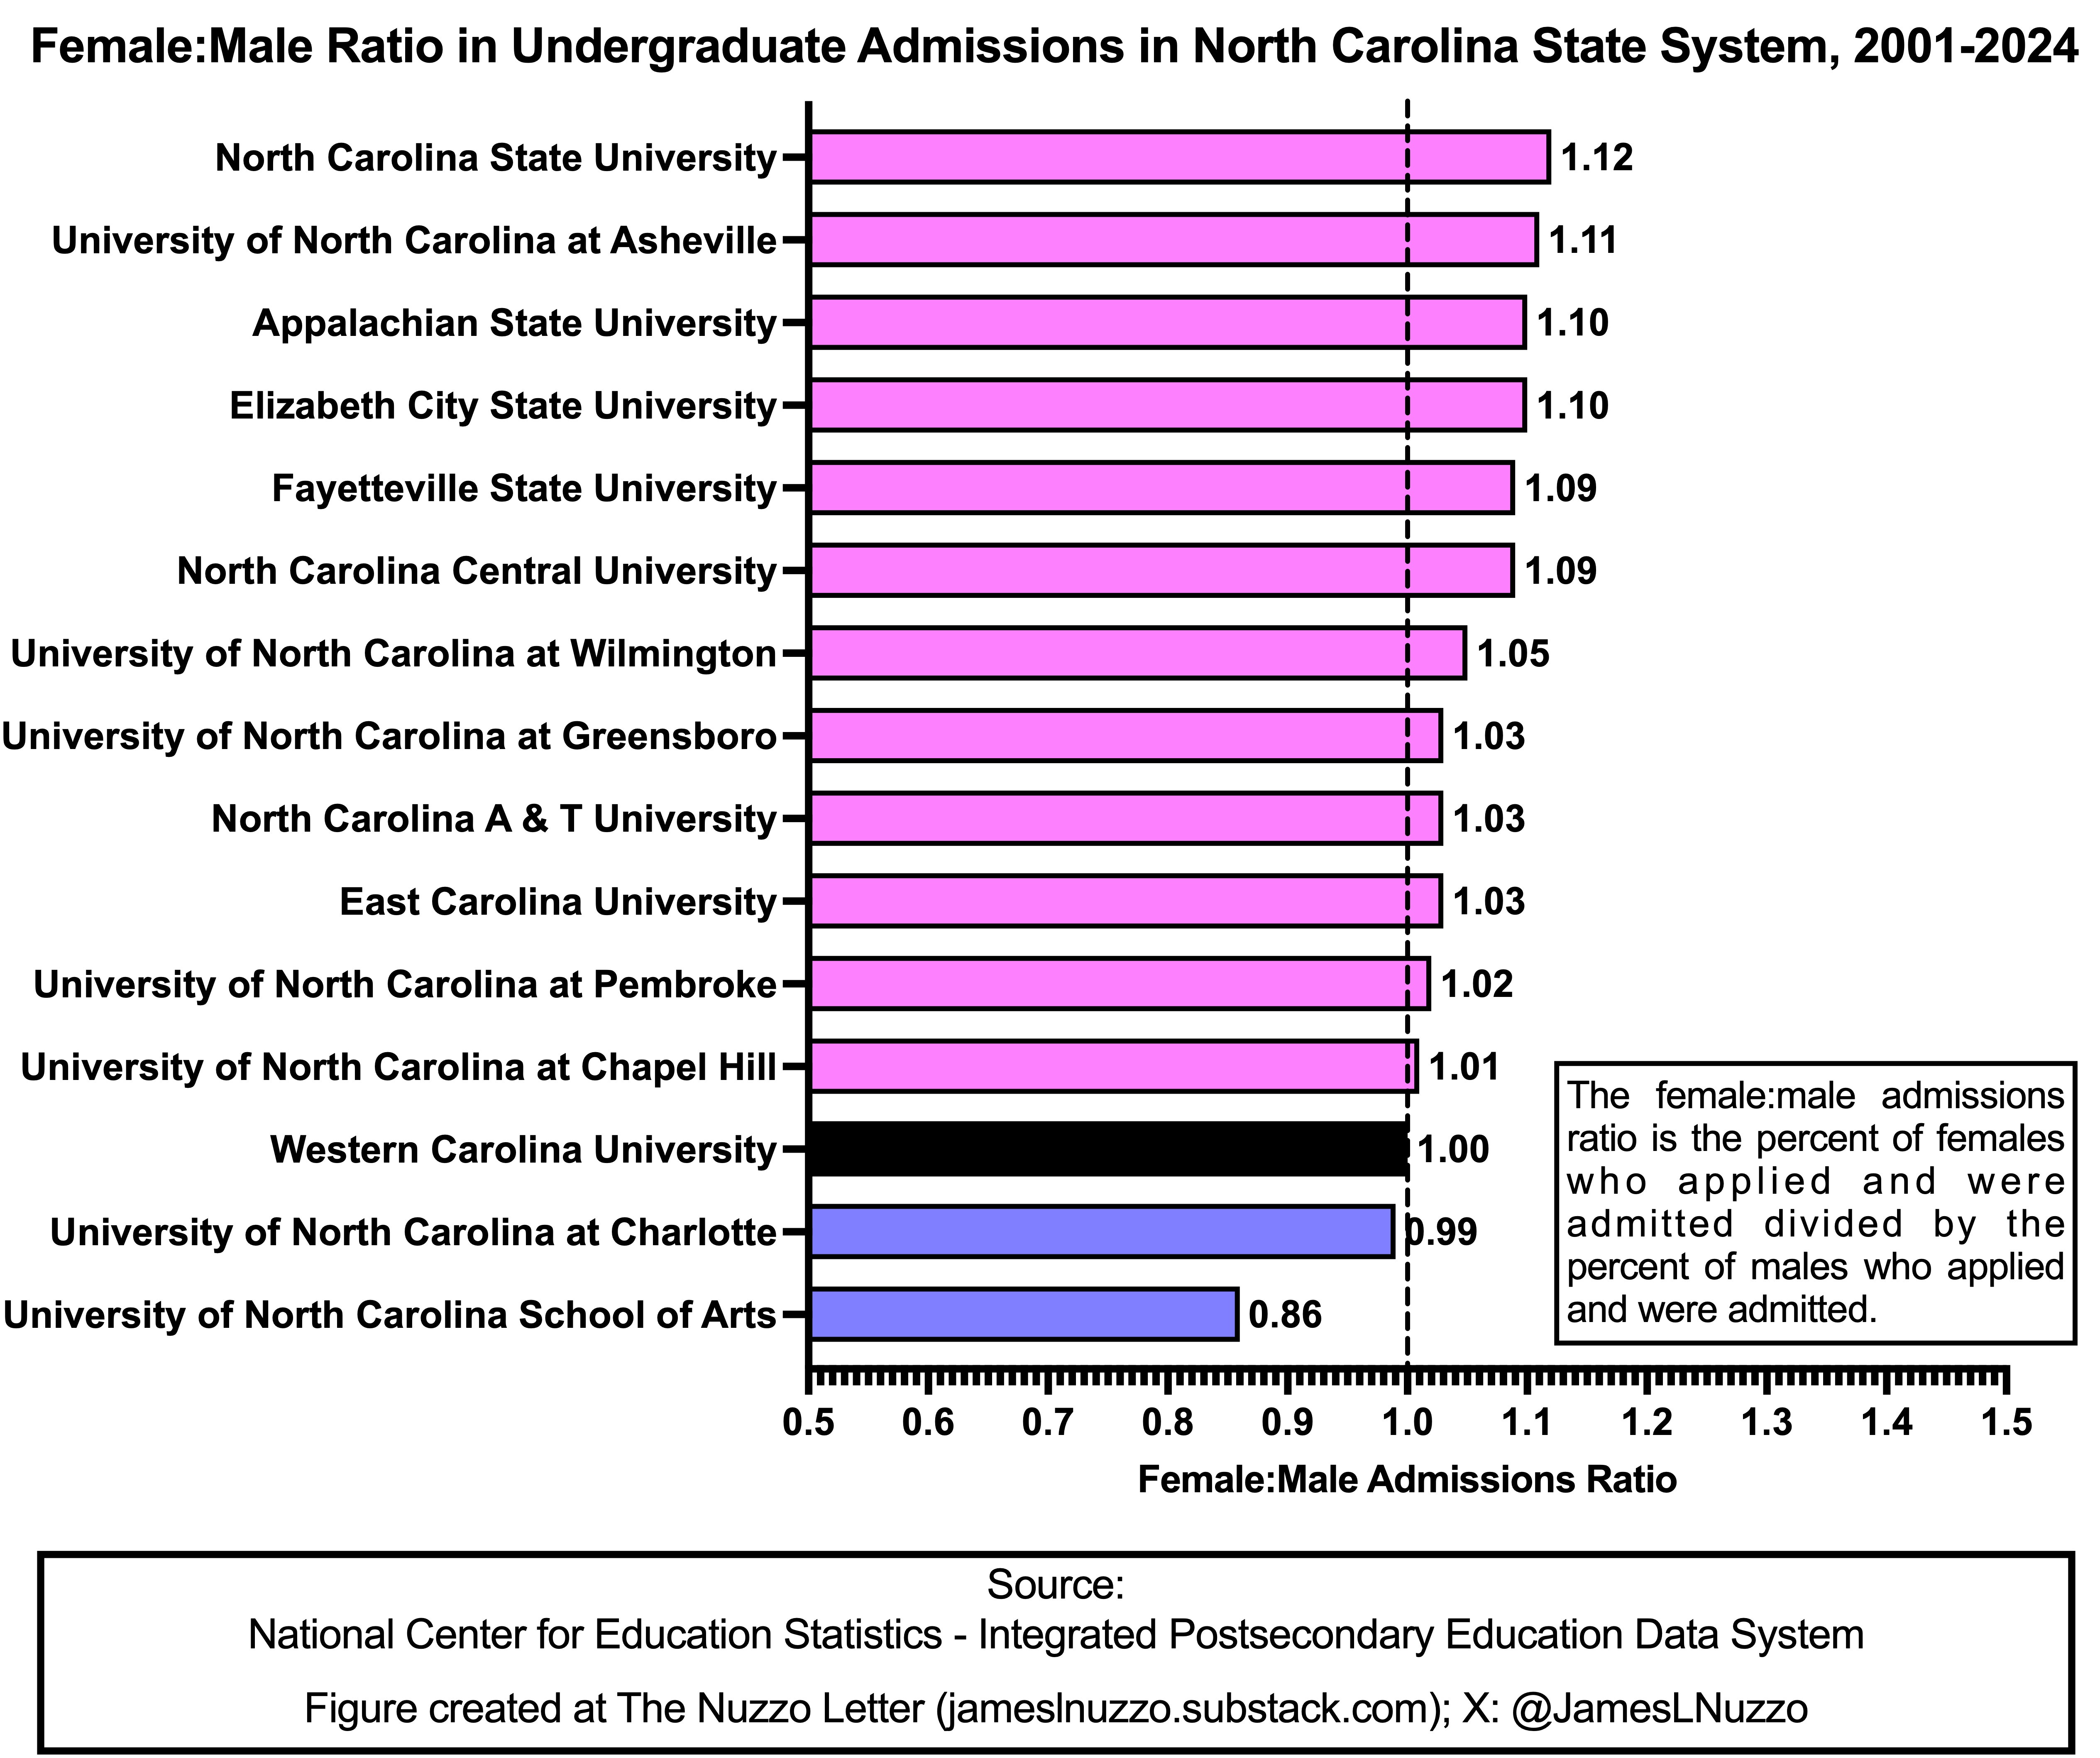
The data in the graph below are the female:male admissions ratios averaged across each year between 2001 and 2024, organized from top to bottom by greatest female:male admissions ratio.
Of the 15 universities, 12 had a female:male admissions ratio greater than 1.0 (i.e., female preference), two had a female:male admissions ratio less than 1.0 (i.e., male preference), and one had a female:male admissions ratio equal to one (i.e., no sex preference).
The university in the North Carolina state system that had the greatest female:male admissions ratio averaged across all years between 2001 and 2024 was North Carolina State University (1.12).
The universities in the North Carolina state system that have had the lowest female:male admissions ratio averaged across all years between 2001 and 2024 was the University of North Carolina School of Arts (0.86).
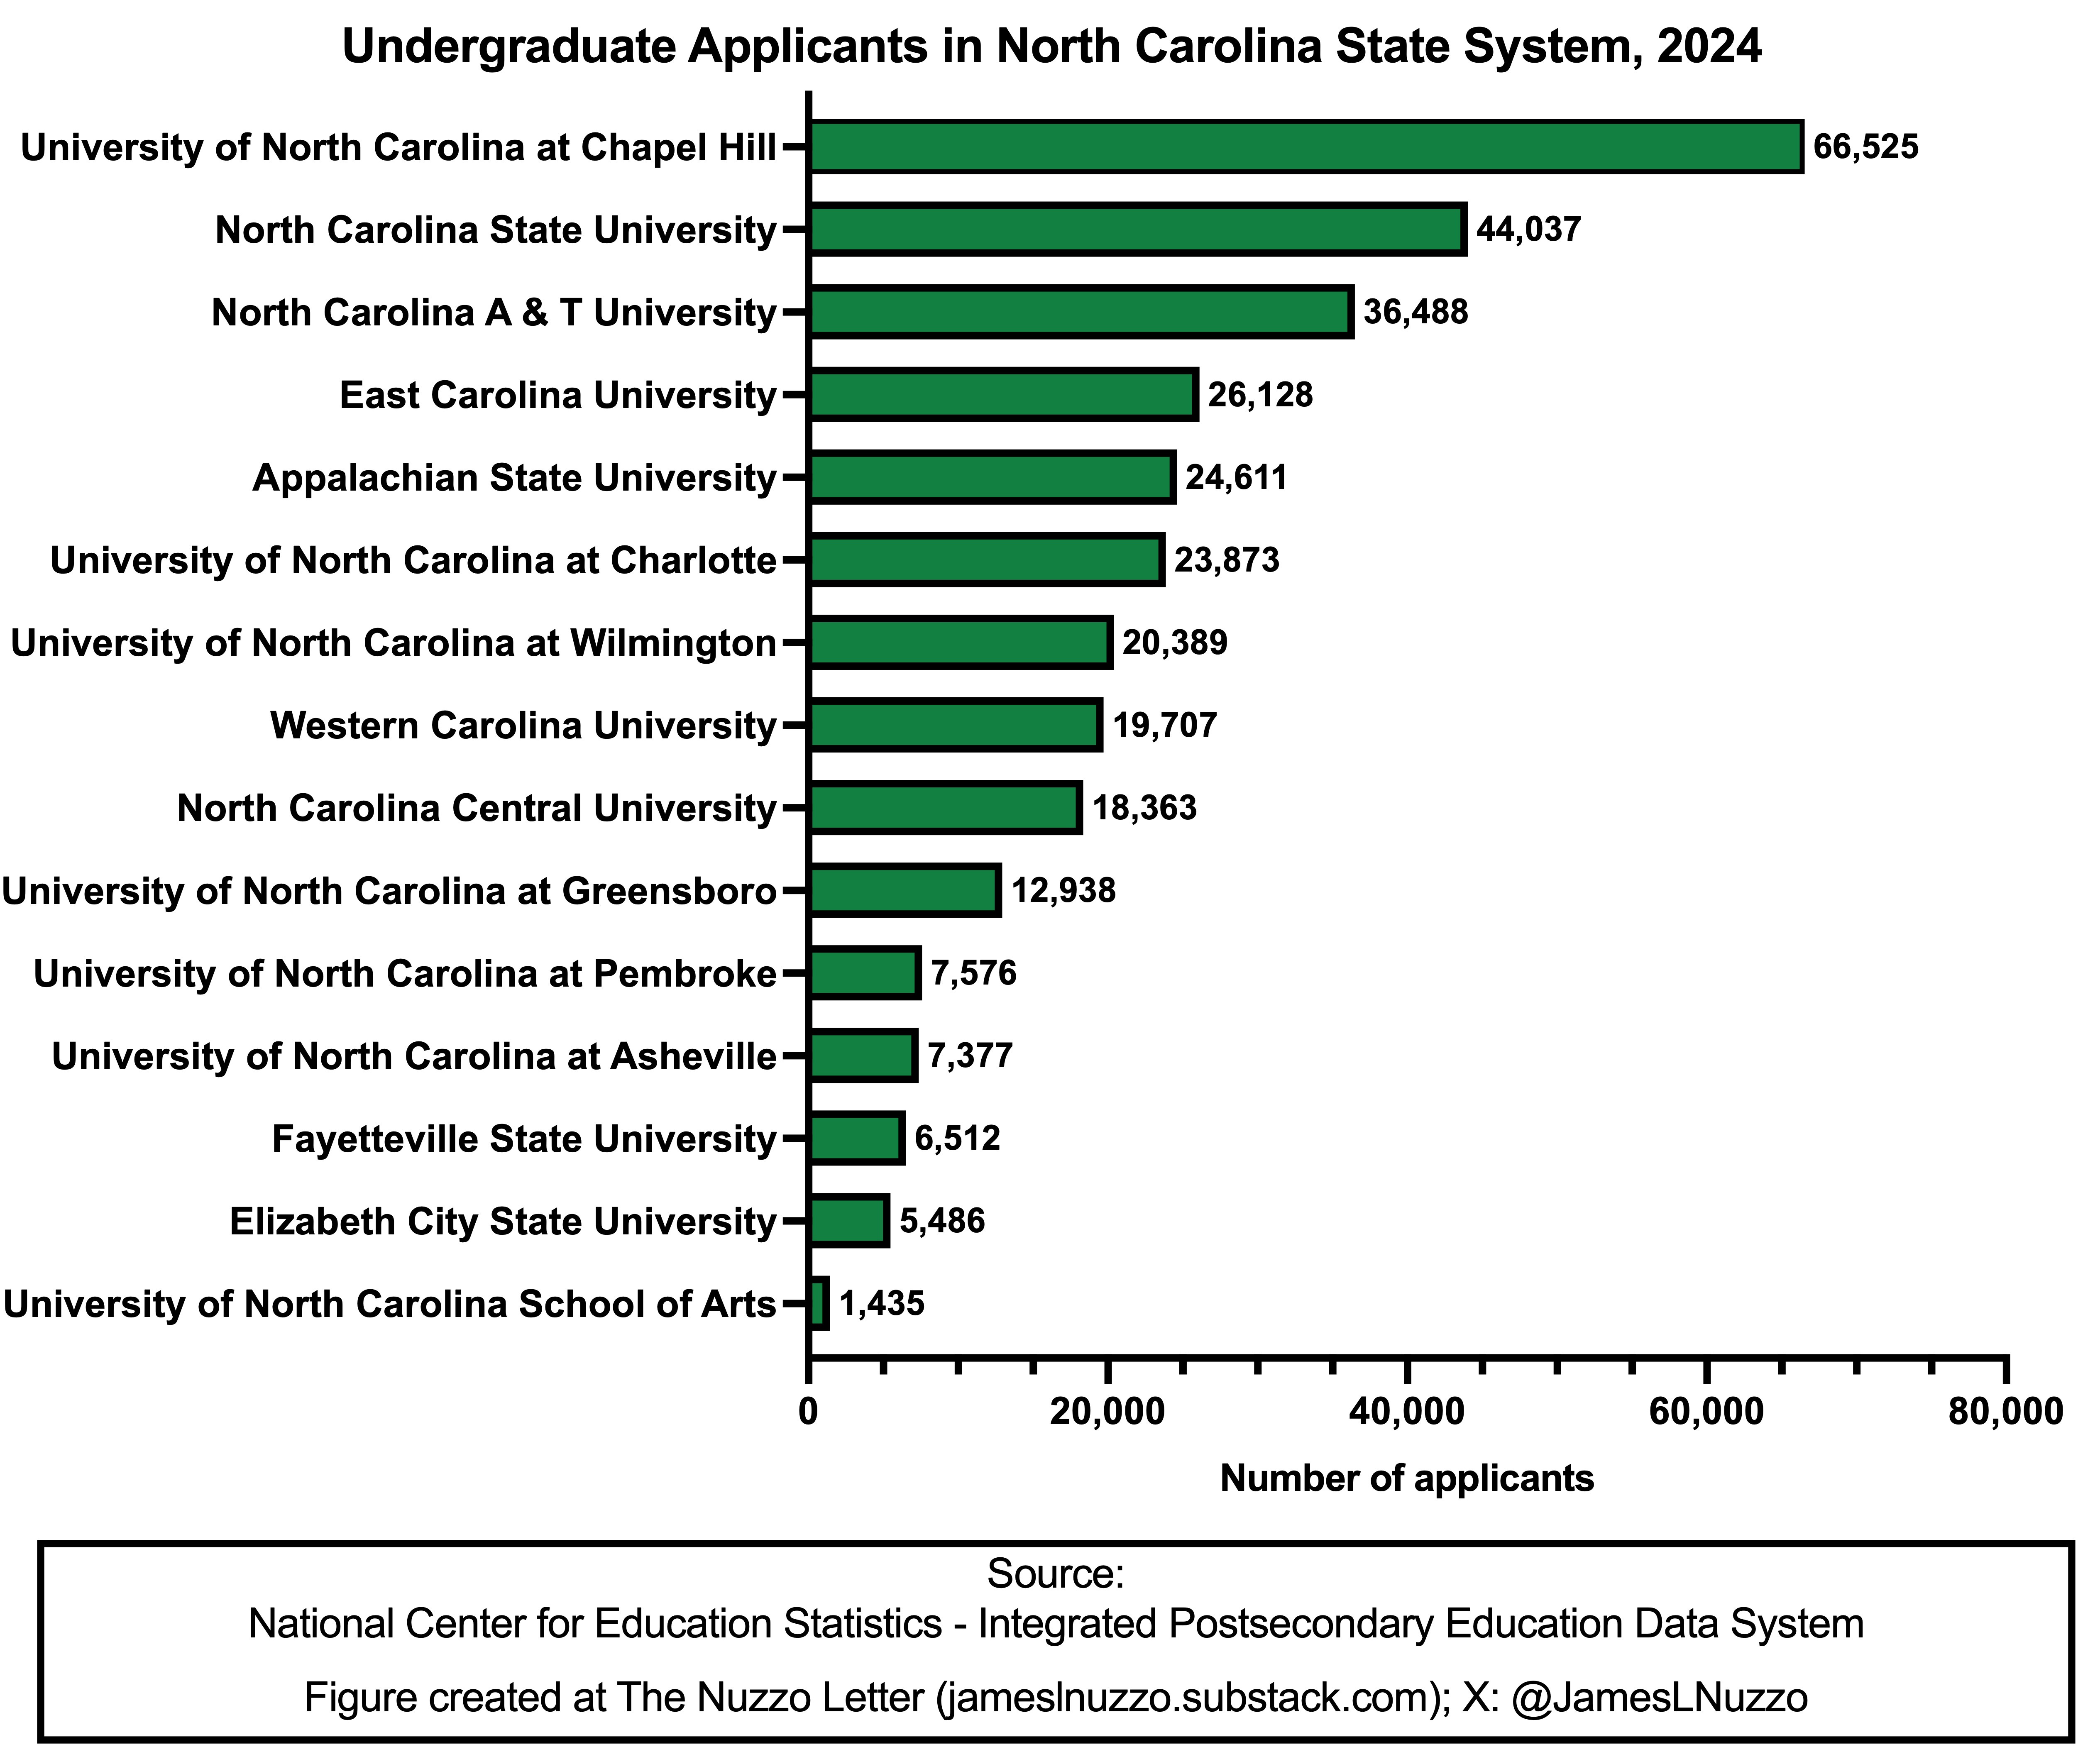
The graph below shows the number of applicants (male plus female) to universities in the North Carolina state system in 2024, organized from top to bottom by highest to lowest number of applicants.
The university in the North Carolina state system that had the highest number of applicants in 2024 was the University of North Carolina at Chapel Hill (66,525 applicants).
The university in the North Carolina state system that had the lowest number of applicants in 2024 was the University of North Carolina School of Arts (1,435 applicants).
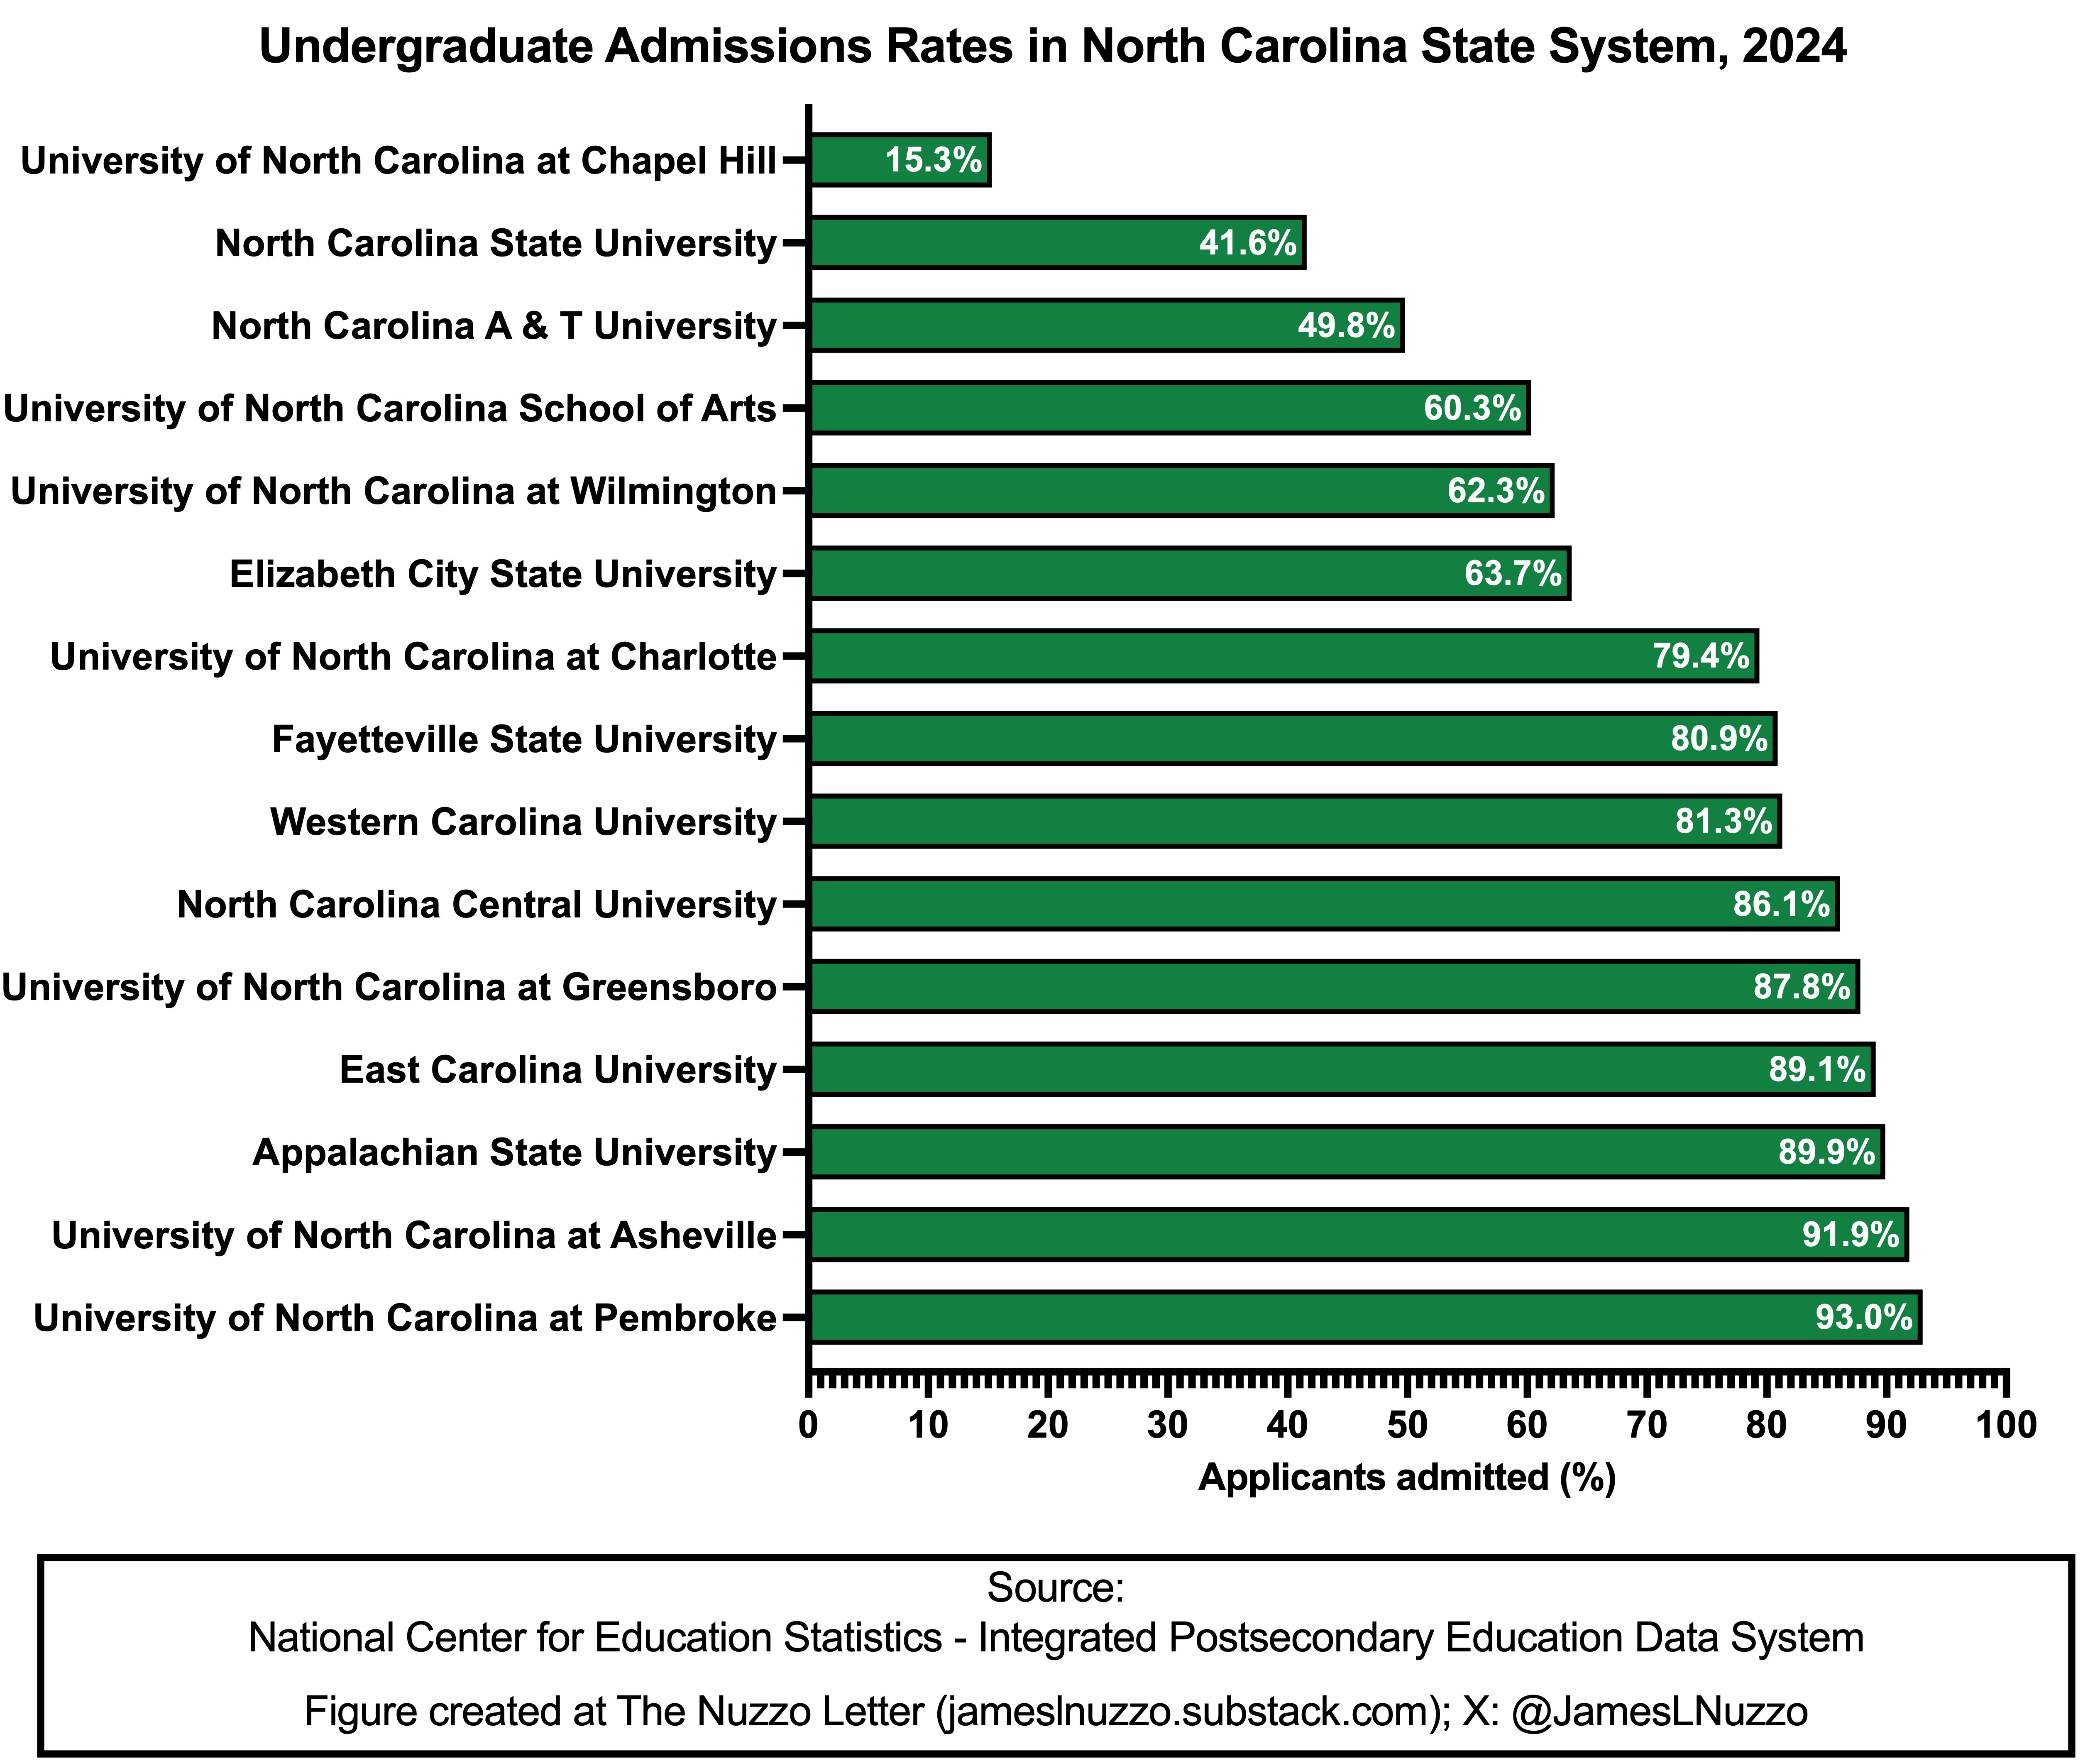
The graph below shows the admissions rates for applicants (male plus female) to universities in the North Carolina state system in 2024, organized from top to bottom by lowest to highest admissions rate.
The university in the North Carolina state system that had the lowest admission rate in 2024 was the University of North Carolina at Chapel Hill (15.3% admission rate)
The university in the North Carolina state system that had the highest admission rate in 2024 was the University of North Carolina at Pembroke (93.0% admission rate)
The current data brief is the third in a series of analyses at The Nuzzo Letter on the female:male admissions ratio in undergraduate admissions at universities in the U.S. The first data brief, which was motivated by William (Bill) Frezza’s results presented in a January 2026 webinar, revealed that four major technical universities in the U.S. – MIT, Caltech, Georgia Tech, and Carnegie Mellon University – have female:male admissions ratios ranging between 1.5 and 2.5. Given that significantly more males than females apply for admissions at those four universities, the high female:male admissions ratios suggest that those universities might be implementing sex quotas or weightings in their admissions processes—a potential violation of federal law (e.g., Title IX).
The second analysis revealed that female:male admissions ratios at Ivy League and Ivy League-adjacent universities are lower than at the major technological universities. In fact, some of the Ivy League and Ivy League-adjacent universities exhibited ratios less than 1.0, indicating male preference in admissions.
The current analysis builds off these two previous analysis and focuses on universities in North Carolina’s state system. Most of the universities exhibited a female:male admissions ratio greater than 1.0 (i.e., female preference), with six universities exhibiting an average female:male admissions ratio of 1.10 or greater over the period between 2001 and 2024.
The Martin Center proposed multiple factors that likely contribute to fewer males than females enrolling in universities in North Carolina. These factors include: (a) sex differences in career decisions; (b) fewer males than females graduating from high school; (c) fewer males than female applying for university; (d) an education system geared more toward female than male learning styles; (e) the overly politicized and feminized culture of the modern university; and (f) men’s doubts about the economic value and return on investment of a university degree.
The current data brief clarifies that fewer males than females applying for admissions is not the sole factor behind lower male than female university enrollment. The current data brief shows that, in addition to fewer males than females applying to universities, a lower percentage of males than females who apply are admitted (i.e., the female:male preference in university admissions). The source of the female:male preference in university admissions in North Carolina is unknown. The females might have stronger applications than their male counterparts. Alternatively, university staffers might be exhibiting a sex bias in who they admit to university.
If you appreciated this content, please consider supporting The Nuzzo Letter with a one-time or recurring donation. Your support is greatly appreciated. It helps me to continue to work on independent research projects and fight for my evidence-based discourse. To donate, click the DonorBox logo. In two simple steps, you can donate using ApplePay, PayPal, or another service. Thank you!

No posts
Comments
Nothing yet. Say the first thing.
Sign in to join the conversation.