
Welcome to the 190th issue of On-chain Insights by IT Tech. Bitcoin spent this week undoing its early-August recovery, and the reason wasn't broad market weakness. It was one flow reversing. US spot Bitcoin ETFs swung from $865.3M of inflows to consecutive outflows within days, and that alone dragged price from the mid-$65,000s to the low $63,000s while altcoin market cap barely moved. Sector breadth backs that up: only 4 of 24 sectors closed the week green, but Bitcoin and Ethereum weren't even among the worst performers.
Underneath the price action, the story splits by holder cohort. Short-term holders are visibly capitulating, realizing billions in losses on exchanges every day and pushing the LTH/STH SOPR ratio into a band that's historically flagged capitulation-adjacent lows. Long-term holders show no sign of following them: they remain deeply in profit and aren't the cohort selling into this move. A separate group, wallets holding 100+ BTC, kept adding supply through the month, and spot order sizes have skewed toward large trades even as futures order sizes shrank - consistent with that accumulation, though order size alone doesn't confirm it independently. Price sits below what short-term holders and ETF buyers paid on average, but well above the long-term holder floor near $49,000, which is what keeps this reading as a correction rather than a structural breakdown.
The missing piece is US demand. Coinbase has traded at a discount against global venues since spring, and that hasn’t changed this week.
This week in On-Chain:
ETF flows reversed hard: BTC ETFs shed $385M this week after $865M came in the week before, and that swing is doing most of the work in the price decline.
Short-term holders are capitulating in real time: the LTH/STH SOPR ratio sits at 0.8, inside a band that’s historically marked capitulation-adjacent lows, while STH losses to exchanges run about $3.5B a day.
Whales aren’t selling: wallets holding 100+ BTC added roughly 54,400 BTC since mid-June, and BTC spot order flow still shows Big Whale Orders even as futures order sizes shrink.
Price is sandwiched between cost basis levels: BTC trades below both STH ($67.2K) and ETF ($71.4K) cost basis, but stays comfortably above the LTH floor near $49.3K.
Sector breadth is thin: just 4 of 24 sectors closed green, though Bitcoin and Ethereum were mid-pack, not the worst performers.
US demand is still missing: Coinbase has traded at a discount to global venues since spring, and stablecoin supply has slipped for a second straight month.
🎥 YouTube: Onchain_Insights - English | IT Tech PL - Polish | Hub: btc-analysis.com
I share structured trade ideas for Bitcoin and Ethereum aligned with the on-chain framework used in this report. Access is free via one of the partner exchanges. Both exchanges are regulated in the European Union.
Bybit.eu 🇪🇺 EU users (EEA) - claim up to 40 USD 🎁 in BTC
OKX.com - MiCA and MiFID II licenses - Spot and derivatives trading in the EU 🇪🇺
*Disclaimer: Educational content only. Not investment advice. Past performance does not guarantee future results.
ETF outflows and stalled regulation outweighed a quiet inflation print this week, keeping Bitcoin on the back foot.
Spot Bitcoin ETFs flip from $865.3M in inflows to consecutive outflows, including ~$192M redeemed over two sessions mid-week; BTC fell from ~$65,200 to the low $63,000s. ETF creations and redemptions move spot BTC directly, making this the week's clearest price driver.
July CPI (Consumer Price Index, the main US inflation gauge) lands in line at 0.1% MoM / 3.4% YoY, core 2.5%; BTC barely moved, holding near $64,000. The muted reaction shows ETF flows and positioning currently override rate-cut expectations.
SEC pulls its “Regulation Crypto” meeting with no new date set, delaying its first dedicated crypto rulemaking effort. Extends the wait for regulatory clarity and weighed on tokenization-linked stocks.
Clarity Act market-structure bill pushed past the August recess, with a vote now eyed for mid-September at the earliest. Mostly priced in, but keeps regulatory overhang in place for institutional allocators.
Strategy sells another 1,690 BTC (~$109M) between August 3-9 to fund dividends and rebuild USD reserves, taking 2026 sales past 6,900 BTC. The largest corporate holder turning net seller removes a structural bid.
Whales keep buying while smaller holders sell: wallets holding 100+ BTC added ~54,400 BTC since mid-June, while SOPR (Spent Output Profit Ratio - whether coins move at a profit or loss) stays soft. Constructive medium-term, but hasn't offset this week's ETF outflows.
Tudor and UBS raise IBIT exposure: Tudor’s Q2 stake rose ~19% to 688,529 shares, UBS’s call-option exposure jumped more than 24-fold to ~1.95M shares. These 13F filings (quarterly institutional holdings disclosures) show long-term interest holding up even as short-term flows reversed.
Cooler PPI (Producer Price Index, wholesale inflation) doesn’t lift crypto: the S&P 500 and Nasdaq hit fresh records while BTC and major altcoins lagged. BTC is trading on its own flows and headlines, not broader risk sentiment.
Tokenization narrative stalls alongside the SEC delay, and tokenization-linked equities underperformed. Removes a growth story that had supported sentiment earlier in the year.
Background macro stayed neutral to mildly supportive: soft July payrolls (-23K) kept cut odds contained, gold held firm, energy-route tensions eased. None of it offset the ETF reversal or regulatory delays.
💬 Comment
ETF flow mechanics drove this week's price action, not the macro calendar. Weekly inflows of $865.3M flipped to consecutive outflows within days, dragging BTC from the mid-$65,000s to the low $63,000s. Soft CPI and PPI prints barely moved the price, which says more about where the marginal buyer sits right now than about the inflation trend. Whale wallets kept adding supply while smaller holders sold into weakness, and Tudor and UBS both grew their IBIT exposure through the same window. Until ETF flows turn positive again, redemptions stay the more reliable price driver than any single data print.
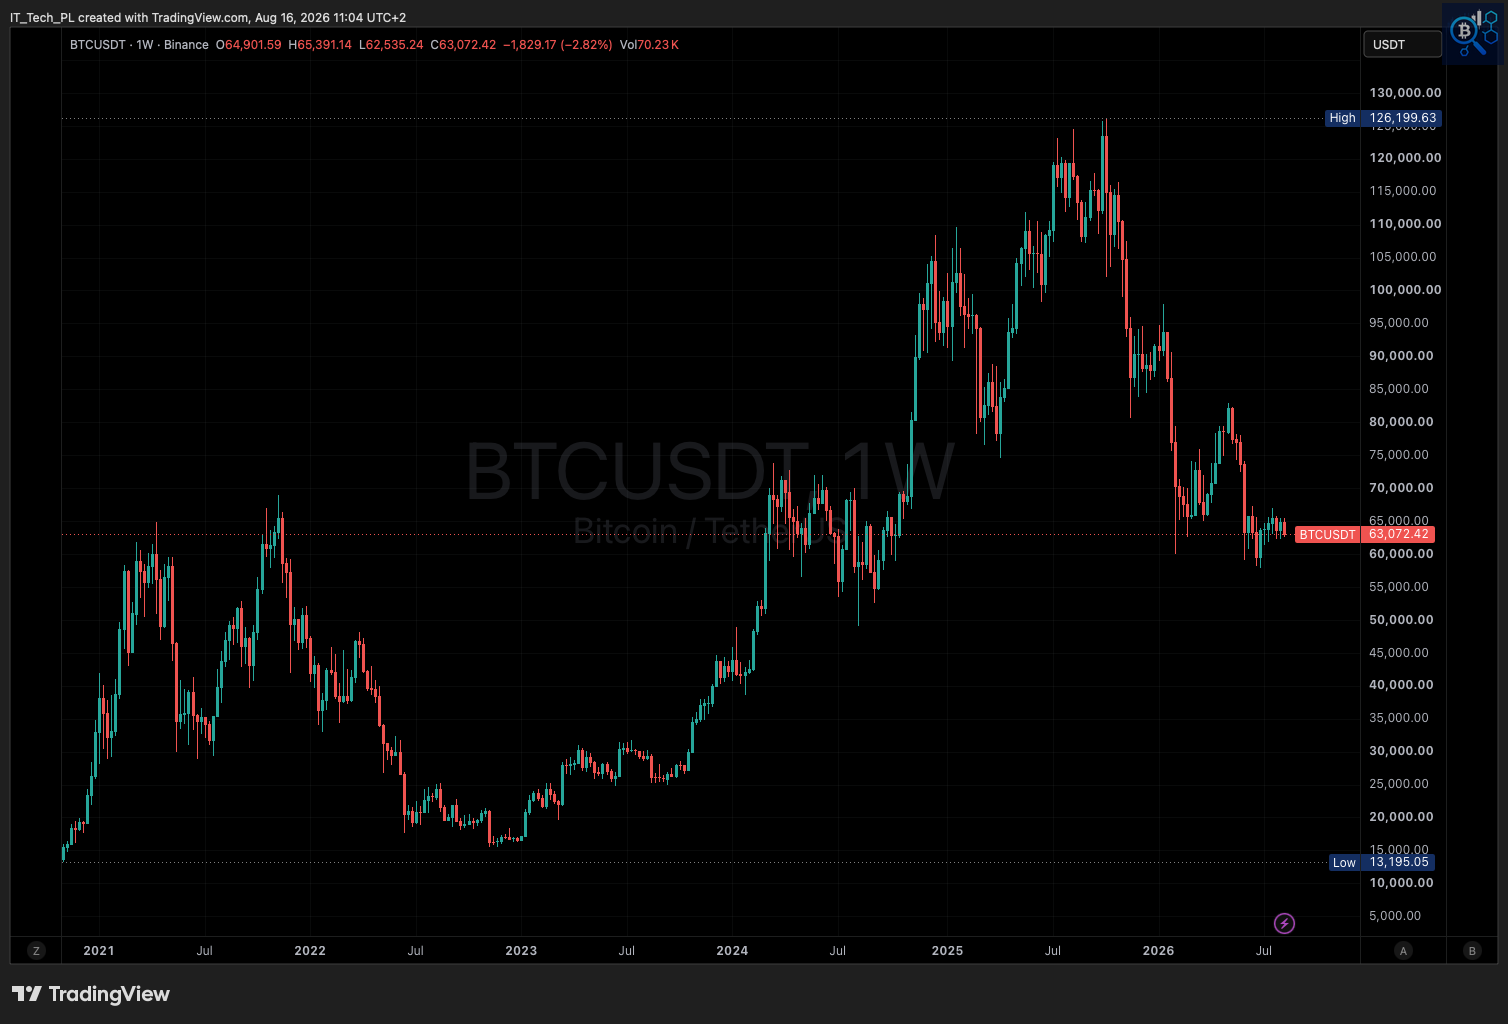
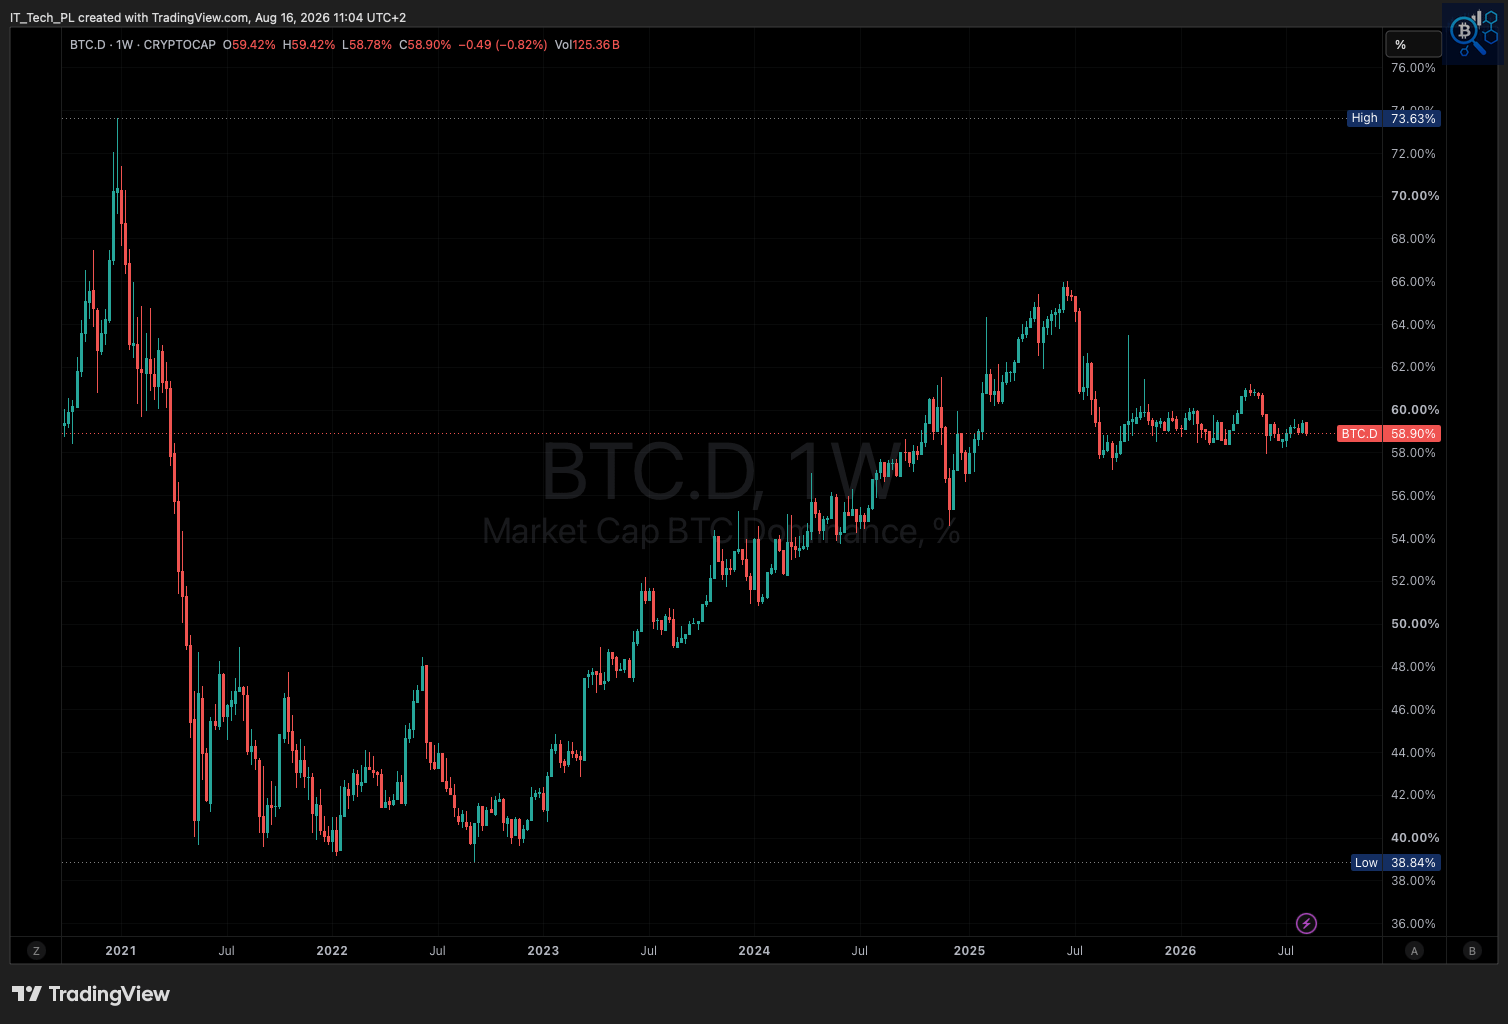
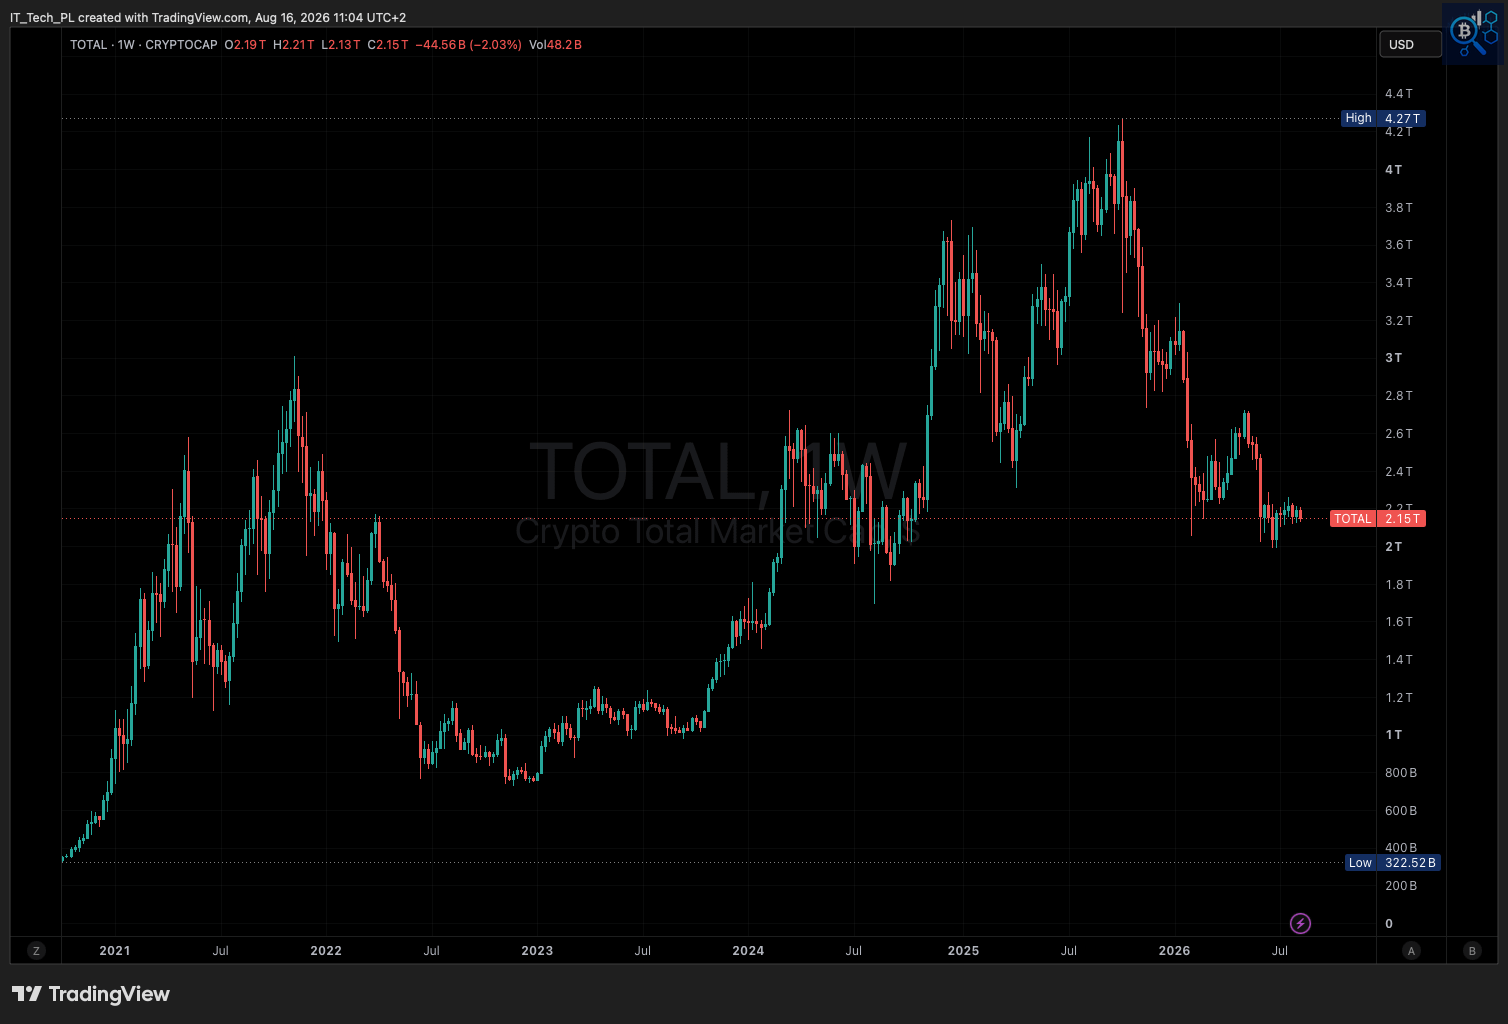
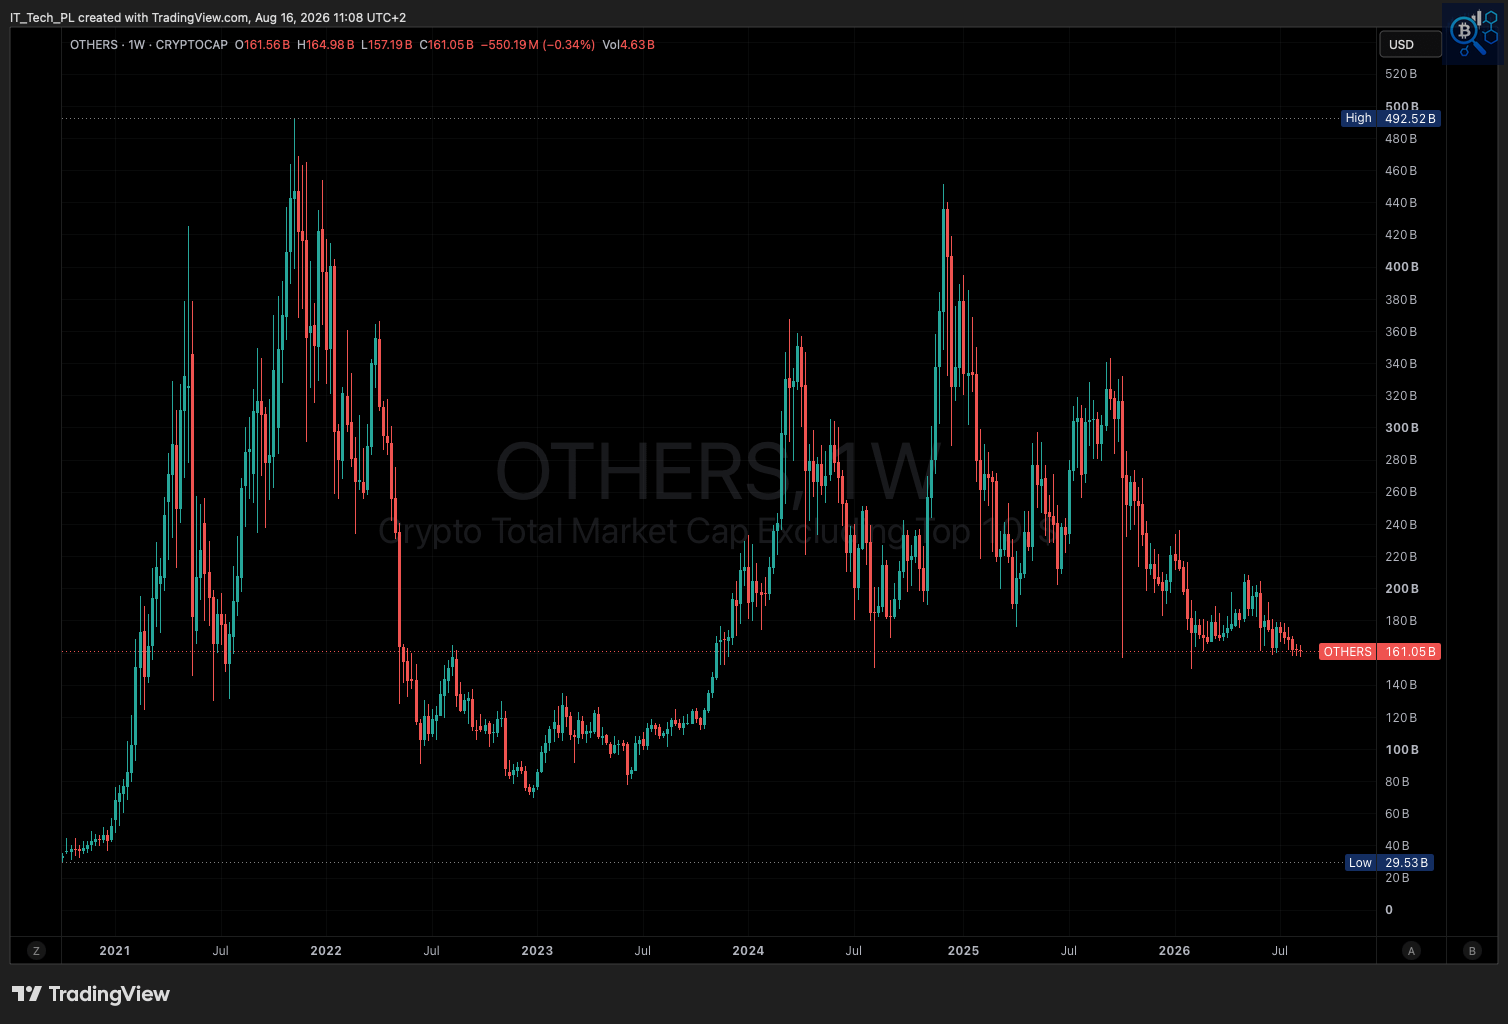
Bitcoin absorbed this week's losses alone, while alts barely moved.
Current state:
BTC: $63,072, down 2.82% this week (range $62,535-$65,391), at the time of writing (Sunday)
BTC.D (Bitcoin’s share of total crypto market cap): 58.90%, down 0.82% this week
TOTAL (total crypto market capitalization): $2.15T, down 2.03% this week (-$44.56B)
OTHERS (market cap excluding the top 10 coins by market cap): $161.05B, down 0.34% this week
Key levels:
BTC: mid-$63,000s - the same zone that capped price through most of 2024, now being retested from above for the first time since the breakout
TOTAL / OTHERS: same setup, retesting the $2.15T and $160B-165B zones from above
BTC.D: holding the 58%-60% range intact since Q2 2026
💬 Comment
The week’s decline is concentrated in BTC, not spread across the market. BTC fell 2.82% to $63,072 while OTHERS (market cap excluding the top 10 coins) slipped just 0.34%, and that gap is why BTC.D (Bitcoin’s share of total market cap) eased to 58.90% from 59.42%. Three of the four metrics above are testing the same zone from the same side at the same time, a rare alignment. Until it breaks on a weekly close, this reads as a retest of prior structure, not a new leg down.
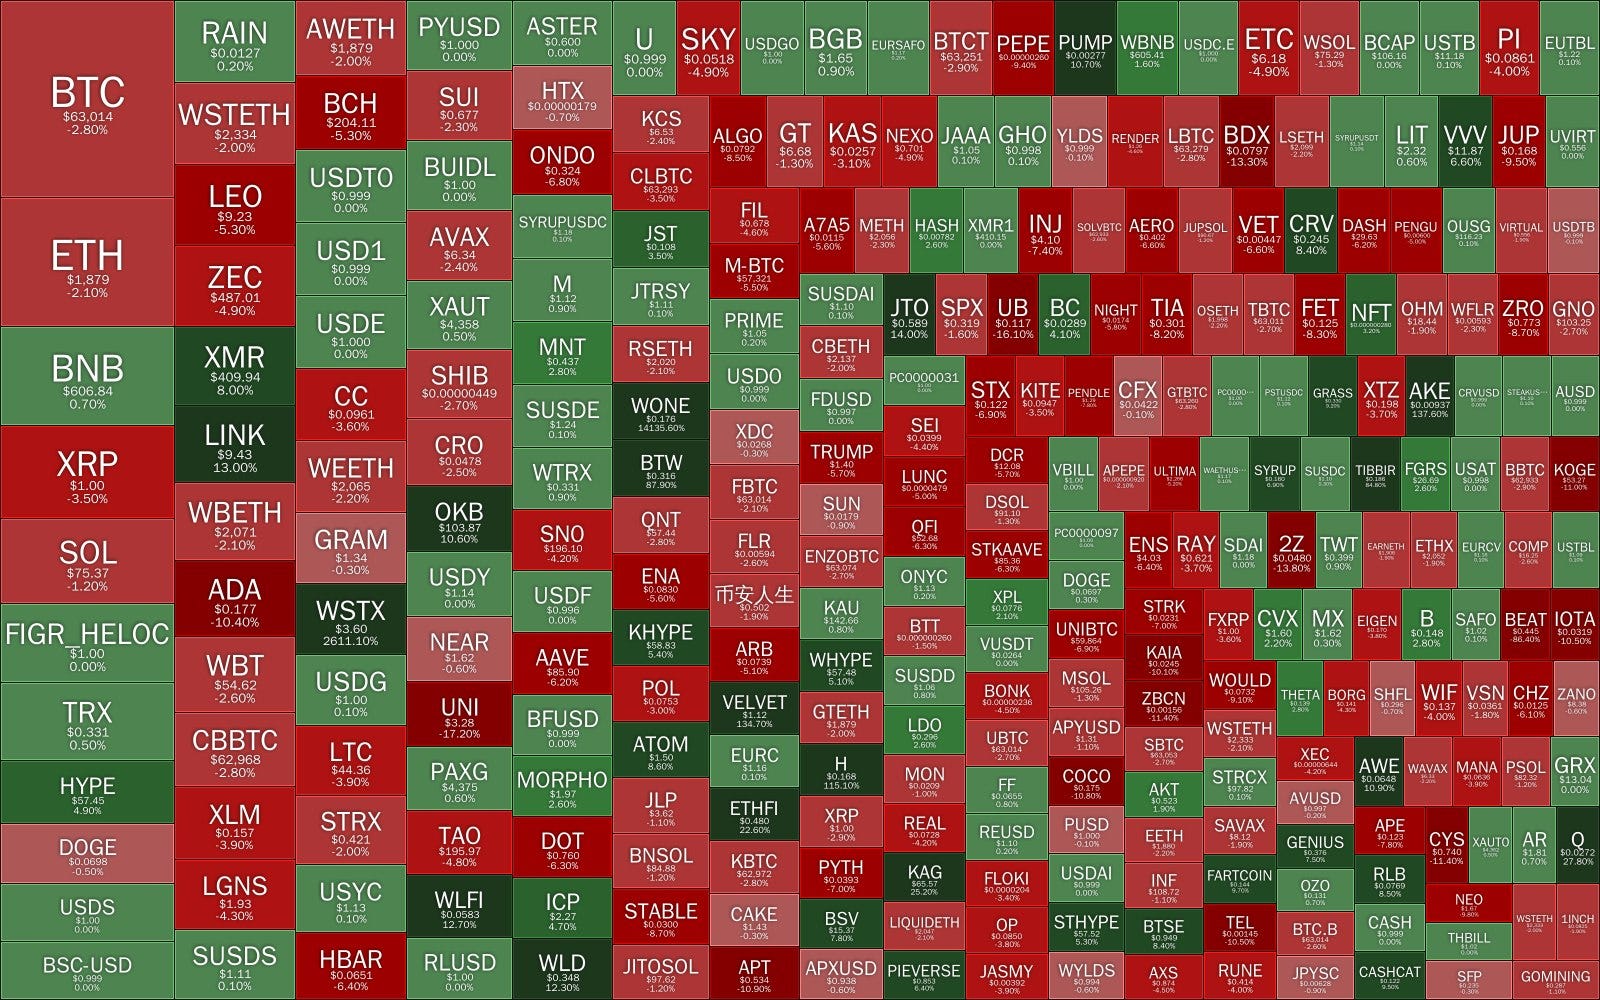
Current state:
Broad market: mostly red, with BTC, ETH, XRP, and SOL all down 1%-4% on the week
Biggest gainers: WSTX (+2,611%, thin-liquidity outlier), KAG (+25.20%), JTO (+14.00%)
Biggest losers: UNI (-17.20%), UB (-16.10%), TWT (-13.80%), BDX (-13.30%)
💬 Comment
WSTX’s 2,611% move and UNI’s 17.20% drop are noise from thin-liquidity names, not anything that changes the broader picture. Strip those out and the picture matches Section 3: majority red, with BTC, ETH, XRP, and SOL all down for the week. Until breadth actually flips toward more green than red, this stays a BTC-led decline, not a market-wide one.
I built a free on-chain dashboard on CryptoQuant. Bitcoin macro metrics, NUPL, SOPR, STH cost basis, exchange flows, and much more - all in one place. No noise. Just the data I actually track.
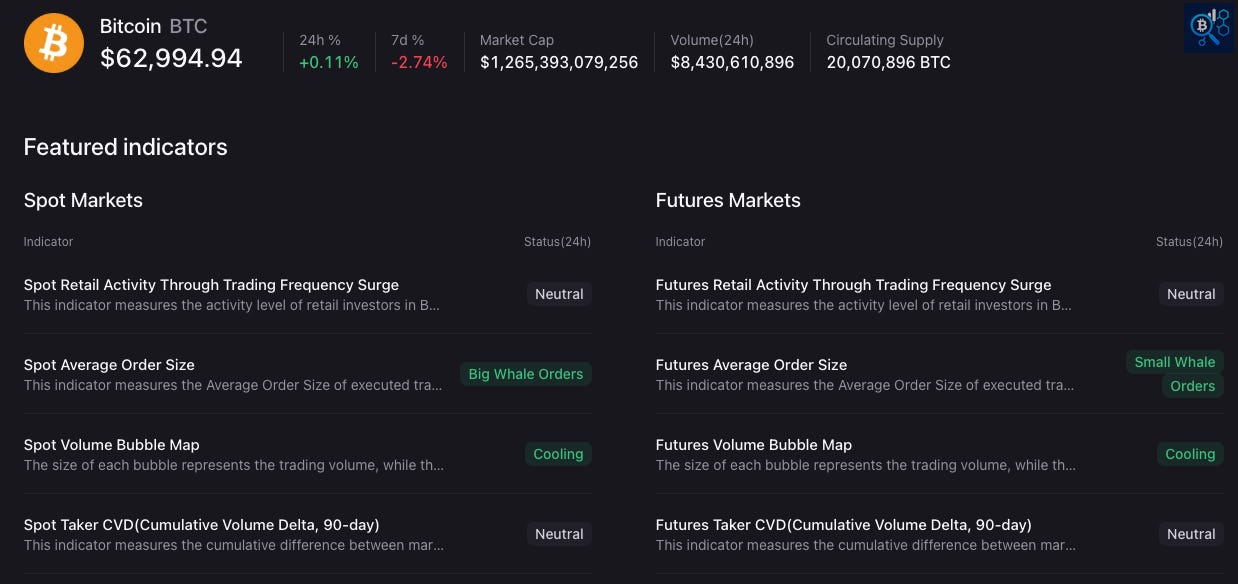
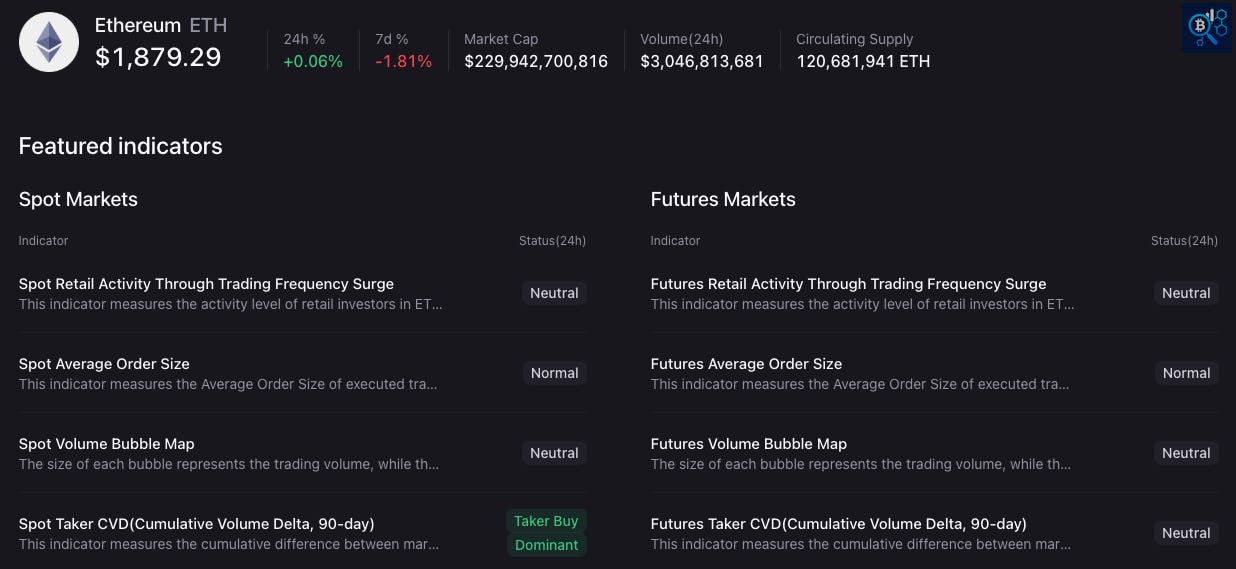
Spot order sizes point to whale buying in Bitcoin while futures activity stays retail-sized.
Current state:
BTC: $62,994.94 (-2.74% 7d) - spot shows Big Whale Orders with Cooling volume, futures shows Small Whale Orders with Cooling volume; CVD (Cumulative Volume Delta - buy vs. sell order imbalance) reads Neutral on both spot and futures
ETH: $1,879.29 (-1.81% 7d) - spot CVD (Cumulative Volume Delta - buy vs. sell order imbalance) reads Taker Buy Dominant, futures CVD reads Neutral; order sizes and retail activity read Normal/Neutral across both spot and futures
💬 Comment
BTC's order-size split shows large trades dominating spot activity while futures stays sized more like retail flow, which is consistent with the whale accumulation already flagged in Section 2, where wallets holding 100+ BTC added about 54,400 BTC since mid-June - though order size on its own is a composition signal, not independent confirmation of net positioning. ETH doesn't show the same skew, but its spot CVD reads Taker Buy Dominant even with price down 1.81% for the week, a mild divergence between price and order flow. Until BTC futures order sizes pick up too, this stays a spot-led signal rather than confirmed leveraged demand.
Found this article useful? Leave a like 💙, drop a comment, and share it with someone 🤝
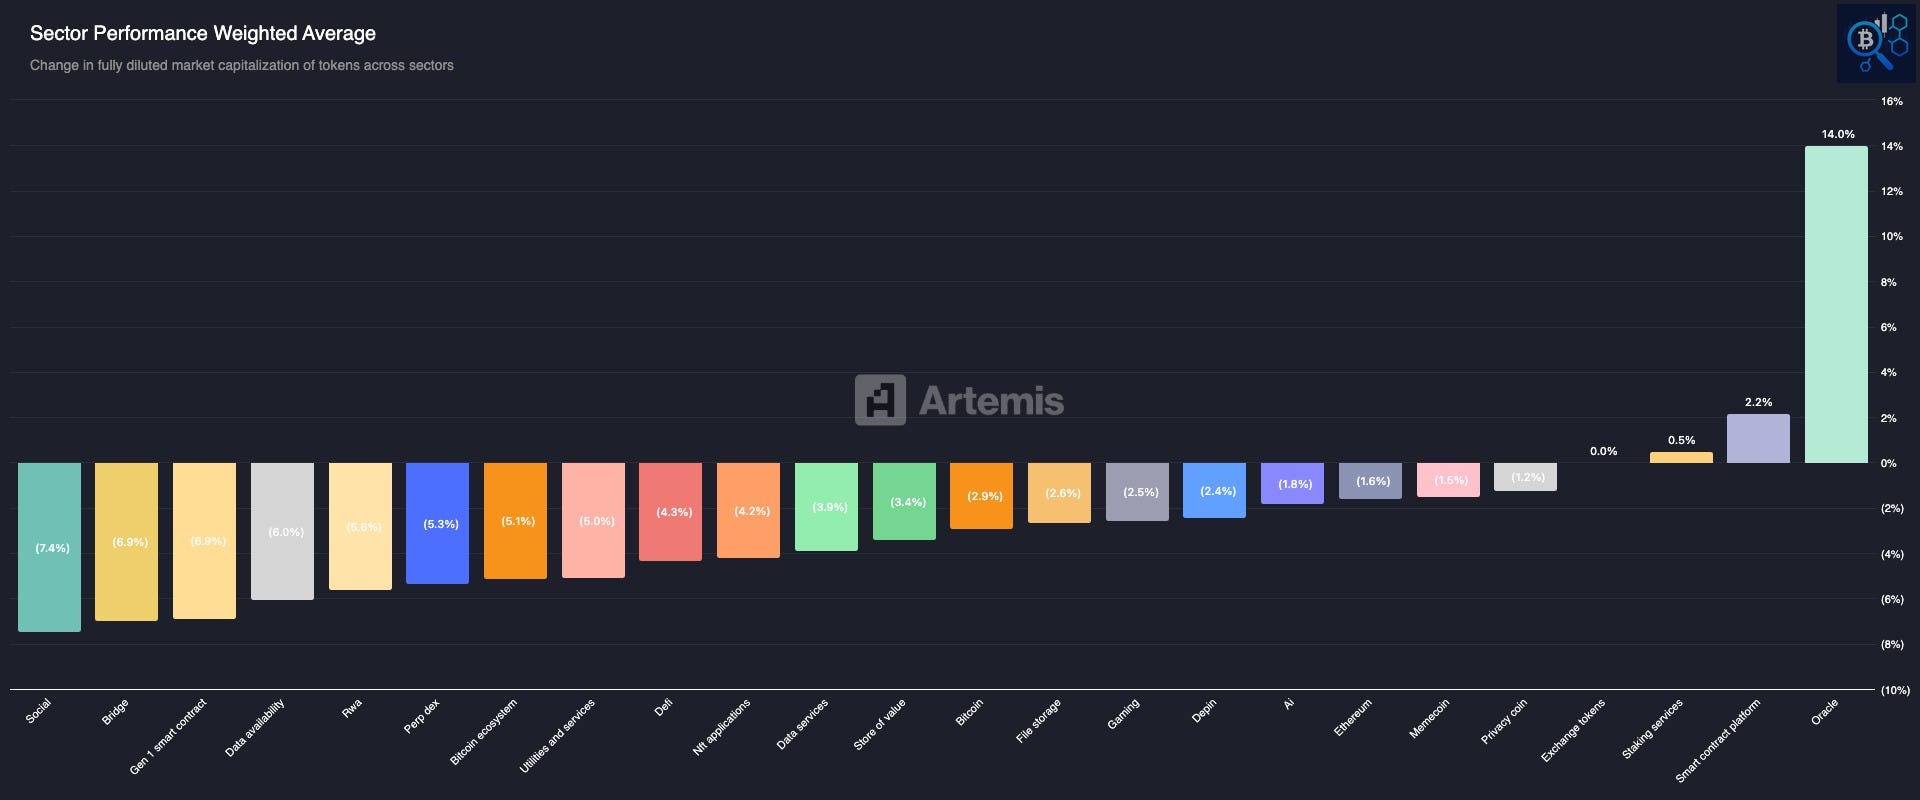
Sector Performance – Weighted Average, last 7 days
(Change in fully diluted market cap by sector, weighted by token size)
Bitcoin and Ethereum are sitting mid-pack while breadth across the rest of the market is deep red.
Current state:
4 of 24 sectors positive this week, 20 negative
Biggest gainer: Oracle (+14.03%)
Biggest loser: Social (-7.44%)
Bitcoin: -2.87%, Ethereum: -1.57%
💬 Comment
Breadth is worse than the headline market-cap numbers suggest. Only Exchange Tokens, Staking Services, Smart Contract Platform, and Oracle closed green, and Oracle’s 14.03% gain is doing most of the lifting for that short list. Bitcoin (-2.87%) and Ethereum (-1.57%) sit in the middle of the pack, not even among the worst performers - Social (-7.44%), Bridge (-6.93%), and Gen 1 Smart Contract (-6.86%) took the deepest cuts. Until more than a handful of sectors turn green at once, this reads as a market still working through a broad correction rather than rotating into strength somewhere new.
🔐 Premium Insights
Everything above is free. Everything below - cost basis levels, holder behavior, futures demand, ETF and stablecoin flows - is for paid subscribers only.
Comments
Nothing yet. Say the first thing.
Sign in to join the conversation.