
Welcome to The Long and the Short — a show where you can expect an honest take on trading, something you won’t hear elsewhere.
Welcome back to Part 3 of the swing trading series.
In Part 1, we covered what swing trading actually is, where the word comes from, and the seven different ways to identify a swing. In Part 2, we got into stock selection using two of those methods — finding the strongest stock inside the strongest sector, and the strongest category more broadly.
Since that edition went out, a lot of you wrote in saying you’d gotten the hang of that approach and wanted to know about the other methods mentioned back in Part 1. So today we’ll touch on that and walk through how to use some of those other methods specifically for stock selection.
But more importantly, we’ll cover a very simple systematic approach to select stocks and rebalance them as you go. Over the years, what I’ve realised is that more than stock selection — which is the easier part — what’s more important is timing the whole strategy of swing trading, and being systematic about allocation and exits. Once we have that framework in mind, it becomes a lot easier to swing trade systematically over the long run.
The examples and ideas shared here are strictly for educational and illustrative purposes only. Nothing discussed should be construed as a recommendation, investment advice, or a solicitation to trade. Trading in stocks and derivatives involves significant risk and can result in complete loss of capital.
Before anything else, something of fundamental importance — when it comes to swing trading, or any trend trading for that matter.
When I started trading, a lot of articles and books said: “be in sync with the market.” As a novice, that whole idea of being in sync didn’t make sense to me at all. No one told me what being in sync actually means. It was only much later that I realised the meaning and the value of it.
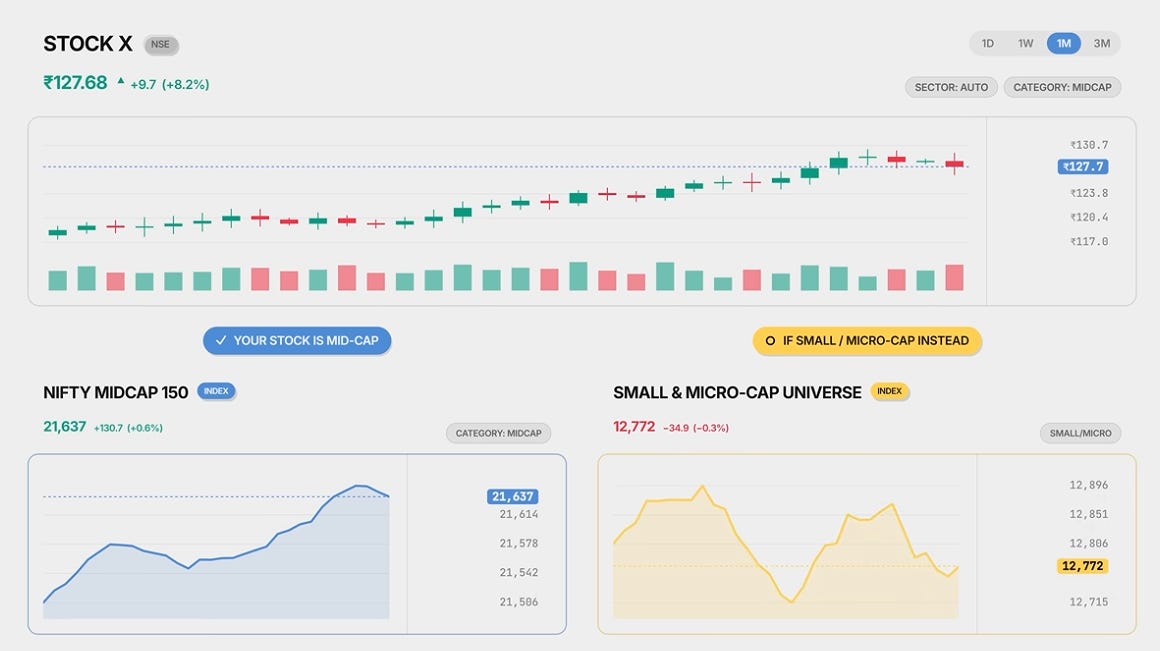
Especially when swing trading stocks, it’s important to look at what the underlying market is doing, and what the underlying universe of that particular stock is doing. If the stock is a mid-cap, it’s good to see what an index like Midcap 150 is doing. If it’s a small-cap or micro-cap, look at what the collective of small and micro-caps are doing.
Have some kind of a trend filter on it, so that you don’t trade when the larger trend in that category is negative. For instance, on a daily timeframe, something like a 21-day or 50-day moving average works well. If the index goes below that, don’t do swing trading — because the odds of trends forming in any of the underlying stocks are low in such an environment.
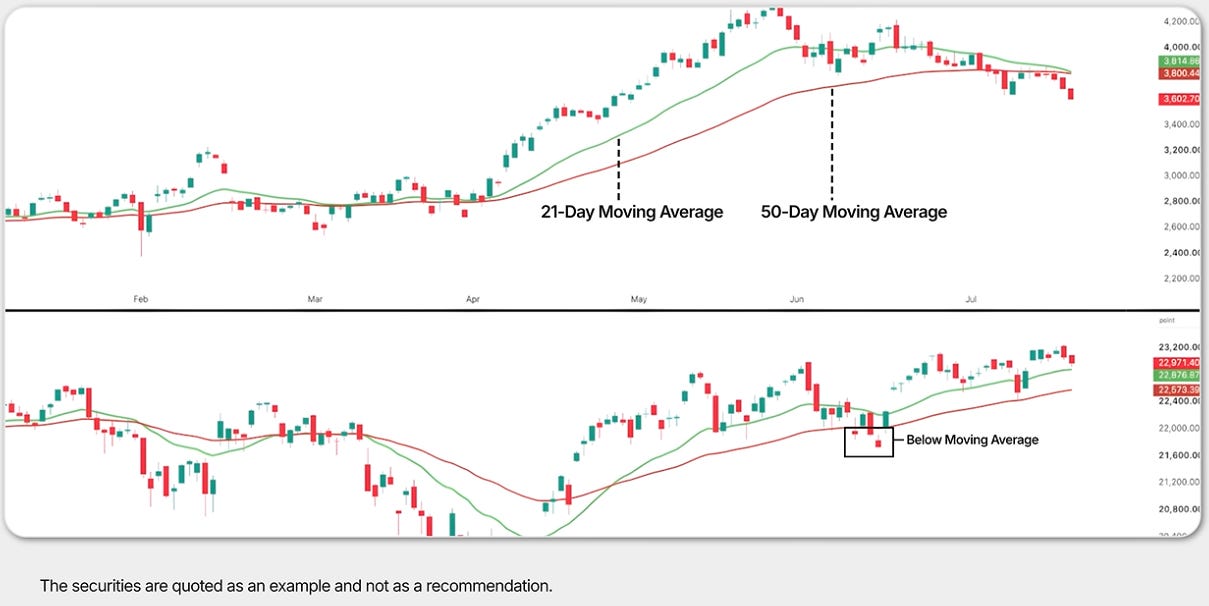
It’s pretty much like they say: a rising tide lifts all boats. And that’s exactly what we want — a rising tide, so that we can be with it on the right boats.
Now let’s look at how to actually identify swings on a chart — specifically the methods 1 through 5 from Part 1.
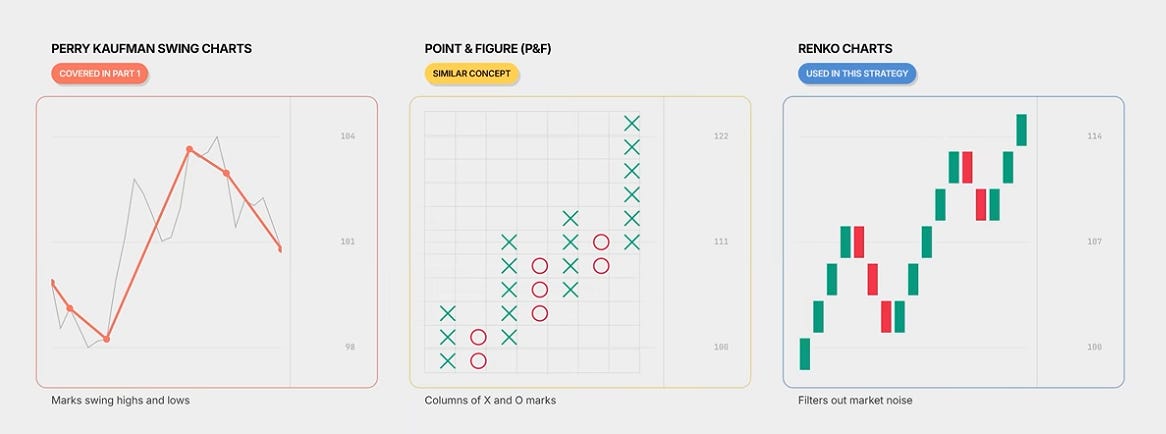
In Part 1, I started with Perry Kaufman’s swing charts, which are conceptually similar to Point and Figure charting. For our strategy, we’ll use Renko charts — far easier to understand, and they serve the exact same purpose of filtering out market noise.
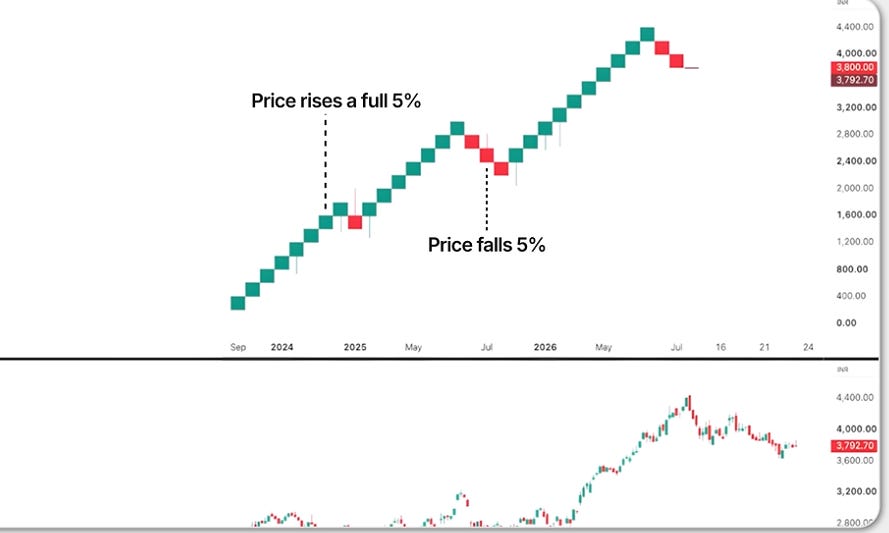
With Renko brick size set to 5%, a new green block only prints when the price rises a full 5% from the previous block. Similarly, a red down-trending block won’t form until the price falls 5% below the previous close. Because Renko only cares about price movement, it completely compresses time — it only prints when there is actual progress, compressing years of sideways action into a tiny, clean space.
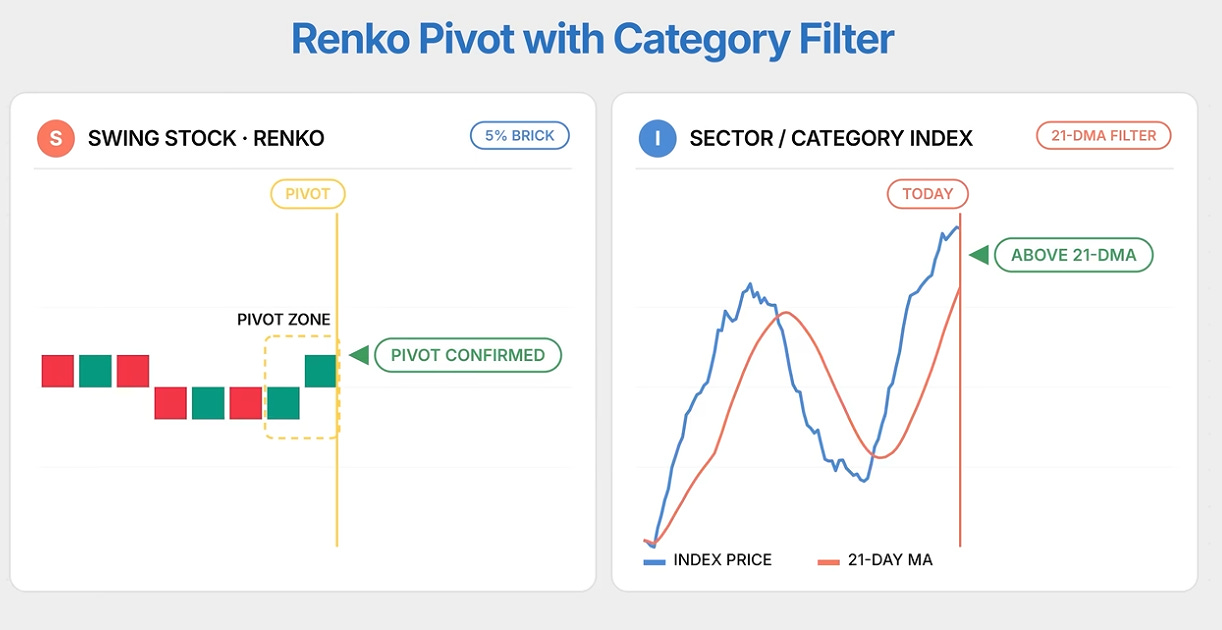
As a general framework, wait for a green block to form — or ideally two, to confirm the pivot — before making an entry. Simultaneously, run your category filter: make sure the stock’s broader sector or market-cap index is trading above its 21-day moving average. Don’t treat these specific parameters as rules carved in stone — they’re a reliable, structured framework to ensure you’re entering a stock only when both its immediate swing and its broader universe have a strong tailwind.
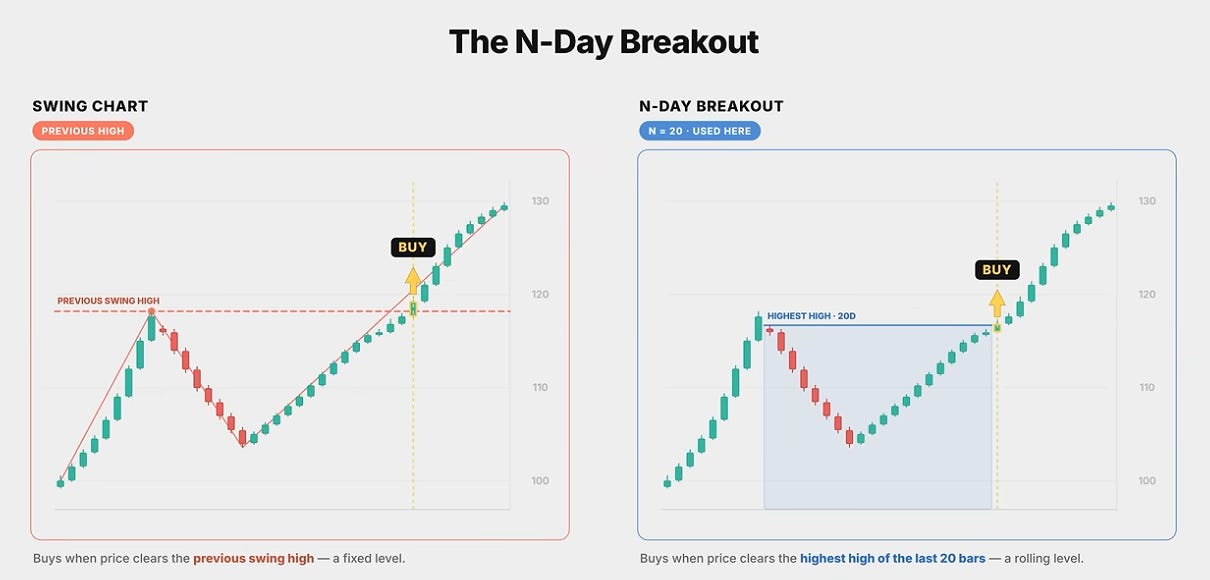
You can use any lookback period that fits your style, though 7, 15, or 21 days are common standards. The logic is intuitive: the system tracks the highest high and the lowest low of the last N days. If the price closes above the highest high of that period, you have a valid bullish breakout.
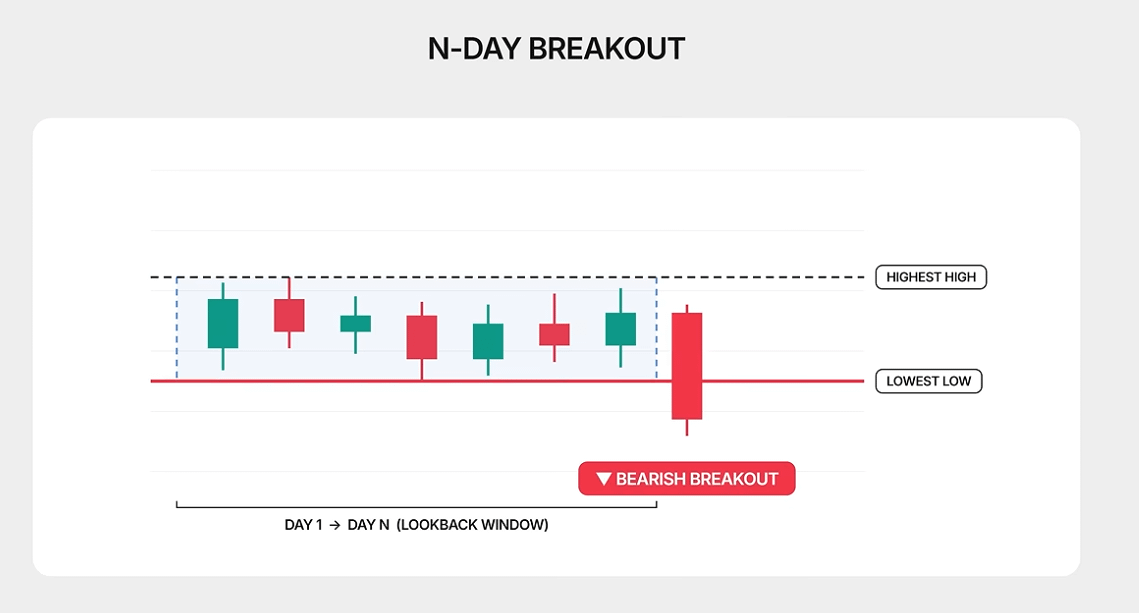
If it breaks below the lowest low, it’s a bearish breakout. There are dozens of free, built-in indicators on TradingView that identify this for you — just plug in your preferred lookback number.
Remember the golden rule: an N-day breakout is simply your entry trigger. You only pull the trigger if the stock’s broader market sector or category index is aligned and showing a strong tailwind.
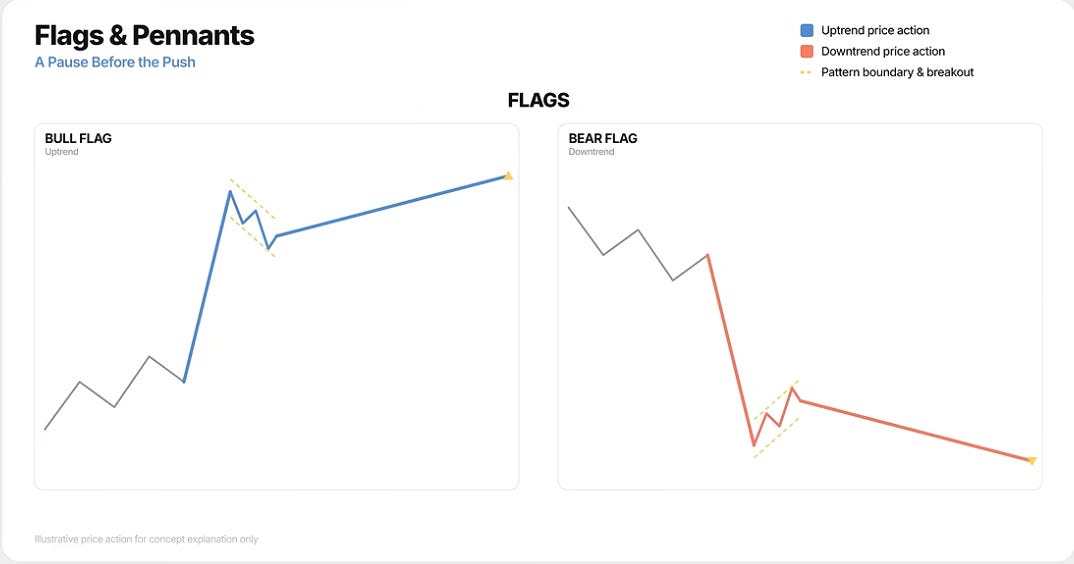
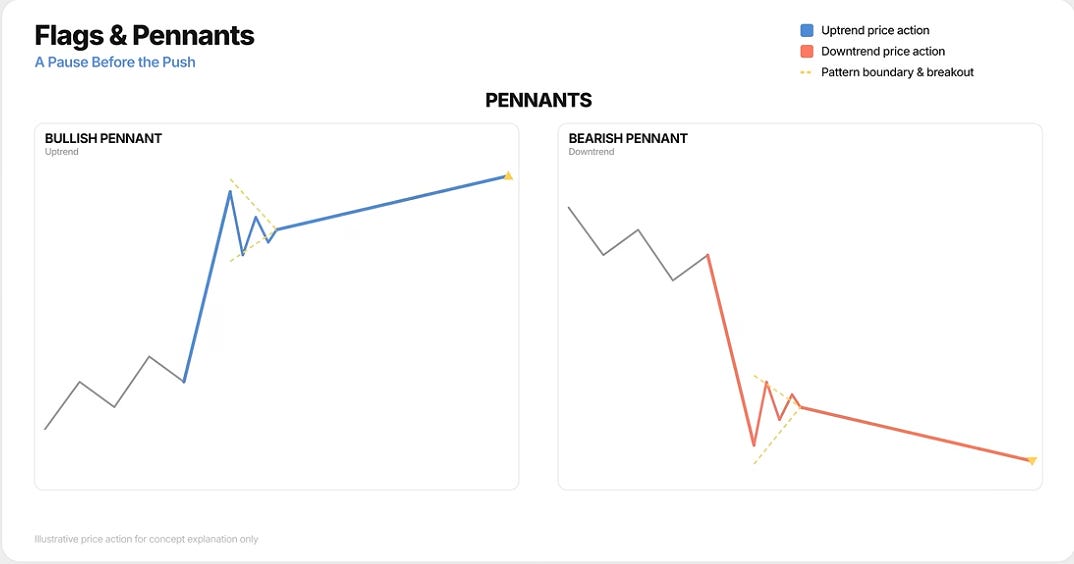
While these are traditional price patterns, you don’t necessarily have to spot them manually. TradingView has built-in indicators that can automatically detect and plot them on your chart. You can adjust the settings to quantify what counts as a flag or pennant for you.
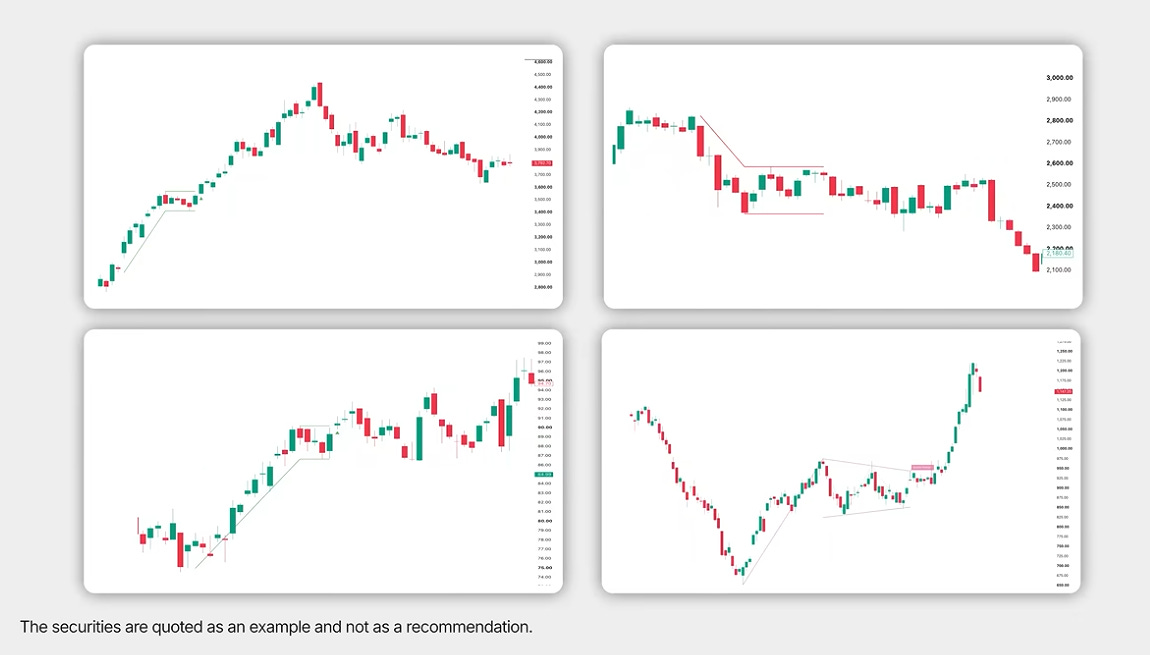
The trading logic is pure breakout trading: a close above the upper boundary of the flag or pennant triggers a long entry, while a close below the lower boundary indicates a short. The system identifies both bullish and bearish variations. And the same rule applies here — a flag or pennant breakout is simply your localised entry trigger. You only take the trade if the broader breadth of the sector or market-cap category is fully aligned and moving in your favour.
Now, let’s move to a systematic portfolio approach — which means position sizing and diversification.
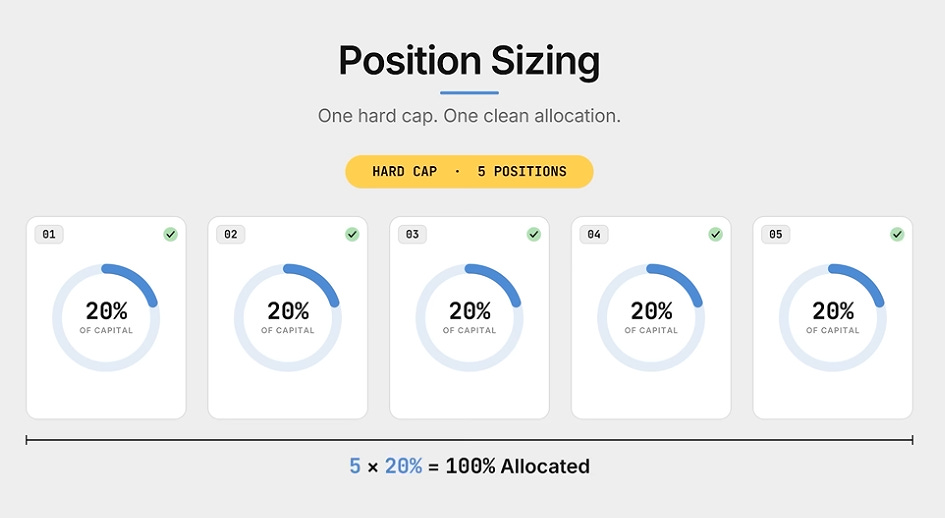
At a broad level, the strategy is this. Maintain a hard cap of five concurrent open positions at any given time — while you can scale to ten, using five means a clean 20% capital allocation per trade.
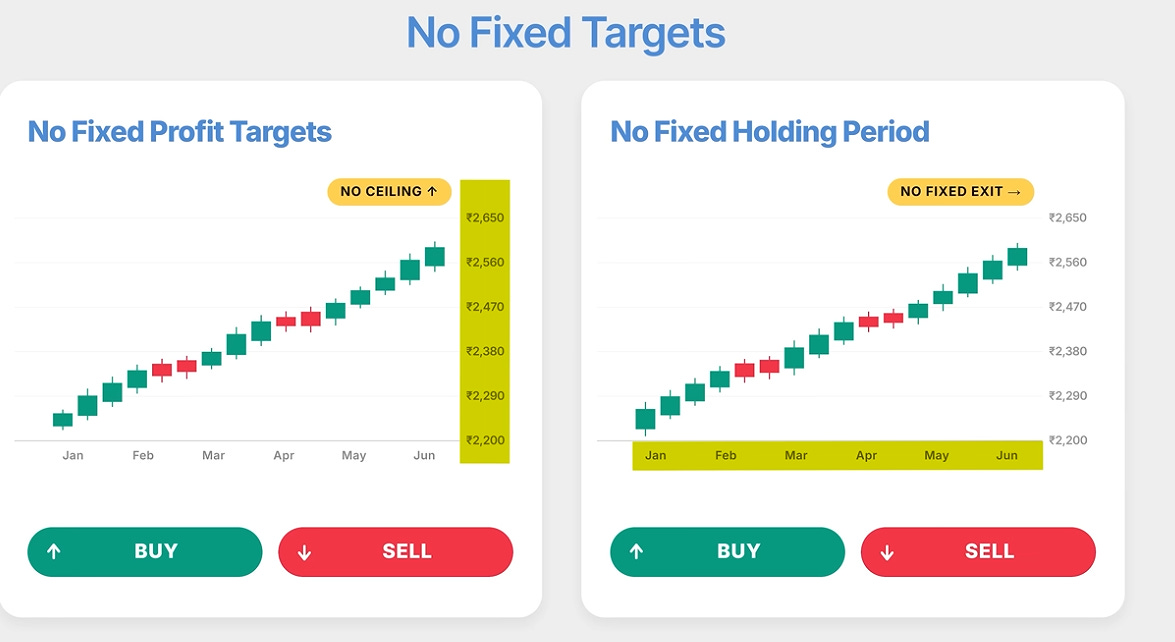
You then operate on a strict “one in, one out” rule: if your portfolio is full, you cannot add new trades. The moment an existing stock hits its exit trigger and frees up capital, you run your scan to find the single strongest candidate to fill that empty slot. Each position is managed by its own independent trailing stop or exit logic — no fixed profit targets and no fixed holding periods. Simply let the trend run until the trailing mechanism tells you it’s time to exit.
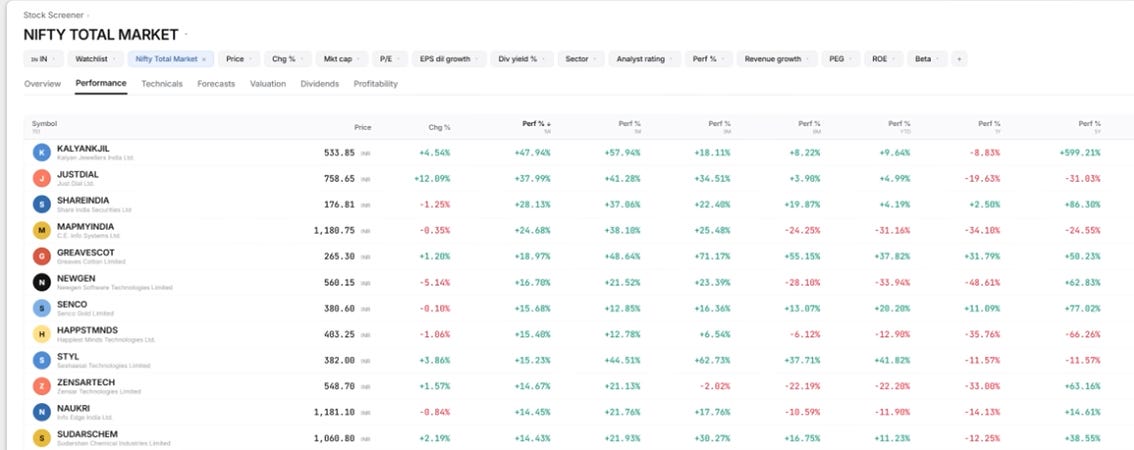
To execute this, a TradingView scanner with a simple percentage-change rule works well. Look at the top-performing stocks over the past one-week period, and the scanner automatically ranks them by relative strength. That becomes your core basket. From there, you can choose to double-click on individual names to identify specific technical patterns — or simply take the top-performing ones as they are.
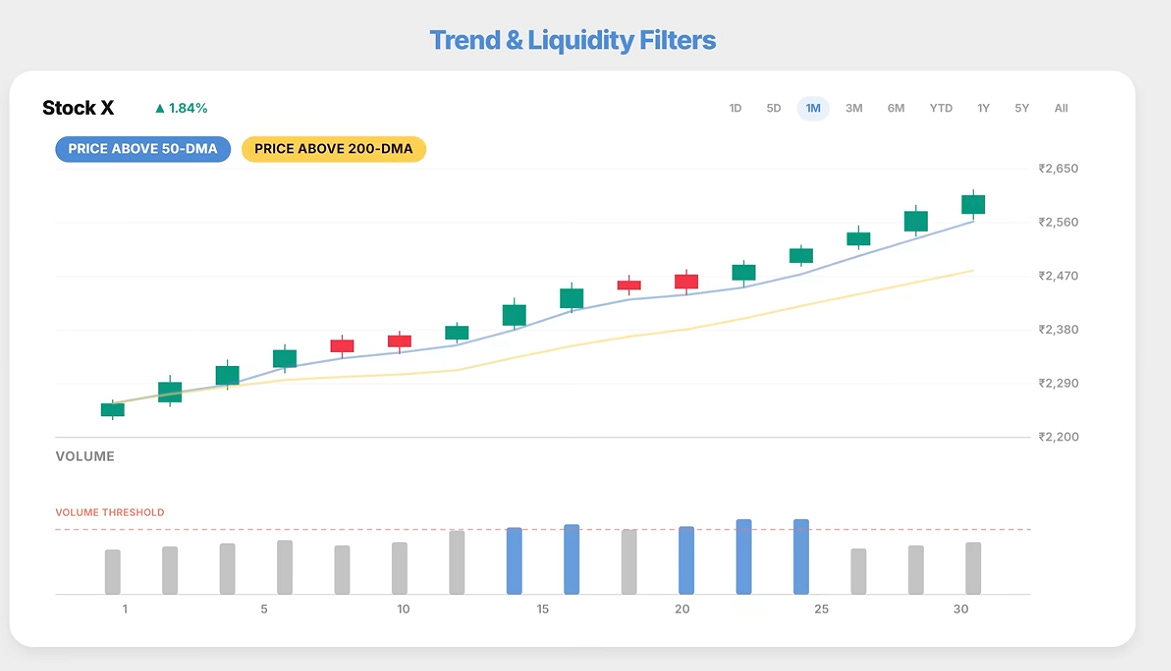
If you want to tighten the selection, layer on extra trend and liquidity filters, such as requiring the stock to be above its 200-day or 50-day moving average, or setting thresholds for average volume.
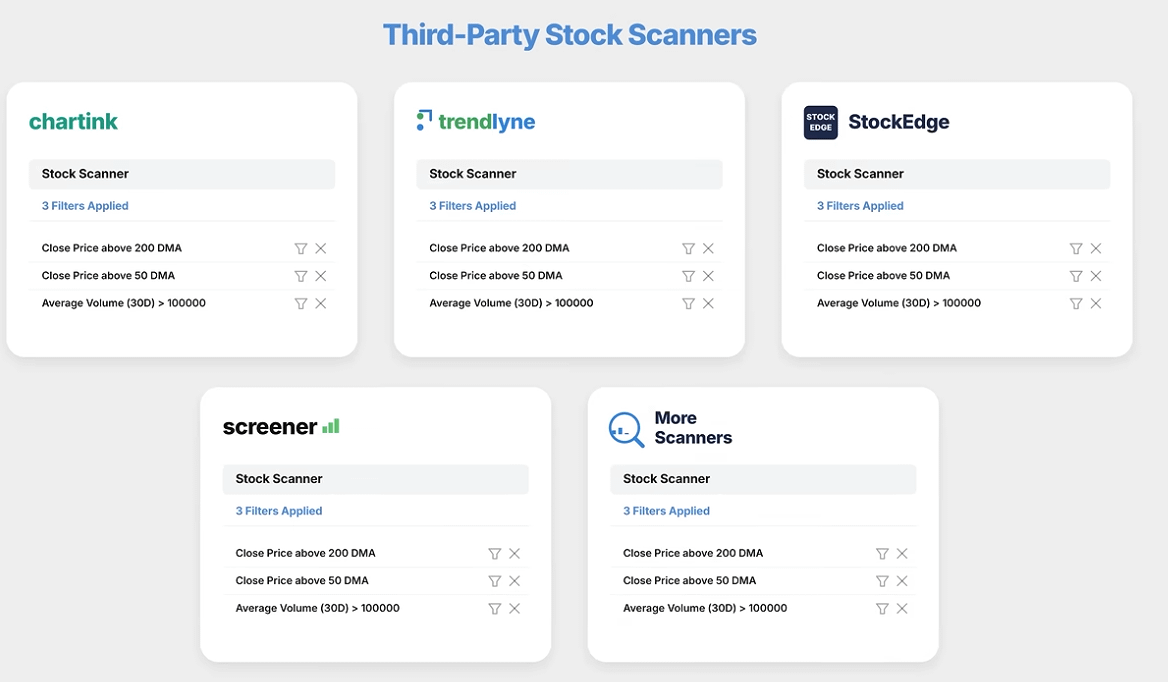
TradingView is one option, but there are plenty of great third-party scanning tools that can do the same job — what matters is sticking to the core method.
While this approach is systematic (relying on fixed criteria), you can absolutely add a layer of personal discretion to the final stock selection if you prefer. And if you don’t want discretion? You can execute it as a pure, rules-based system. Both approaches work fine. As always, this is a broader framework — tweak the lookback periods or moving averages to fit your style, but stick to the core principles.
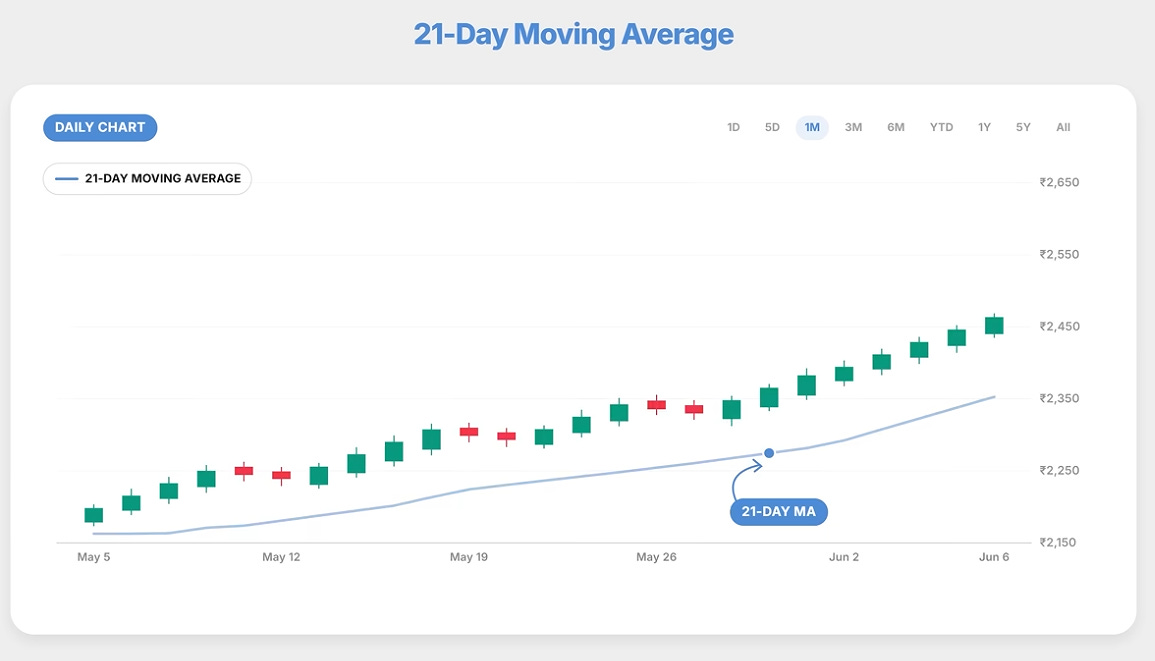
Method 1 — Moving Average. Done on the daily timeframe, use a 21-day moving average to give the trade breathing room, or tighten it with a 7-day or 9-day moving average if you want to trail closely. EMAs are preferable because they react much faster to recent price action.
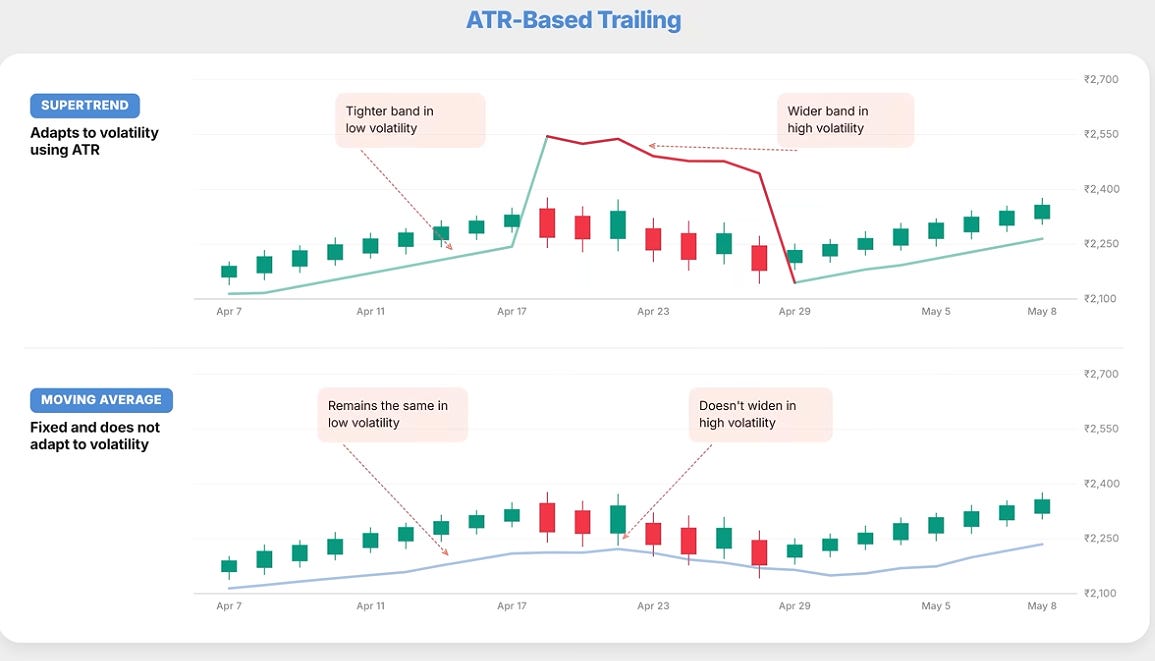
Method 2 — Supertrend. The main advantage is that Supertrend incorporates the Average True Range (ATR), meaning it dynamically adjusts for market volatility far better than a standard moving average does.
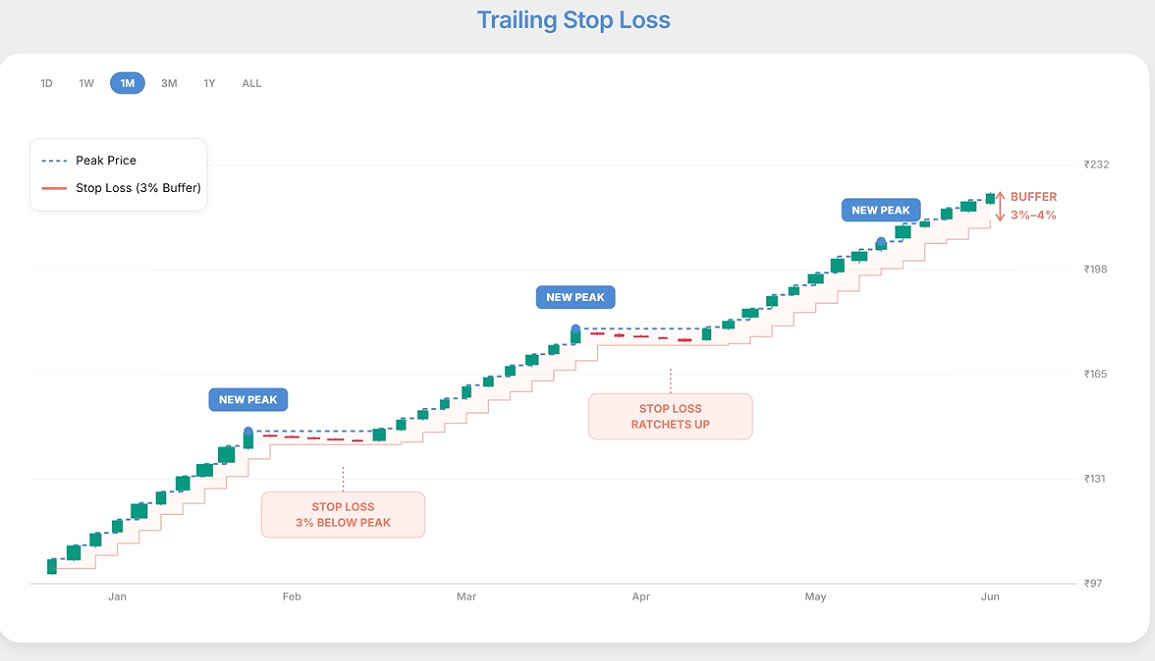
Method 3 — Fixed Trailing Percentage. As price climbs in your favour, your stop loss automatically ratchets upward, maintaining a strict buffer — say 3% or 4% — below the peak price. The moment it drops by that fixed percentage from its high, you exit.
The golden rule here is consistency: select one method that fits your risk tolerance and stick to it, rather than switching indicators mid-trade.
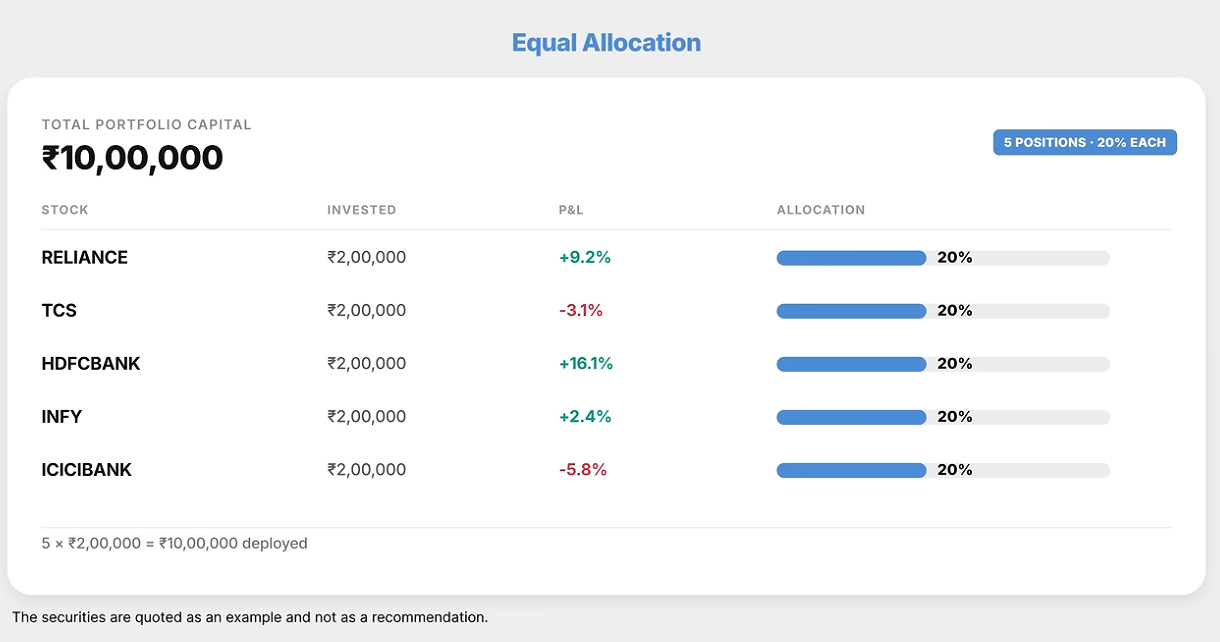
Equal Allocation. If your swing portfolio is capped at five stocks, deploy an identical 20% chunk of your total trading capital into each position.
Risk-Based Sizing. Because every entry setup has a predefined technical exit point, you can calculate the exact rupee distance to your stop loss before entering. From there, work backwards: if you only want to risk 1% of your total capital on a single trade, that stop-loss distance dictates exactly how many shares you’re allowed to buy.
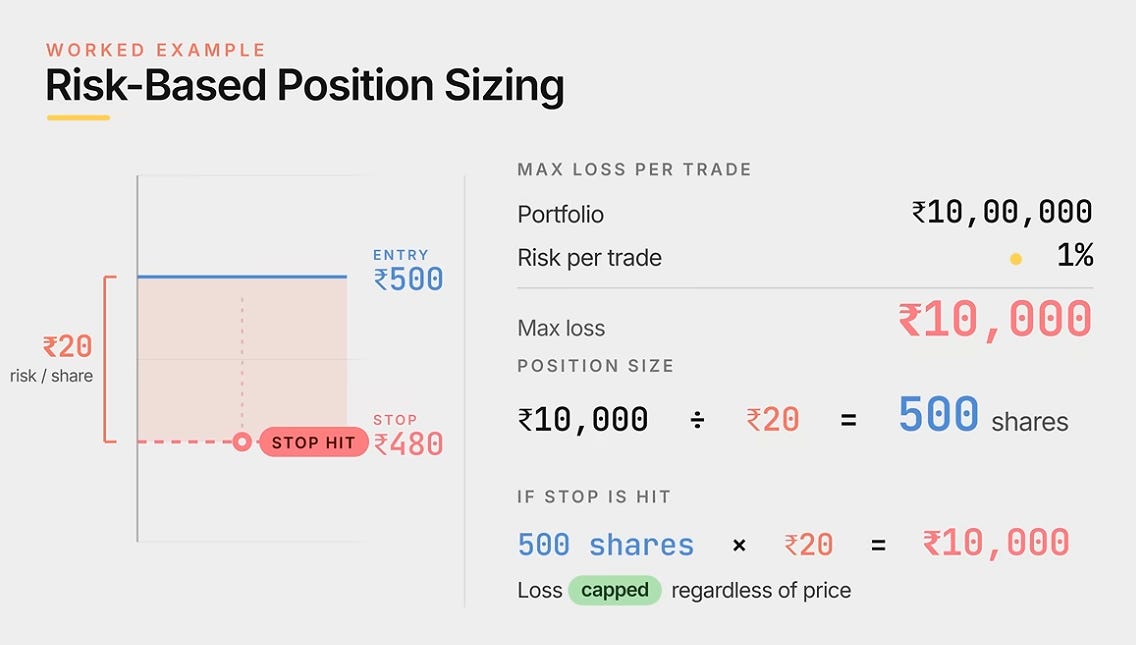
Example: ₹10 lakh portfolio, willing to risk 1% per trade = maximum loss of ₹10,000. Stock at ₹500 with a stop loss at ₹480 = ₹20 risk per share. Position size = ₹10,000 ÷ ₹20 = 500 shares. If the stop is hit, your loss is limited to ₹10,000, regardless of the stock’s price.
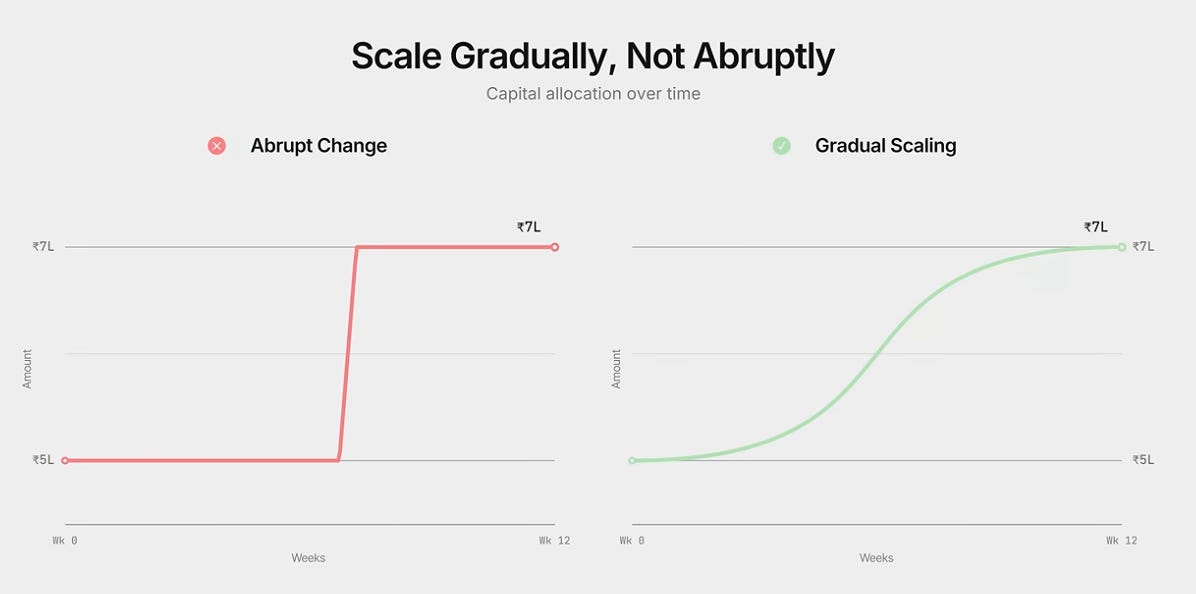
Capital discipline is absolute: never exceed the total capital pool dedicated to your swing trading system. Consistency in your baseline capital is what allows the math of a trading system to work. If you want to scale up, do it gradually as your account grows — not in abrupt jumps from one trade to the next.
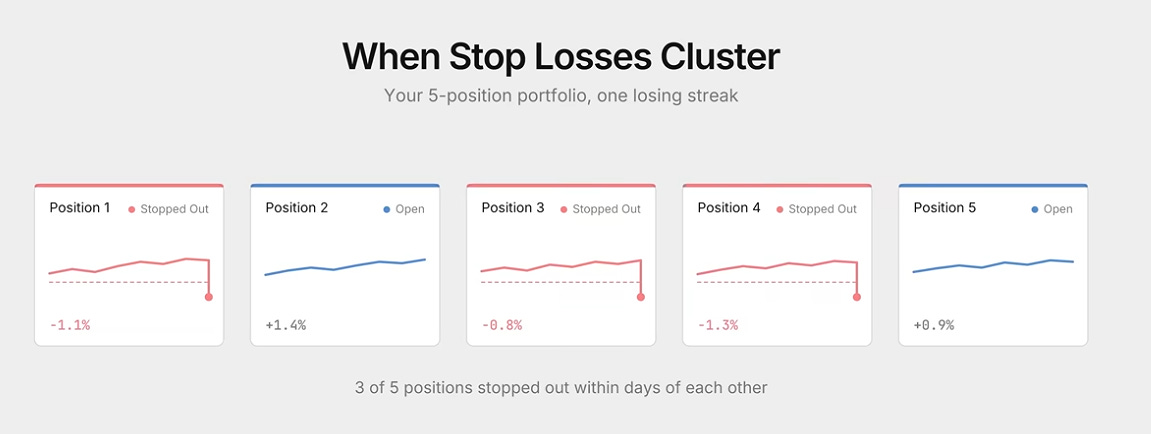
Also look for trades with a favourable risk-to-reward ratio — ideally at least 1:3. If you’re risking ₹1, you should have the potential to make ₹3 or more. Losing streaks are inevitable, and it’s not uncommon to have several stop losses hit around the same time. A high risk-to-reward ratio ensures a handful of winning trades can more than offset multiple small losses, keeping the strategy profitable over the long run.
One approach that rarely gets discussed in mainstream swing trading circles: swing trading a basket of ETFs rather than individual stocks.
Trading ETFs offers two major strategic advantages. First, they are inherently far less risky than individual stocks — they filter out single-company overnight risks and severe gap-downs. Second, they open up a universe of asset classes well beyond equities, allowing you to easily swing trade gold, silver, or even US index ETFs from your local account.
The beauty of this variation is that the entire system remains exactly the same. Entry methods, trailing exits, scanning routines, and allocation frameworks don’t change at all — you’re simply applying them to an ETF basket instead of a stock list.
This is a fantastic option worth exploring if you want smoother equity curves. A dedicated full-length episode on building an ETF swing system is on the roadmap.
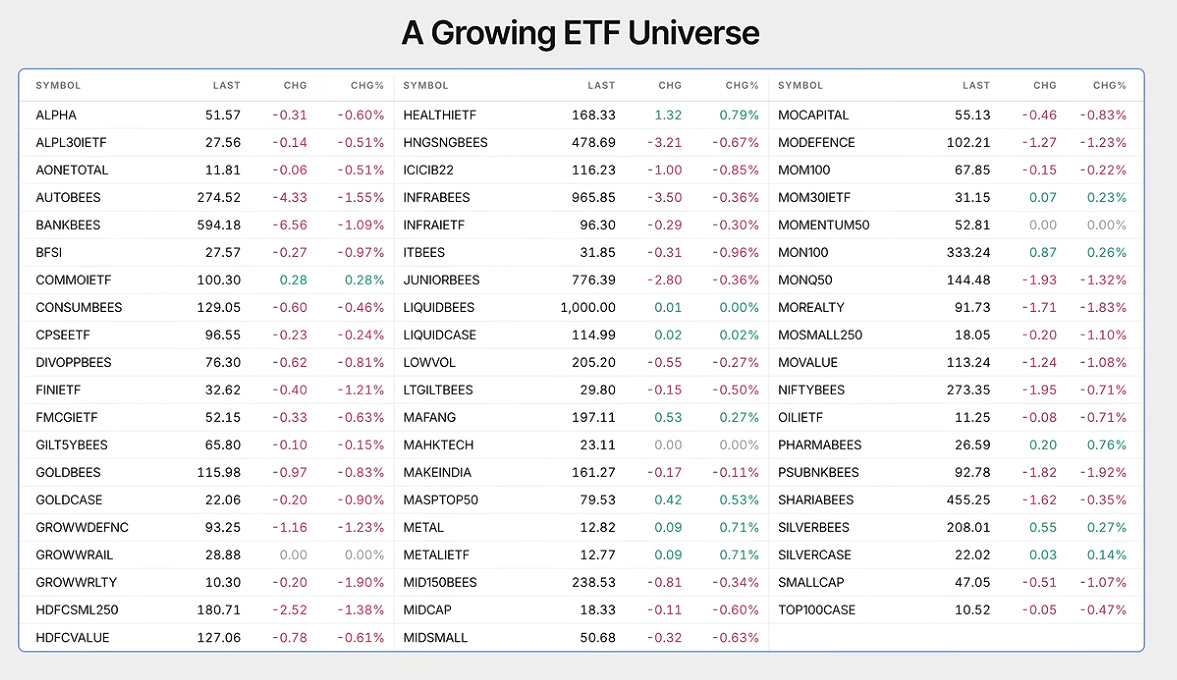
One important note: stick with ETFs that have genuine trading volumes. Many ETFs from various AMCs exist in name only with very little activity — avoid those.
That brings us to the end of the Swing Trading series. I hope you found it useful. If you have any questions, drop them in the comments — we’ll be happy to answer.
Till then — take care and trade safe.
No posts
Comments
Nothing yet. Say the first thing.
Sign in to join the conversation.