
A version of this piece was originally published by GovInsider, as part of an overall series of articles around GovMesh 4.0 - held jointly by interweave and GovInsider in Singapore earlier this year.
From hundreds of miles above the Earth, satellites can see so many things – from warming oceans to shifting city skylines. But this data is silent without someone to interpret it.
To make it speak, the Japanese Aerospace Exploration Agency (JAXA) is going back to the basics, turning to the oldest tool in human history: storytelling.
“It’s not the satellite data that people want, but the information that people can extract from the data,” says JAXA’s Advisor to the Director, Dr Naoko Sugita, at GovMesh in Singapore.
She shares how the Earth Observing dashboard has evolved from a simple viewing tool into a shared playground, empowering non-space stakeholders to use satellite data to study and solve the world’s most pressing problems.
The dashboard was first created in 2020 to monitor the worldwide impacts of the Covid-19 pandemic using earth observation data from ESA, NASA, and JAXA.
Together the space agencies worked then - and still do now - with the common goal of making earth observation data more accessible for the public.
“If I can’t use it, other people outside the space agencies can’t use it too,” she says, reflecting on her role as a policy person at JAXA rather than a scientist or engineer.
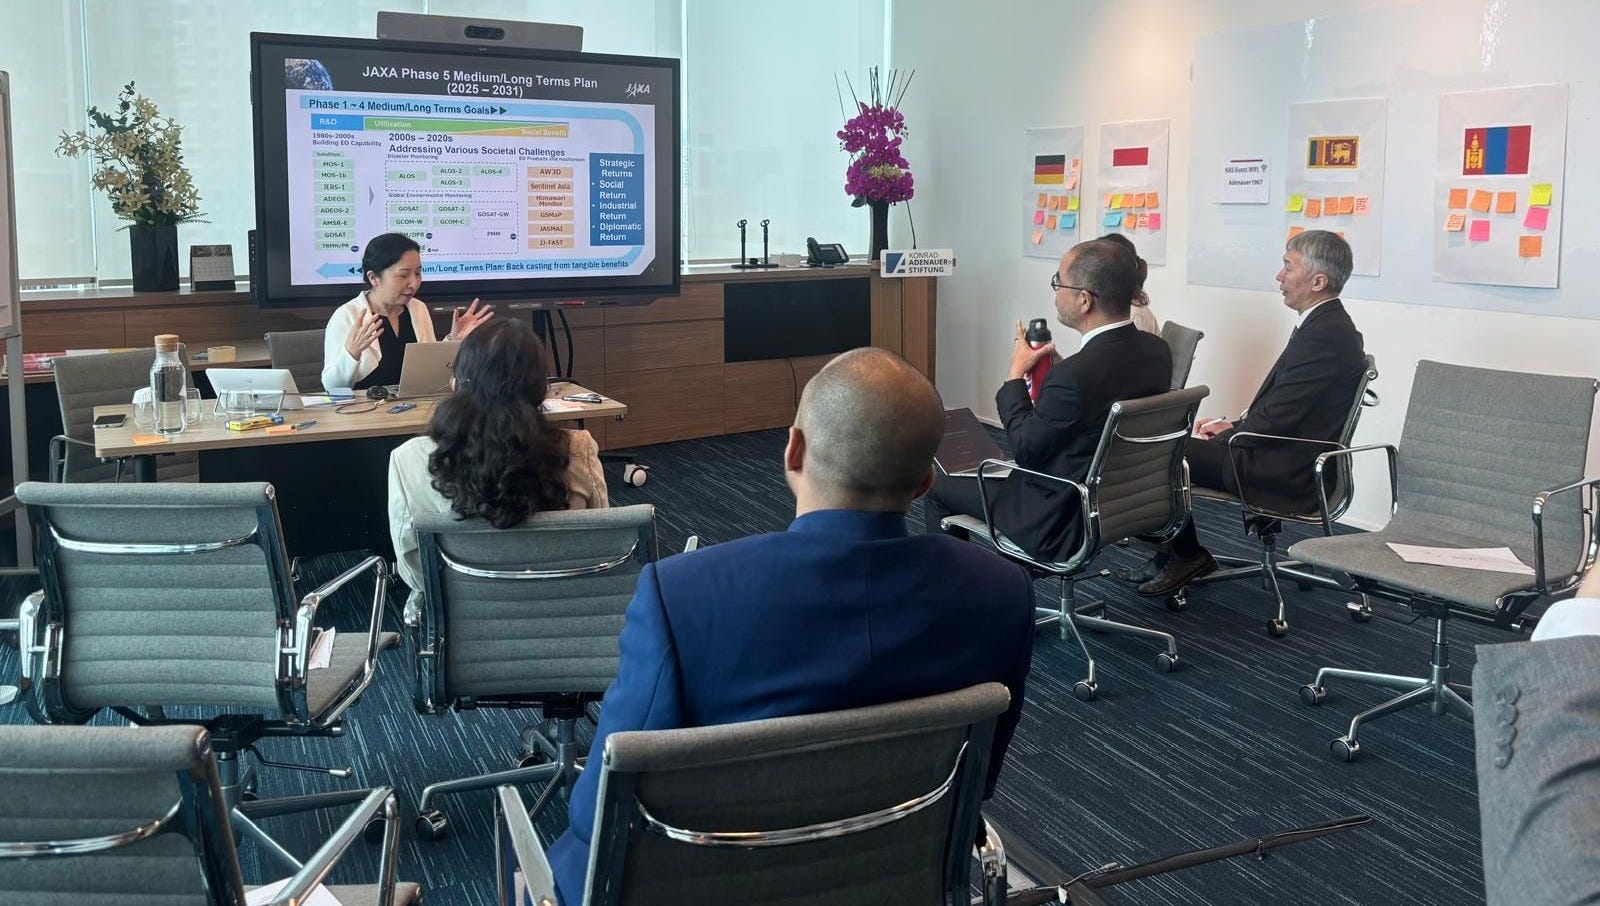
JAXA’s Advisor to the Director, Earth Observation Research Centre, Dr Naoko Sugita, presenting at GovMesh 4.0
The dashboard was built within three months and delivered on a free, web-based platform, enabling access to more than 850 open datasets across the three agencies, she tells the participants.
In 2022, it expanded its data scope to cover more areas related to environmental change.
In addition to Covid-19 data, the new areas were in atmosphere, agriculture, cryosphere (Earth’s ice), oceans, biomass, economy, and extreme events.
As of 2025, the dashboard had been used across 130 countries, reflecting expansion across Africa, small states, and emerging regions.
While the dashboard was originally intended only to facilitate earth observation data use among citizens, the dashboard has today become a tool aimed at working towards enabling open science.
What this means is encouraging participation from domain experts and other stakeholders to contribute their own narratives and evaluate the values displayed.
“Initially we created the stories within the three agencies, but we’ve been opening this up to like researchers and graduate students. So, they’re creating these stories and we verify it,” she explains.
To make it easy for others to build stories that matter to them, the dashboard uses indicators in accessible language - like CO2 daily, soil moisture, and lake quality - rather than technical metrics related to satellite data.
“Even if you don’t have any specific knowledge about handling satellite data, you can still use it and explore narratives on societally relevant topics or create new ones,” she explained.
Another key element of open science was positioning the dashboard as a lab for others to plug in.
In 2022, JAXA launched the “JAXA Earth API” to make it easier for developers and researchers to use JAXA’s satellite data easily in programming environments like Python and JavaScript.
To the same end, the team recently organized a hackathon with Cyber University, where students used the “JAXA Earth APIs” to build innovative solutions in just two and a half days.
“This proves the strength of the application programming interfaces (APIs) and dashboard to make satellite data accessible. We would like these data to be used more”.
The dashboard is also integrated with Jupyter Notebooks, which allows researchers to run analyses themselves in order to verify the results or tweak the parameters of their own studies.
Dr Sugita sees artificial intelligence (AI) as a bridge between raw data and practical solutions.
Firstly, analytical AI could be used to detect anomalies and categorize satellite imagery. For example, turning ambiguous pixels into clear categories like “forest” or “urbanized area.”
Secondly, generative AI (GenAI) could be used as a consultant for the user. JAXA is looking to incorporate a GenAI layer on their own dashboard to allow users to ask text-based questions.
“The ideal way is to be able to ask the dashboard a question like ‘When should I plant my rice to get the best harvest?’,” she explained.
By combining past insights with real-time satellite data, the AI could provide actionable responses for the user.
When Dr Sugita concludes her presentation, several participants share how their own governments have already integrated open-access earth observation data to monitor shifting terrains and inform national planning.
The takeaway is that for data to be a truly transformative tool, it requires a human-centric infrastructure.
Through an accessible dashboard, APIs, AI and community engagement, governments can turn technical metrics into meaningful tools for other users to tackle broader societal challenges.
Comments
Nothing yet. Say the first thing.
Sign in to join the conversation.