
The spread that funds the payout
QVOL began trading on May 12, 2026, which leaves slightly more than eleven weeks of live history to examine. The Cboe Nasdaq-100 Volatility Index (VXN) averaged about 25.3 across the first seven months of 2026, while trailing 21-day realized volatility on the Nasdaq Composite averaged about 18.7 over the same stretch.[1][2] The roughly 6.6-point gap between the two measures is the raw material of any option-income mandate.
A call writer sells volatility at the implied price and settles against whatever the index actually delivers. The trade compensates the writer when implied volatility sits above realized volatility. The trade works against the writer when realized volatility overshoots implied volatility, which typically happens during fast directional moves.
The first seven months of 2026 delivered both regimes. Implied volatility exceeded realized volatility on 130 of 143 trading sessions through July 29.[1][2] The exceptions clustered in April, when the monthly average spread narrowed to roughly 0.6 points, and again in early July.[1][2] Late July restored the premium, with VXN closing at 30.84 on July 29 against Nasdaq realized volatility near 17.6.[1][2]
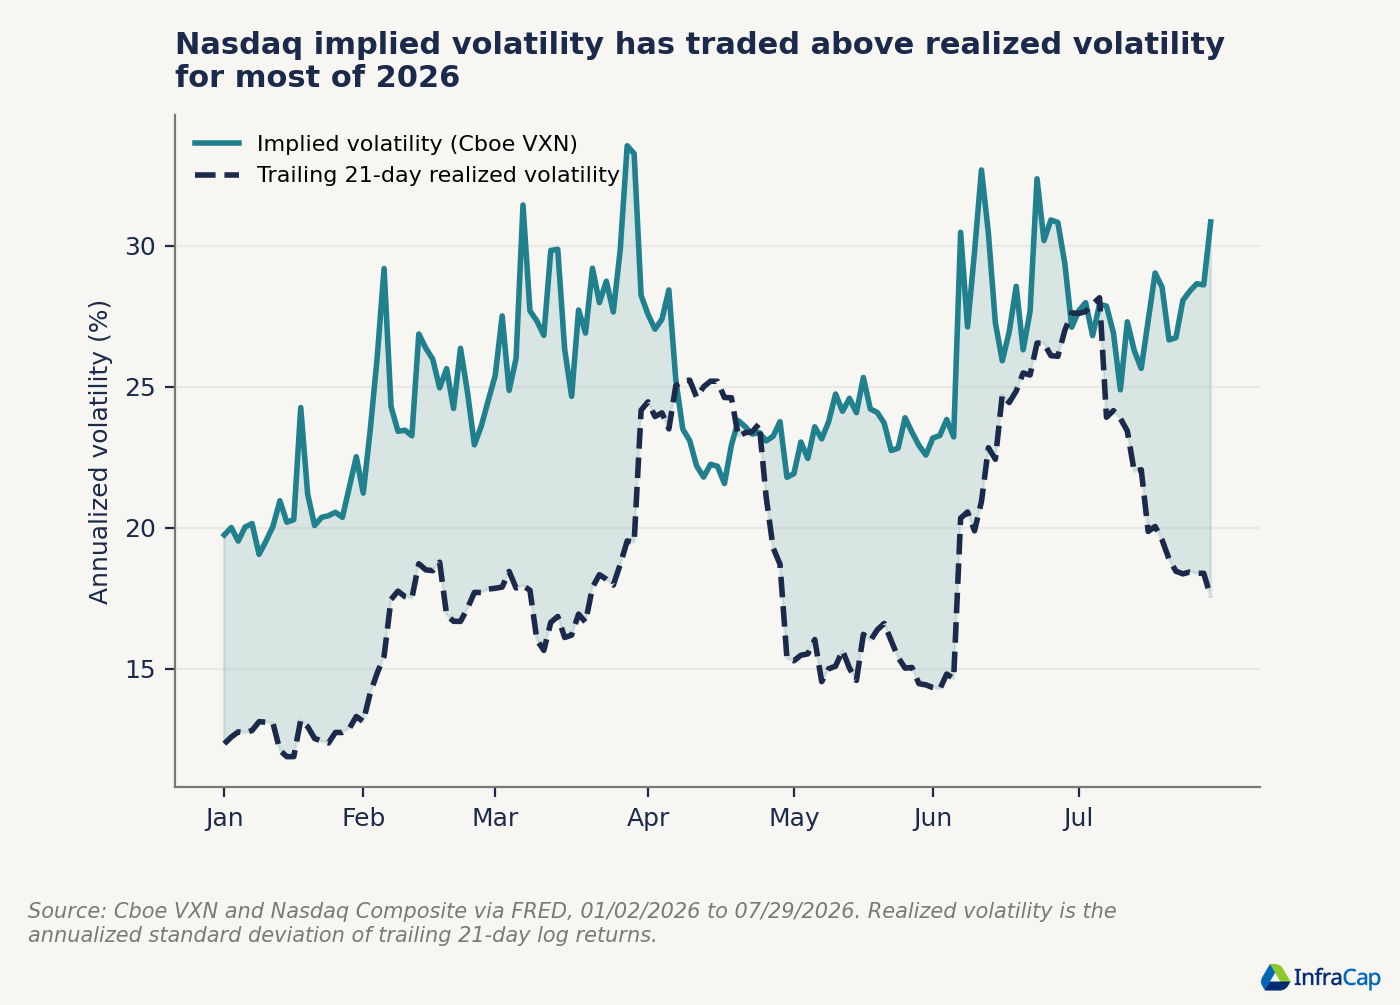
The Cboe Nasdaq-100 Volatility Index (VXN) is a real-time market index that measures expected 30-day volatility of the Nasdaq-100 Index using option prices, often referred to as the tech-sector “fear gauge”. You can explore live data and dashboards on the Cboe Global Indices Dashboard.
A distribution in each month since launch
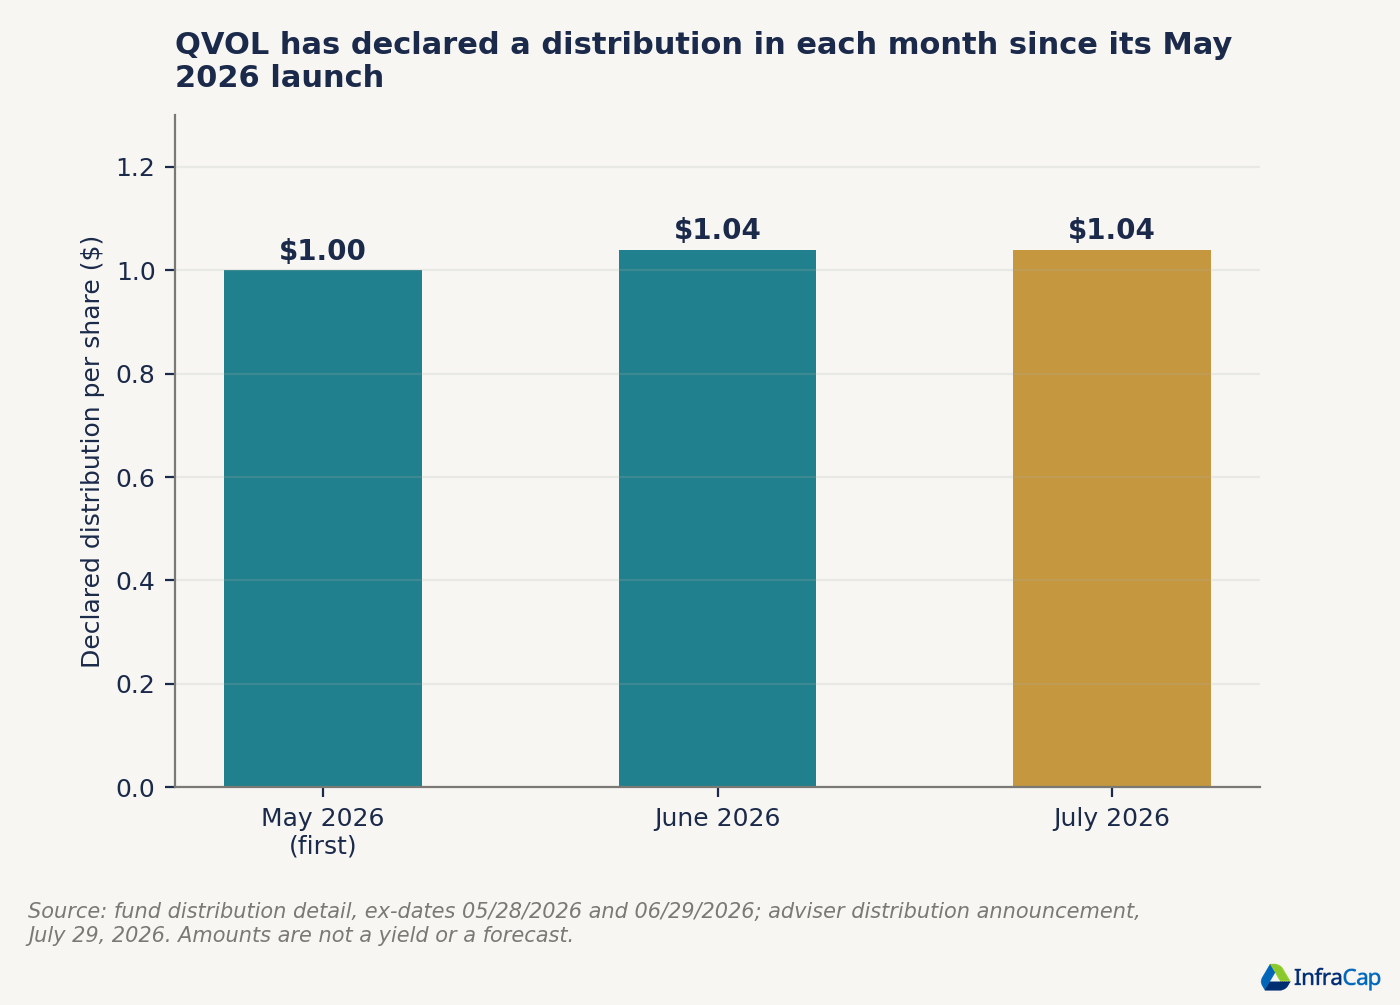
QVOL distributes monthly. The fund declared $1.00 per share with a May 28 ex-date and $1.04 per share with a June 29 ex-date, and the July 2026 distribution carried a July 30 ex-date.[3][4]
The adviser has described a target annualized distribution rate range of 12 percent to 15 percent for the strategy, while stating that no assurance exists that the range will be achieved and that the figure represents neither a yield nor a total-return target.[3] Distribution rate and total return measure different things. Option premium can fund a payout during a month when the underlying index declines, which is the intended behavior of the structure, though the payout does not offset price declines.
Where the category sits as the rate cycle turns
The federal funds target range stood at 3.50 percent to 3.75 percent on July 29, 2026, and the 10-year Treasury yielded 4.67 percent.[5][6] An income sleeve anchored to longer-duration bonds carries a different risk profile than it did at the 2021 rate trough, because further policy cuts compress reinvestment yields at the short end while the long end answers to term premium rather than to the policy rate.
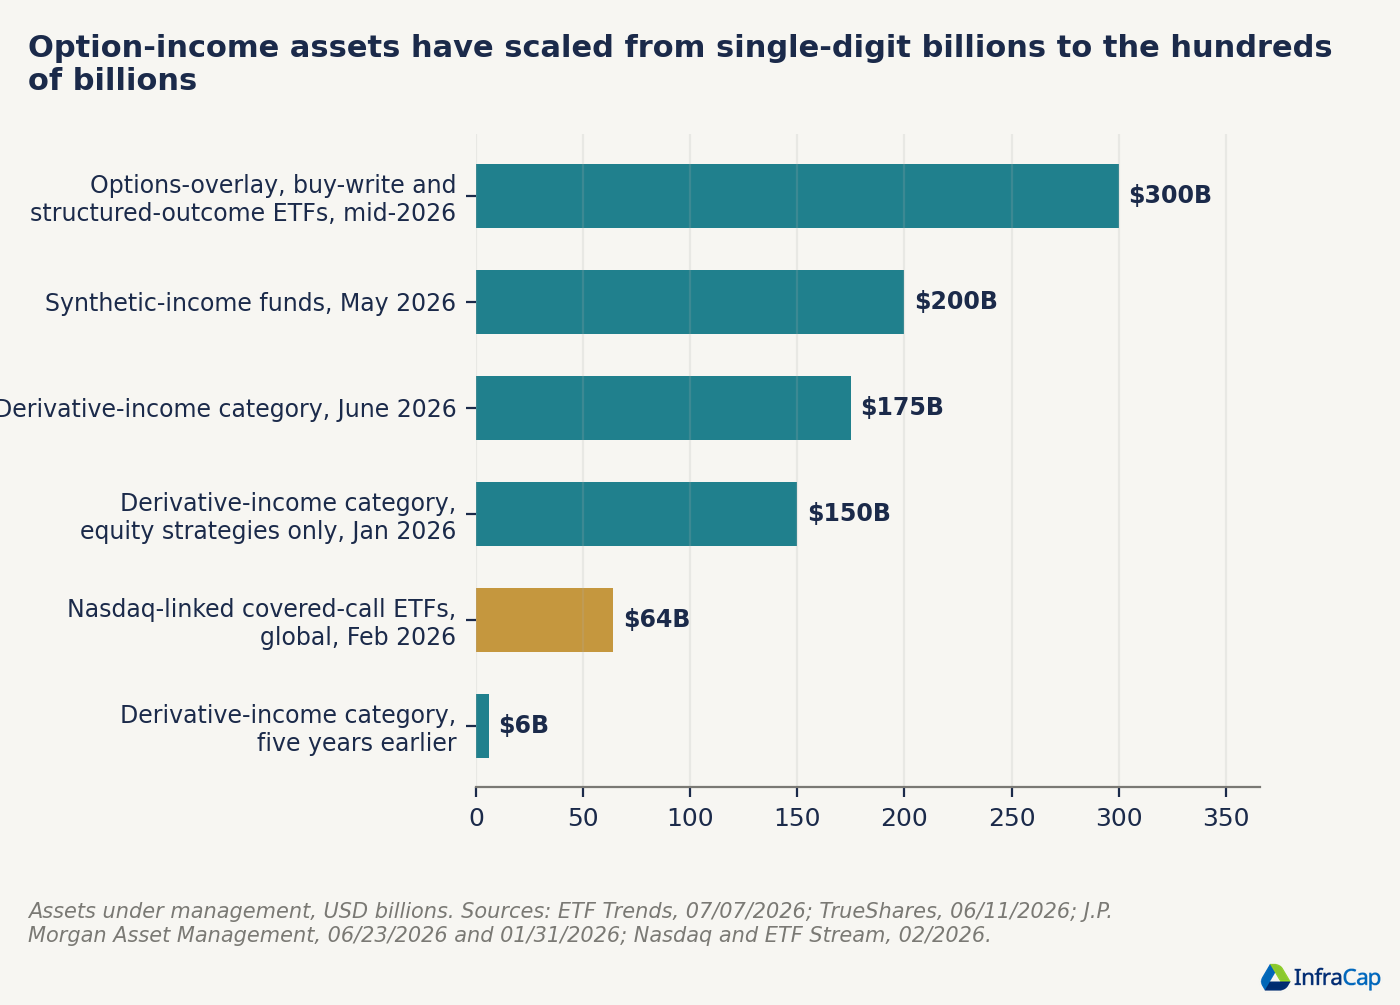
Asset flows show where allocators have looked instead. One measure puts the derivative-income category at roughly $6 billion five years ago and above $175 billion by June 2026, and a separate count of options-overlay, buy-write and structured-outcome ETFs passed $300 billion by mid-2026.[7][8] Nasdaq-linked covered-call ETFs alone accounted for roughly $64 billion globally in February 2026.[9]
Scale invites scrutiny rather than comfort. Category growth compresses option premium at the margin over time, and mandate design determines which funds continue to harvest the spread that remains.
Notes
1. Cboe Global Markets, Nasdaq-100 Volatility Index (VXN) daily closes, retrieved via Federal Reserve Bank of St. Louis, FRED, July 29, 2026.
2. Nasdaq, Nasdaq Composite Index daily closes, retrieved via Federal Reserve Bank of St. Louis, FRED, July 29, 2026.
3. Fund adviser, monthly distribution announcement, Substack, July 30, 2026, https://infrastructurecapital.substack.com/p/infrastructure-capital-announces-38b.
4. QVOL fund fact sheet, fund data as of June 30, 2026, and holdings as of July 14, 2026.
5. Board of Governors of the Federal Reserve System, federal funds target range, upper and lower limits, retrieved via FRED, July 29, 2026.
6. Board of Governors of the Federal Reserve System, 10-year Treasury constant maturity rate, retrieved via FRED, July 29, 2026.
7. J.P. Morgan Asset Management, “Across the Derivative Income Universe,” June 23, 2026.
8. ETF Trends, “Derivative ETFs: Monetizing Market Uncertainty,” July 7, 2026.
9. Nasdaq and ETF Stream, special report on enhanced income exchange-traded products, February 2026.
About Us
Infrastructure Capital Advisors LLC is a SEC-registered investment adviser based in New York. The firm offers an ETF suite covering bond income, small-cap income, equity income, MLPs, preferred stock, and REIT preferreds. Funds: BNDS (Infrastructure Capital Bond Income ETF); SCAP (InfraCap Small Cap Income ETF); ICAP (InfraCap Equity Income Fund ETF); AMZA (InfraCap MLP ETF); PFFA (Virtus InfraCap U.S. Preferred Stock ETF); PFFR (InfraCap REIT Preferred ETF). For more information visit www.infracapfunds.com.
DISCLOSURE
This information is not an offer to sell, or solicitation of an offer to buy any investment product, security, or services offered by Jay Hatfield, or Infrastructure Capital Advisors, LLC, (”ICA”) or its affiliates. ICA, will only conduct such solicitation of an offer to buy any investment product or service offered by ICA, if at all, by (1) purported definitive documentation (which will include disclosures relating to investment objective, policies, risk factors, fees, tax implications and relevant qualifications), (2) to qualified participants, if applicable, and (3) only in those jurisdictions where permitted by law. Jay Hatfield or ICA may have a beneficial long or short position in securities discussed either through stock ownership, options, or other derivatives; nonetheless, under no circumstances does any article or interview represent a recommendation to buy or sell these securities. This discussion is intended to provide insight into stocks and the market for entertainment and information purposes only and is not a solicitation of any kind. ICA buys and sells securities on behalf of its fund investors and may do so, before and after any particular article herein is published, with respect to the securities discussed in any article posted. ICA’s appraisal of a company (price target) is only one factor that affects its decision whether to buy or sell shares in that company. Other factors might include, but are not limited to, the presence of mandatory limits on individual positions, decisions regarding portfolio exposures, and general market conditions and liquidity needs. As such, there may not always be consistency between the views expressed here and ICA’s trading or holdings on behalf of its fund investors. There may be conflicts between the content posted or discussed and the interests of ICA. Please reach out to the ICA for more information. Investors should make their own decisions regarding any investments mentioned, and their prospects based on such investors’ own review of publicly available information and should not rely on the information contained herein. ICA nor any of its affiliates accepts any liability whatsoever for any direct or consequential loss howsoever arising, directly or indirectly, from any use of the information contained herein. We have not sought, nor have we received, permission from any third-party to include their information in this article. Certain information contained in this document constitutes “forward-looking statements,” which can be identified by the use of forward-looking terminology such as “may,” “will,” “should,” “expect,” “anticipate,” “project,” “estimate,” “intend,” “continue” or “believe” or the negatives thereof or other variations thereon or other comparable terminology. Due to various risks and uncertainties, actual events or results may differ materially from those reflected or contemplated in such forward-looking statements.
This material must be preceded or accompanied by a prospectus. The information contained herein represents our subjective belief and opinions and should not be construed as investment, tax, legal, or financial advice. For a prospectus with this and other information about the Funds, please visit www.infracapfunds.com. Investors should consider the investment objectives, risks, charges, and expenses carefully before investing. Please read the prospectus carefully before investing. For more information about the Funds, Fund strategies or Infrastructure Capital, please reach out to Craig Starr at 212-763-8336 (Craig.Starr@icmllc.com). The Funds are distributed either by Quasar Distributors, LLC or by VP Distributors, LLC, an affiliate of Virtus ETF Advisers, LLC. ICAP, SCAP, and BNDS ETFs are distributed by Quasar Distributors LLC. PFFA, PFFR, and AMZA ETFs are distributed by VP Distributors, LLC an affiliated of Virtus ETF Advisers, LLC.
The Nasdaq Composite is a stock market index composed of thousands of stocks listed on the Nasdaq Stock Market®, with a particular emphasis on technology-related companies. Established in 1971, it is known for featuring a wide range of companies—from established giants like Apple and Microsoft to smaller, fast-growing firms—reflecting a broad cross-section of the U.S. technology sector. The index is market capitalization-weighted, meaning that larger companies have a greater influence on its overall performance, and it is commonly used as a benchmark to gauge the health and trends of the technology-driven segments of the American economy.
Investors should consider the investment objectives, risks, charges, and expenses carefully before investing. Please read the prospectus carefully before investing. For more information about the Fund, Fund strategies or Infrastructure Capital, please reach out to Craig Starr at 212-763-8336 (Craig.Starr@icmllc.com).
A word about QVOL Risk: Investing involves risk. Principal loss is possible. The Fund is a recently organized investment company with no operating history prior to the date of this Prospectus. As a result, prospective investors have no track record or history on which to base their investment decision. Derivatives may pose risks in addition to and greater than those associated with investing directly in securities, currencies or other investments, including risks relating to leverage, imperfect correlations with underlying investments or the Fund’s other portfolio holdings, high price volatility, lack of availability, counterparty credit, liquidity, valuation and legal restrictions. Options transactions involve special risks that may make it difficult or impossible to close a position when the Fund desires. The prices of securities the Adviser believes are undervalued may not appreciate as anticipated or may go down, the valuations may never improve or returns on value equity securities may be less than returns on other styles of investing or the overall stock market. Leverage is investment exposure which exceeds the initial amount invested. When the Fund borrows money for investment purposes, or when the Fund engages in certain derivative transactions, such as options, the Fund may become leveraged. A high portfolio turnover rate (portfolio turnover in excess of 100% of the average value of the Fund’s portfolio) has the potential to result in the realization and distribution to shareholders of higher capital gains, which may subject you to a higher tax liability. Please see prospectus for discussion of risks. QVOL fund distributor, Quasar Distributors, LLC.
The Funds are distributed either by Quasar Distributors, LLC or by VP Distributors, LLC, an affiliate of Virtus ETF Advisers, LLC. QVOL, ICAP, SCAP, and BNDS ETFs are distributed by Quasar Distributors LLC. PFFA, PFFR, and AMZA ETFs are distributed by VP Distributors, LLC an affiliated of Virtus ETF Advisers, LLC.
QVOL intends to target an annualized distribution rate range of between 12% and 15% through option premiums earned from selling call options and dividends received from the Fund’s equity holdings. This target range reflects Infrastructure Capital’s expectations based on the options premiums QVOL seeks to generate and the annualized effect of those premiums. There is no assurance QVOL will achieve its target annualized distribution rate range, and the target annualized distribution rate range does not represent a 12% to 15% yield or a 12% to 15% total return. Actual distributions may be higher or lower depending on market conditions and QVOL’s results. Distributions may include a portion classified as return of capital. Return of capital generally represents a return of a shareholder’s invested capital rather than traditional income such as dividends or interest.
Nasdaq® is a registered trademark of Nasdaq, Inc. (which with its affiliates is referred to as the “Corporation”) and is licensed for use by Infrastructure Capital Advisors, LLC. The Product has not been passed on by the Corporations as to its legality or suitability. The Product is not issued, endorsed, sold, or promoted by the Corporations. THE CORPORATIONS MAKE NO WARRANTIES AND BEAR NO LIABILITY WITH RESPECT TO THE PRODUCT.
Comments
Nothing yet. Say the first thing.
Sign in to join the conversation.