
Ask a professional trader how liquid an ETF is, and the answer will rarely be a volume figure. The answer will more often be an estimate of how many shares could be created or redeemed today without disturbing the underlying market. That number -- implied liquidity -- is derived from the basket of securities the ETF holds, not from the fund’s own trading history. It is why a fund with modest screen volume can still accommodate an institutional-sized order at a fair price, and why an investor relying on average daily volume alone can leave meaningful information on the table.
The Limits of Average Daily Volume
Average daily volume, or ADV, is the most commonly cited liquidity metric for any listed security. For an ETF, ADV measures how many shares changed hands on the exchange over a trailing period. It is simple, publicly available, and often the first data point cited in a fund screen or a research memo.
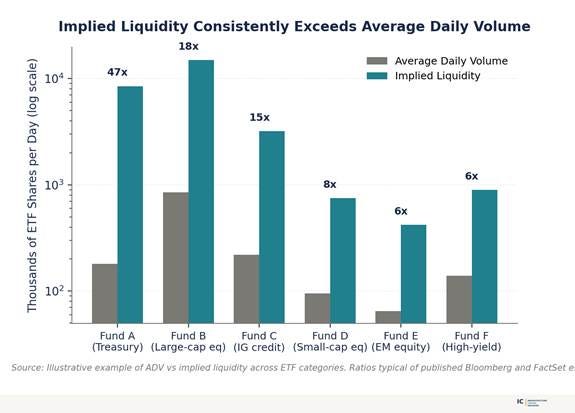
The limitation of ADV is structural. An ETF’s screen volume reflects the orders that investors chose to send to the exchange. It does not reflect the volume that would have been available if a large investor had chosen to transact. A fund tracking large-cap US equities might show 50,000 shares of ADV in its early months of trading. That number understates the fund’s true capacity, because the underlying basket -- say, the stocks of the S&P 500 -- trades billions of dollars every day, and any of those shares could be delivered into or out of the fund on demand.
Industry research suggests that for a large majority of ETFs, average daily volume is not the binding constraint on institutional trading capacity. The binding constraint is the liquidity of the underlying holdings. This is the observation that motivates the implied liquidity concept.
How Implied Liquidity Is Calculated
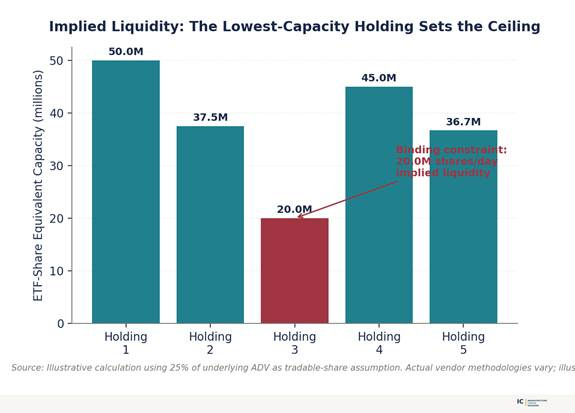
Implied liquidity translates the tradability of an ETF’s underlying holdings into an equivalent number of ETF shares. The calculation begins with each position in the fund. For every security, the calculator estimates how many shares could be traded in a normal day without moving the market -- often expressed as a percentage of that security’s own ADV. That per-security tradable share count is divided by the position’s weight in the ETF, and the resulting fund-share equivalents are compared across all holdings. The position with the lowest implied capacity sets the ceiling for the entire fund, because a creation or redemption unit must include all holdings in their prescribed weights.
The result is expressed as an implied daily tradable share count for the ETF. For a fund holding highly liquid underlyings, implied liquidity often measures in the millions of shares per day -- far above the fund’s actual screen volume. For a fund holding illiquid underlyings, implied liquidity may be lower than screen volume during periods when the ETF itself is trading actively.
Different data providers and market makers use slightly different assumptions, but the core methodology is consistent across the industry. What matters for investors is not the exact number, but the direction of the comparison. If implied liquidity meaningfully exceeds screen volume, the ETF is capable of absorbing larger orders than its trading history suggests.
Practical Applications for Position Sizing
Three implications follow. First, an investor considering a large order in an ETF that shows modest screen volume should not automatically conclude the fund cannot support the trade. The correct question is what the underlying basket can absorb. For a fund holding on-the-run Treasuries, investment-grade credit, or large-cap equities, the answer is often that the basket can support a much larger order than the ETF’s ADV would imply.
Second, execution strategy matters. An investor placing a large order without consulting an execution desk may sweep through the visible book and pay a premium that reflects the thinness of the screen, not the depth of the underlying market. A block-trading desk or an authorized participant can source the primary-market liquidity directly, often at a price significantly closer to net asset value than a screen-driven execution would produce.
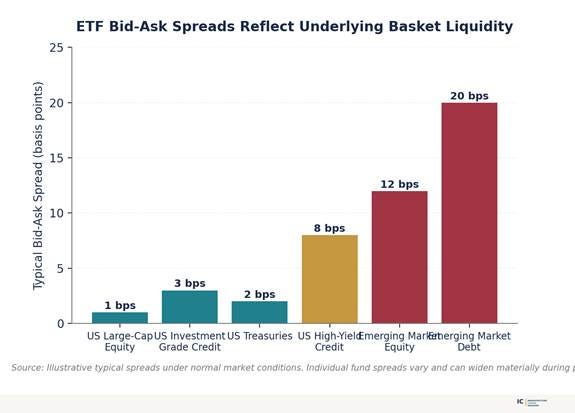
Third, implied liquidity is a starting point, not a guarantee. It represents normal conditions. During market stress, the underlying basket can become expensive to trade, and the implied capacity contracts accordingly. Investors who understand the mechanism can distinguish between a routine widening of spreads during volatility and a genuine breakdown of the creation-redemption arbitrage. The distinction is often the difference between an unnecessary trade at a bad price and a patient trade at a fair one.
Footnotes
1. State Street Global Advisors, Master the Mechanics of ETF Trading, argues that ETF trading volume is not an all-encompassing measure of a fund’s overall liquidity and that investors must also consider the liquidity of the underlying securities.
2. Jane Street Capital, ETF Execution Strategies: A Guide for Institutional Traders, October 2019, provides the framework for how execution desks translate underlying-market liquidity into ETF-share equivalents when pricing institutional trades.
3. Citigroup, ETFs and 40 Act Funds, July 2013, describes the intraday indicative value mechanism that supports the arbitrage between ETF market price and underlying basket value.
4. Bloomberg LP and FactSet Research Systems both publish implied liquidity estimates using proprietary methodologies. Each vendor’s estimate reflects its own assumptions about tradable percentages of underlying ADV.
About Us
Infrastructure Capital Advisors LLC is a SEC-registered investment adviser based in New York. The firm offers an ETF suite covering bond income, small-cap income, equity income, MLPs, preferred stock, and REIT preferreds. Funds: BNDS (Infrastructure Capital Bond Income ETF); SCAP (InfraCap Small Cap Income ETF); ICAP (InfraCap Equity Income Fund ETF); AMZA (InfraCap MLP ETF); PFFA (Virtus InfraCap U.S. Preferred Stock ETF); PFFR (InfraCap REIT Preferred ETF). For more information visit www.infracapfunds.com.
DISCLOSURE
This information is not an offer to sell, or solicitation of an offer to buy any investment product, security, or services offered by Jay Hatfield, or Infrastructure Capital Advisors, LLC, (”ICA”) or its affiliates. ICA, will only conduct such solicitation of an offer to buy any investment product or service offered by ICA, if at all, by (1) purported definitive documentation (which will include disclosures relating to investment objective, policies, risk factors, fees, tax implications and relevant qualifications), (2) to qualified participants, if applicable, and (3) only in those jurisdictions where permitted by law. Jay Hatfield or ICA may have a beneficial long or short position in securities discussed either through stock ownership, options, or other derivatives; nonetheless, under no circumstances does any article or interview represent a recommendation to buy or sell these securities. This discussion is intended to provide insight into stocks and the market for entertainment and information purposes only and is not a solicitation of any kind. ICA buys and sells securities on behalf of its fund investors and may do so, before and after any particular article herein is published, with respect to the securities discussed in any article posted. ICA’s appraisal of a company (price target) is only one factor that affects its decision whether to buy or sell shares in that company. Other factors might include, but are not limited to, the presence of mandatory limits on individual positions, decisions regarding portfolio exposures, and general market conditions and liquidity needs. As such, there may not always be consistency between the views expressed here and ICA’s trading or holdings on behalf of its fund investors. There may be conflicts between the content posted or discussed and the interests of ICA. Please reach out to the ICA for more information. Investors should make their own decisions regarding any investments mentioned, and their prospects based on such investors’ own review of publicly available information and should not rely on the information contained herein. ICA nor any of its affiliates accepts any liability whatsoever for any direct or consequential loss howsoever arising, directly or indirectly, from any use of the information contained herein. We have not sought, nor have we received, permission from any third-party to include their information in this article. Certain information contained in this document constitutes “forward-looking statements,” which can be identified by the use of forward-looking terminology such as “may,” “will,” “should,” “expect,” “anticipate,” “project,” “estimate,” “intend,” “continue” or “believe” or the negatives thereof or other variations thereon or other comparable terminology. Due to various risks and uncertainties, actual events or results may differ materially from those reflected or contemplated in such forward-looking statements.
This material must be preceded or accompanied by a prospectus. The information contained herein represents our subjective belief and opinions and should not be construed as investment, tax, legal, or financial advice. For a prospectus with this and other information about the Funds, please visit www.infracapfunds.com. Investors should consider the investment objectives, risks, charges, and expenses carefully before investing. Please read the prospectus carefully before investing. For more information about the Funds, Fund strategies or Infrastructure Capital, please reach out to Craig Starr at 212-763-8336 (Craig.Starr@icmllc.com). The Funds are distributed either by Quasar Distributors, LLC or by VP Distributors, LLC, an affiliate of Virtus ETF Advisers, LLC. ICAP, SCAP, and BNDS ETFs are distributed by Quasar Distributors LLC. PFFA, PFFR, and AMZA ETFs are distributed by VP Distributors, LLC an affiliated of Virtus ETF Advisers, LLC.
Comments
Nothing yet. Say the first thing.
Sign in to join the conversation.