
The MacMullin number (also spelled McMullin number; symbol Nm, defined as Nm = τ/ε = σ/σeff) quantifies effective ionic transport resistance inside porous battery electrodes — the ratio of electrode tortuosity τ to porosity ε, equivalently the ratio of bulk electrolyte conductivity σ to effective ionic conductivity σeff. A lower MacMullin number means less impeded Li⁺ transport and directly predicts better electrolyte rate performance. Nm is measured from symmetric-cell electrochemical impedance spectroscopy (EIS): ionic resistance Rion is extracted from the Nyquist plot (3× the difference between low-frequency and high-frequency real-axis intercepts), then Nm = Rion·A·ε·σ/d. In this study, three LiPF₆ electrolyte formulations (0.8M, 1.0M, 1.6M in EC:DMC:EMC = 3:5:2) were evaluated using the IEST EIC1400 tortuosity tester. The Nm rank (Formula 2 < Formula 1 < Formula 3) matched the 10C battery capacity retention rank exactly (93.92% / 90.55% / 89%), validating MacMullin number as a fast, reliable screening metric for electrolyte rate performance without requiring full-cell long-term testing.
This paper presents a rapid, practical method to evaluate lithium-ion electrolyte performance by linking electrolyte rate capability with electrode sheet tortuosity and the McMullin number. Combining symmetric-cell electrochemical impedance spectroscopy (EIS) with electrode tortuosity measurement enables quantification of how pore microstructure (pore size, throat diameter, connectivity) and electrolyte properties (viscosity, wettability) govern ion transport and battery rate behavior. The approach accelerates electrolyte R&D by providing an early screening metric that correlates with full-cell rate tests.
The electrolyte is the ionic highway inside a lithium-ion cell. Fast charge and discharge requires rapid Li⁺ transport through: (1) the bulk liquid phase, (2) desolvation and crossing the SEI membrane, and (3) porous electrode pathways to active particles. The microstructure of electrode coatings — especially pore connectivity and geometric complexity — determines the actual path Li⁺ must follow. This geometric impediment is captured by electrode tortuosity (τ), commonly defined as the squared ratio of actual transport path length to straight-line coating thickness: τ = (L′/L)².
Because direct porosity measurement is often complex in production settings, the MacMullin number (Nm = τ/ε) — the tortuosity-to-porosity ratio — is widely used as a convenient, physically meaningful descriptor of effective ion transport resistance inside porous electrodes. (Note: some literature variants spell it McMullin number or mcmullin number; all refer to the same concept, named after R. A. MacMullin.)
For a battery to achieve excellent rate performance, the electrolyte needs high lithium-ion transport capacity, and the speed of that transport is directly related to electrolyte performance.[1] As shown in Figure 1, the charging process involves four stages: (1) solvated lithium forms and diffuses under concentration and potential gradients; (2) at the SEI interface, solvated Li⁺ undergoes desolvation; (3) desolvated Li⁺ transports through the SEI membrane; and (4) Li⁺ diffuses through the active material body to form an intercalation compound.[2,3]
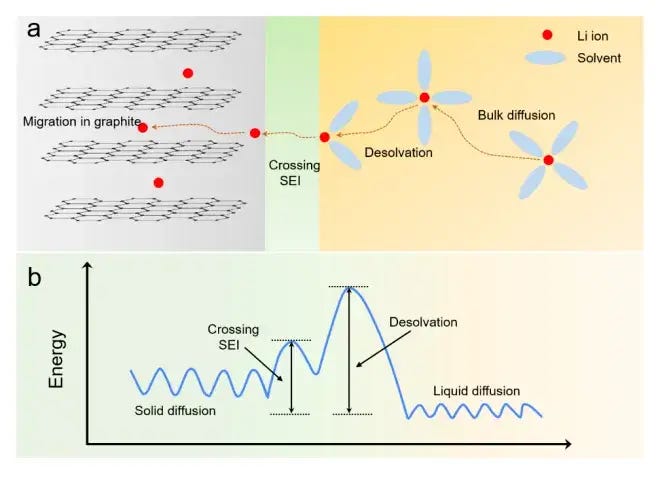
Fig. 1. (a) Schematic of lithium-ion battery charging process — four stages governing electrolyte rate performance: solvation/diffusion, SEI desolvation, SEI transport, active material intercalation; (b) Energy barrier profile at each stage[3,4]
The effective ionic conductivity in a porous electrode, σeff, links bulk electrolyte conductivity σ, porosity ε, and electrode tortuosity τ through the Bruggeman-type relation that underpins the MacMullin number:
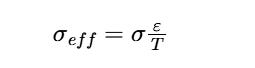
Rearranged, the MacMullin number equals Nm = τ/ε = σ/σeff. Practically, σeff is obtained from EIS on a symmetric cell (two identical electrodes separated by the same porous coating):
Assemble a symmetric cell and run EIS (frequency sweep, e.g., 100 kHz to 0.01 Hz).
Fit the low-frequency intercepts to extract ionic resistance Rion of the electrode coating from the Nyquist plot.
Compute σeff from geometry: σeff = d / (Rion·A), where d is coating thickness and A is electrode area.
Calculate MacMullin number: Nm = σ/σeff (with σ from bulk electrolyte conductivity measurement).
This electrochemical route captures not only electrode geometry but also real wetting and electrolyte microphysics (viscosity, surface tension, solvation effects), making Nm a robust predictor of in-cell rate behavior — and a faster alternative to full-cell rate cycle tests for initial electrolyte screening.
Symmetric cell assembly and EIS testing used the IEST EIC1400 Electrode Sheet Tortuosity Tester & Separator Ion Conductivity Tester (Figure 2), which integrates four battery assembly fixtures and provides four-channel simultaneous EIS testing. Specifications: pressure range 0–20 kg; frequency range 100 kHz–0.01 Hz.
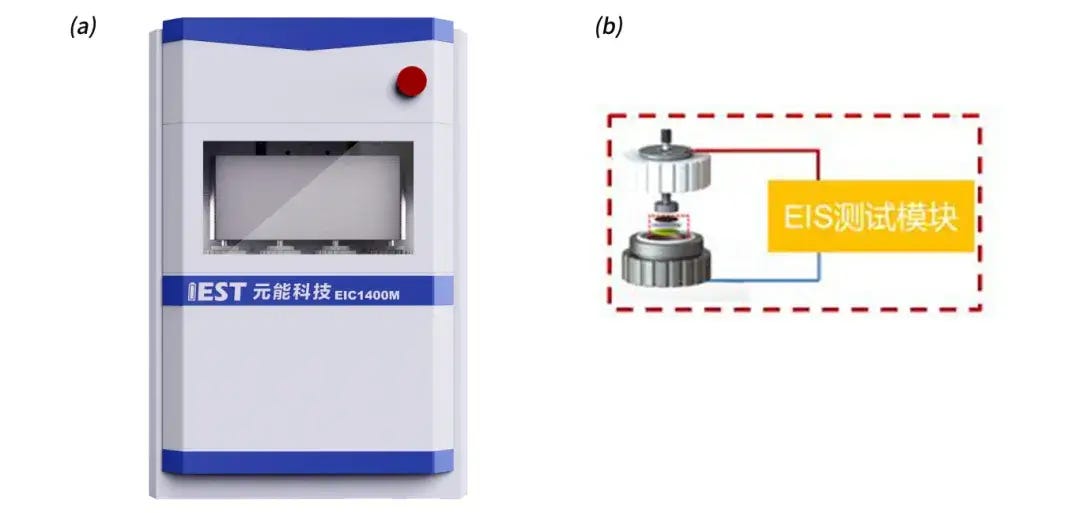
Fig. 2. IEST EIC1400 Electrode Sheet Tortuosity Tester — (a) instrument appearance; (b) four-channel symmetric-cell assembly fixtures for MacMullin number measurement
Pouch cell battery performance was evaluated using standard charge-discharge equipment. All three electrolyte formulations were tested with the same cathode and anode electrode sheets in assembled pouch cells.
Electrodes: LiCoO₂ (LCO) cathode electrode / graphite anode electrode.
Electrolytes:
Formula 1: 0.8M LiPF₆, EC:DMC:EMC = 3:5:2
Formula 2: 1.0M LiPF₆, EC:DMC:EMC = 3:5:2
Formula 3: 1.6M LiPF₆, EC:DMC:EMC = 3:5:2
Symmetric cells were assembled inside a glovebox using the EIC1400 fixture: the electrode-separator-electrode stack was loaded into the assembly jig, 5 kg pressure applied for approximately 10 minutes for wetting stabilization, then EIS was initiated via the instrument software. Ionic resistance Rion was extracted from the fitted Nyquist plot, and the MacMullin number was calculated automatically by the software.
Battery rate testing: Soft-pack cells assembled with each electrolyte formulation were cycled at 0.5C, 1C, 3C, 5C, and 10C to measure rate-dependent capacity retention.

Where: τ = electrode tortuosity; Rion = ionic resistance (Ω) from EIS; A = electrode area (cm²); ε = electrode porosity; σ = bulk electrolyte conductivity (S/cm); d = electrode coating thickness (cm). Because porosity measurement is complex, the McMullin number Nm = τ/ε (combining tortuosity and porosity into a single, measurable parameter) is used as shown in Equation (2):

From the symmetric-cell Nyquist plot (Figure 3), Rion is determined as follows: extend the low-frequency line segment until it intersects the real (X) axis; the difference between this intersection and the high-frequency real-axis intercept, multiplied by three, equals the coating’s ionic resistance Rion. This Rion is substituted into Equation (2) to obtain the electrode sheet McMullin number.
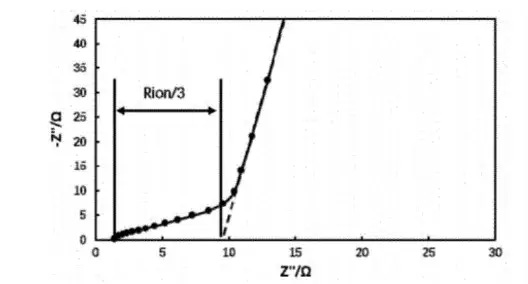
Fig. 3. Symmetric-cell EIS Nyquist plot — low-frequency intercept minus high-frequency intercept, multiplied by 3, gives ionic resistance Rion for MacMullin number calculation
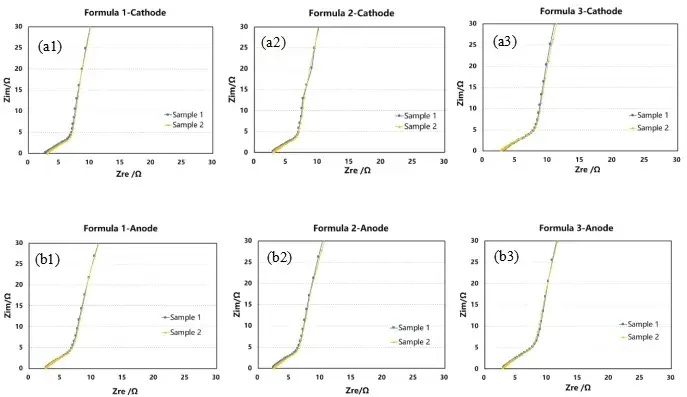
Fig. 4. EIS impedance profiles — cathode symmetric cells: formula 1 (a1), 2 (a2), 3 (a3); anode symmetric cells: formula 1 (b1), 2 (b2), 3 (b3). Fitted to extract Rion and calculate electrode sheet McMullin number
EIS was performed for each electrolyte formulation, using the same cathode or anode electrode sheet assembled into symmetric cells. The ionic resistance of each electrode was extracted by fitting the impedance profile, then Equation (2) was used to calculate the electrode McMullin number. Results are shown in Fig. 5.
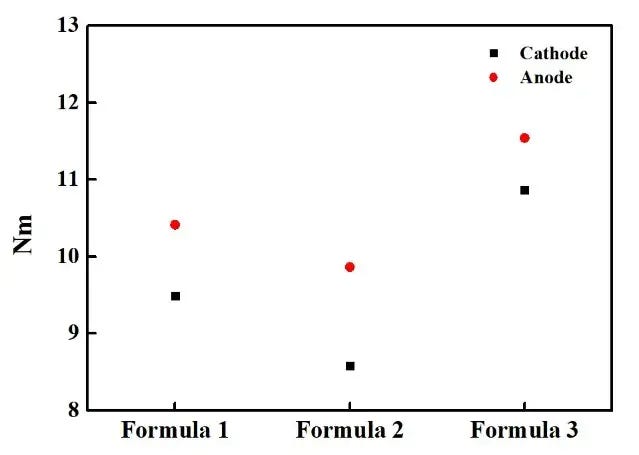
Fig. 5. McMullin number for cathode(LiCoO₂) and anode(graphite) electrode sheets in three electrolyte formulations — Nm rank: Formula 2 < Formula 1 < Formula 3
The McMullin numbers of both cathode and anode electrode sheets rank as Formula 2 < Formula 1 < Formula 3. This ordering reflects the combined effect of electrolyte physical properties on effective ionic transport — not just electrode geometry. When electrode tortuosity is measured electrochemically, the effective conductivity obtained reflects actual wetting conditions: viscosity and surface tension differences between formulations produce different wettability, and if electrolyte fails to penetrate into nanopore spaces, the effective ion transport path lengthens — increasing the apparent MacMullin number and hindering Li⁺ shuttle between electrodes, ultimately affecting rate performance, discharge capacity, and service life. The LiPF₆ salt concentration changes the electrolyte’s viscosity and surface tension, which in turn determines wettability. At 1.6M (Formula 3), the higher viscosity increases Nm; at 1.0M (Formula 2), the optimal concentration minimizes Nm and maximizes effective transport.
Table 1. Charging and discharging capacities of different battery formulas at various C-rate
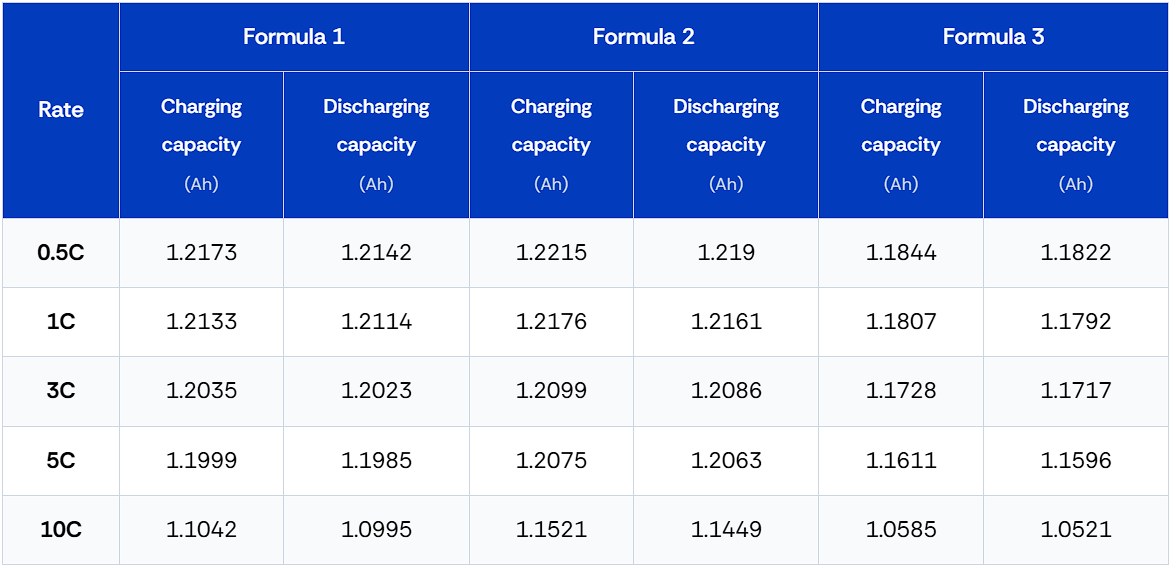
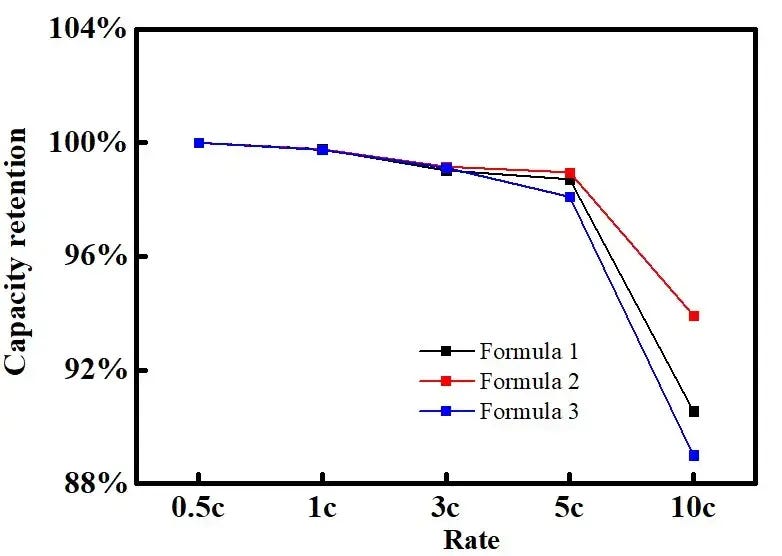
Fig. 6. Rate-capacity retention curves for three electrolyte formulations at 0.5C–10C — Formula 2 (lowest Nm) achieves best 10C retention (93.92%); Formula 3 (highest Nm) shows lowest retention (89%)
Figures 5 and 6 and Table 1 demonstrate that the MacMullin number rank directly correlates with the rate performance rank of soft-pack batteries assembled with the same electrode sheets but different electrolytes. At 10C, the capacity retention is 90.55% (Formula 1), 93.92% (Formula 2), and 89% (Formula 3) — exactly matching the Nm rank (F2 < F1 < F3). This confirms that the electrode sheet McMullin number, measured by EIS tortuosity testing, can predict battery rate performance — enabling rapid electrolyte formulation screening without full cycle testing for each candidate.
Rapid electrolyte screening: Measuring MacMullin number via symmetric-cell EIS provides a fast, low-material-consumption way to rank electrolyte candidates before committing to full-cell rate tests. This can shorten electrolyte development cycles significantly.
Process optimization — wetting issues: Differences in McMullin number across electrolyte concentrations or formulations can reveal wetting problems (e.g., poor penetration into electrode nanopores) that are addressable by adjusting electrolyte viscosity, adding wetting agents, or tuning liquid-fill process parameters.
Electrode design feedback: If MacMullin number remains high despite a well-optimized electrolyte, the bottleneck is electrode geometry — optimize electrode porosity, particle size distribution, or calendering pressure to reduce tortuosity.
Battery simulation inputs: Nm serves as a compact, physically meaningful input parameter for porous-electrode models and multi-physics battery simulations to predict rate capability and internal resistance without full-cell experiments.
Geometry accuracy: Accurate coating thickness (d) and electrode area (A) measurements are critical when computing σeff; calibrate thickness measurement regularly.
Wetting interpretation: Electrochemical Nm reflects real wetting as well as geometry; a high McMullin number could result from incomplete electrolyte wetting into nanopores rather than from geometric tortuosity alone. Complement with FIB-SEM or X-ray CT imaging when geometric versus wetting contributions need to be separated.
Reproducibility conditions: Maintain consistent test temperature and assembly pressure across measurements; both influence ionic conductivity and therefore the calculated MacMullin number.
This study assembled symmetric cells and pouch cells with three LiPF6 electrolyte formulations and demonstrated a clear correlation between electrode sheet McMullin number (𝑁𝑚) — measured by EIS-based tortuosity testing — and battery rate performance at 0.5C to 10C. The MacMullin number rank (Formula 2 < Formula 1 < Formula 3) matched the rate capacity retention rank, confirming that 𝑁𝑚 from symmetric-cell EIS can serve as a reliable, fast, non-destructive screening metric for electrolyte development. Beyond electrolyte screening, the electrode tortuosity test can be applied to study the effects of electrode formulation, porosity, active material particle morphology, separator type, and manufacturing process parameters on lithium-ion battery performance.
[1] Li N, Chen Z P, Ren W C, et al. Flexible graphene-based lithium ion batteries with ultrafast charge and discharge rates[J]. Proceedings of the national academy of sciences of the United States of America, 2012, 109 (43): 17360-17365.
[2] Yamada Y, Furukawa K, Sodeyama K, et al. Unusual stability of acetonitrile-based superconcentrated electrolytes for fast-charging lithium-ion batteries [J]. Journal of the American chemical society, 2014, 136(13): 5039-5046.
[3] Caiwl, Yao Y X, Zhu G L, et al. A review on energy chemistry of fast-charging anodes [J]. Chemical society reviews, 2020, 49 (12): 3806-3833.
[4] Yin ZG, Wu NN, Cao MH, et al. Progress of electrolyte for fast-charging lithium-ion batteries[J]. New Energy Progress, 2024, 12(2): 216-226.
Need high-precision structural data for your R&D? Talk to our engineers:
This article was originally published at: Rapid Screening of Electrolyte Rate Performance via Electrode Tortuosity and the McMullin Number first appeared on IEST Instrument | World-leading Innovative Lithium Battery Tester Solution Provider
No posts
Comments
Nothing yet. Say the first thing.
Sign in to join the conversation.