
Battery gas analysis for lithium iron phosphate (LFP) cells quantifies the gas species and volumes produced during abnormal operation such as overcharge and overdischarge. LFP stands for lithium iron phosphate (LiFePO₄), the cathode material used in LFP cells, which are the dominant format for new energy vehicles and grid-scale energy storage due to their safety advantages over high-nickel NCM chemistries. In this study, LFP cells were overcharged to 5.0 V and overdischarged to 0 V while the IEST GVM2200 in-situ battery gassing and volume analyzer recorded real-time volume changes. Gas chromatography (GC-2014C, TCD/FID detectors) then identified gas species from the electrochemical cell headspace. Key findings: overcharge produces a complex gas mixture dominated by H₂, CO, and CO₂ (from electrolyte oxidation and moisture-related reactions) plus light hydrocarbons; overdischarge yields primarily H₂ with lower levels of oxidative products. Volume inflection points — near 110% SOC during overcharge, below ~0.4 V during overdischarge — provide early, non-destructive indicators of battery gassing onset without requiring disassembly.
Lithium iron phosphate (LFP) cells — which typically use LiFePO₄ with an olivine crystal structure coated on aluminum foil as the cathode, and graphite coated on copper foil as the anode — have become the preferred choice for new energy vehicles and energy storage power stations due to their superior safety profile, long cycle life, and low material cost.
During charging, Li⁺ ions migrate from the LiFePO₄ particle surface into the electrolyte, pass through the separator, and intercalate into the graphite lattice on the anode side, forming a series of intercalation compounds (LiCₓ). Electrons flow from the aluminum foil through the external circuit to the copper foil, maintaining charge balance. As Li⁺ ions are extracted from the cathode, the material transforms from LiFePO₄ to Li1−xFePO₄. During discharge, the process reverses: Li⁺ deintercalates from the graphite anode, moves through the electrolyte and separator, and re-embeds into the LiFePO₄ lattice. Figure 1 illustrates the LFP cell working principle.
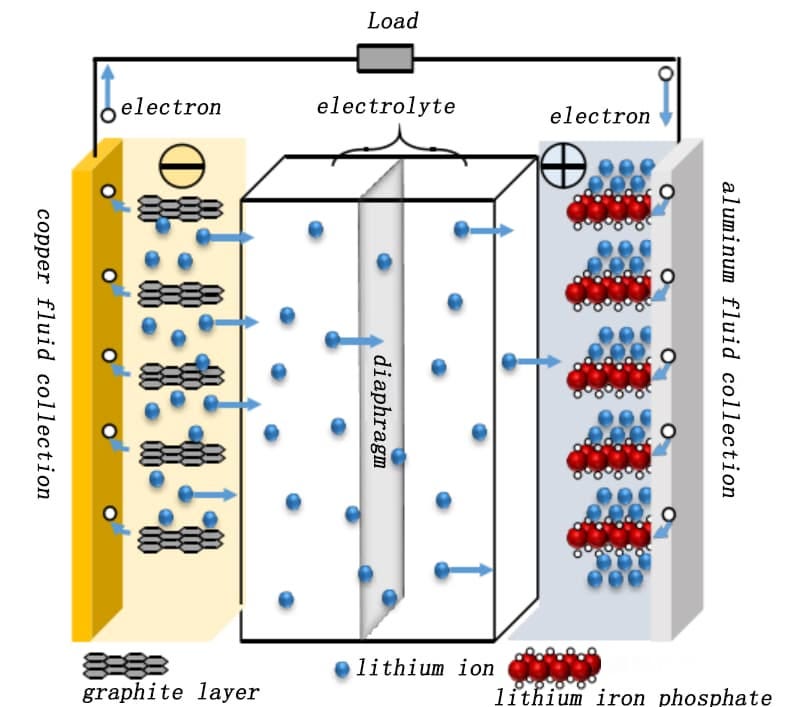
Figure 1. LFP cell working principle schematic — Li⁺ intercalation between LiFePO₄ cathode (Al foil) and graphite anode (Cu foil); electron flow through external circuit[1]
Both overcharge and overdischarge cause severe damage to LFP cells. Overcharging can trigger lithium plating and gas generation; overdischarging can cause copper dendrite formation and gas evolution. Both mechanisms accelerate performance degradation and may initiate thermal runaway. Understanding battery gassing under these abuse conditions — gas species, volumes, and timing — is essential for LFP cell safety design and failure analysis.
This study uses an IEST GVM in-situ gassing and volume analyzer combined with gas chromatography to perform real-time battery gas analysis of LFP cells during controlled overcharge and overdischarge tests, with the goal of quantifying gas evolution, identifying gas species, and correlating gas production with electrochemical events.
GVM2200 — In-Situ Battery Gassing & Volume Analyzer (IEST)
Temperature range: 20 °C – 85 °C
Dual-channel synchronous testing (two cells simultaneously)
Real-time logging of cell volume, temperature, current, voltage, and capacity
Gas Chromatography (GC-2014C) for gas analysis battery:
Samples taken (1 mL) from the cell headspace inside an inert glovebox.
Detectors: TCD (thermal conductivity) and FID (flame ionization) to cover H₂, CO, CO₂, CH₄, C₂H₆, C₂H₂, and other hydrocarbons.
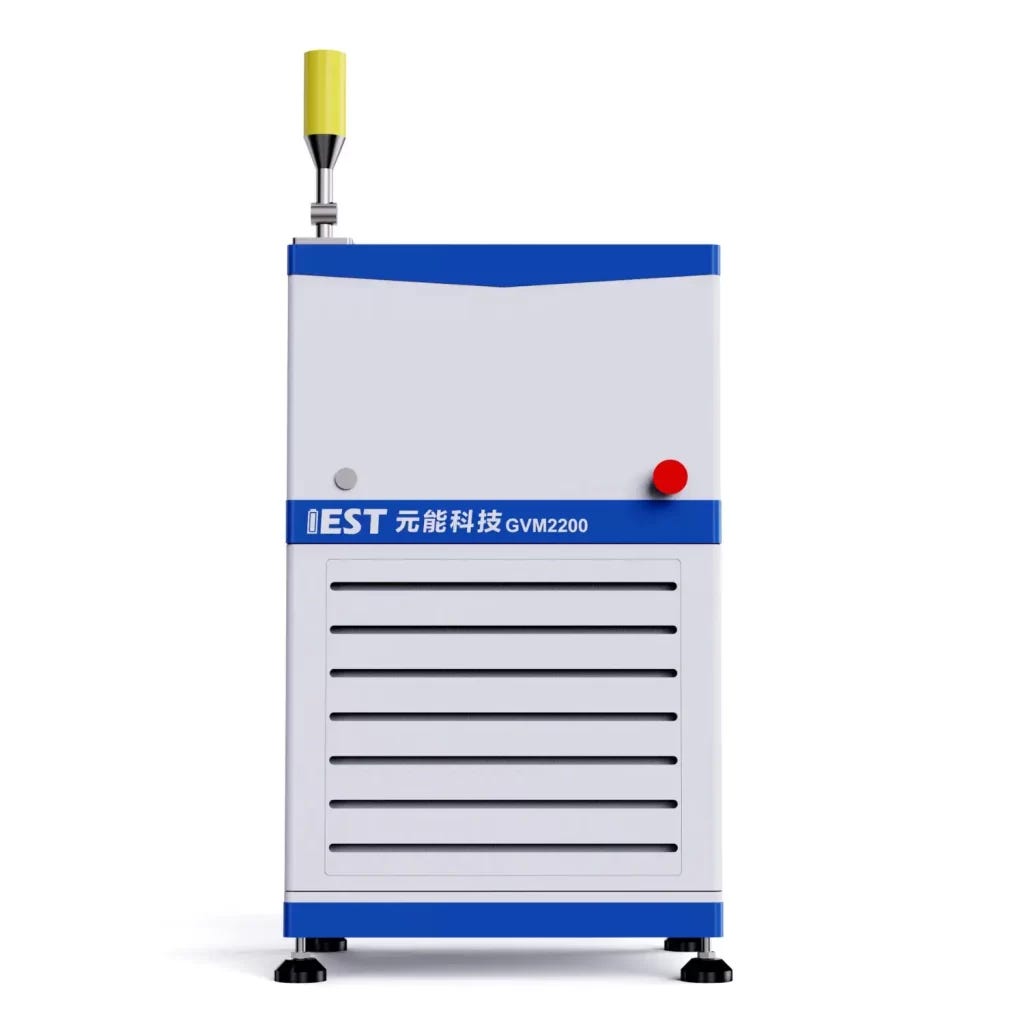
Figure 2. IEST GVM2200 In-Situ Battery Gassing & Volume Analyzer — 20–85°C, dual-channel, real-time battery gas volume and cell swelling monitoring
Gas Chromatography (GC-2014C) for electrochemical cell headspace gas analysis:
1 mL headspace gas samples collected inside an inert glovebox
Detectors: TCD (thermal conductivity detector) and FID (flame ionization detector) to cover H₂, CO, CO₂, CH₄, C₂H₆, C₂H₂, and other hydrocarbons
Cells preconditioned at 2.5 V, held 2 hours.
Cell A (overcharge): 0.5C (1.5 A) CCCV to 5.0 V, cutoff current 0.2 mA, then hold.
Cell B (overdischarge): 0.5C (1.5 A) CC discharge to 0 V, then hold.
Initial mass (m₀) recorded; GVM2200 records continuous volume changes while GC samples headspace gas at the end of each abuse test.
Each cell was weighed (m₀) and placed into the GVM2200. Parameters including cell ID and sampling frequency were configured in MISG software, which automatically recorded volume change, temperature, current, voltage, and capacity throughout the test. For electrochemical cell headspace gas analysis, 1 mL of gas was extracted in a glovebox and analyzed with the GC-2014C using TCD and FID detectors (Figure 3).
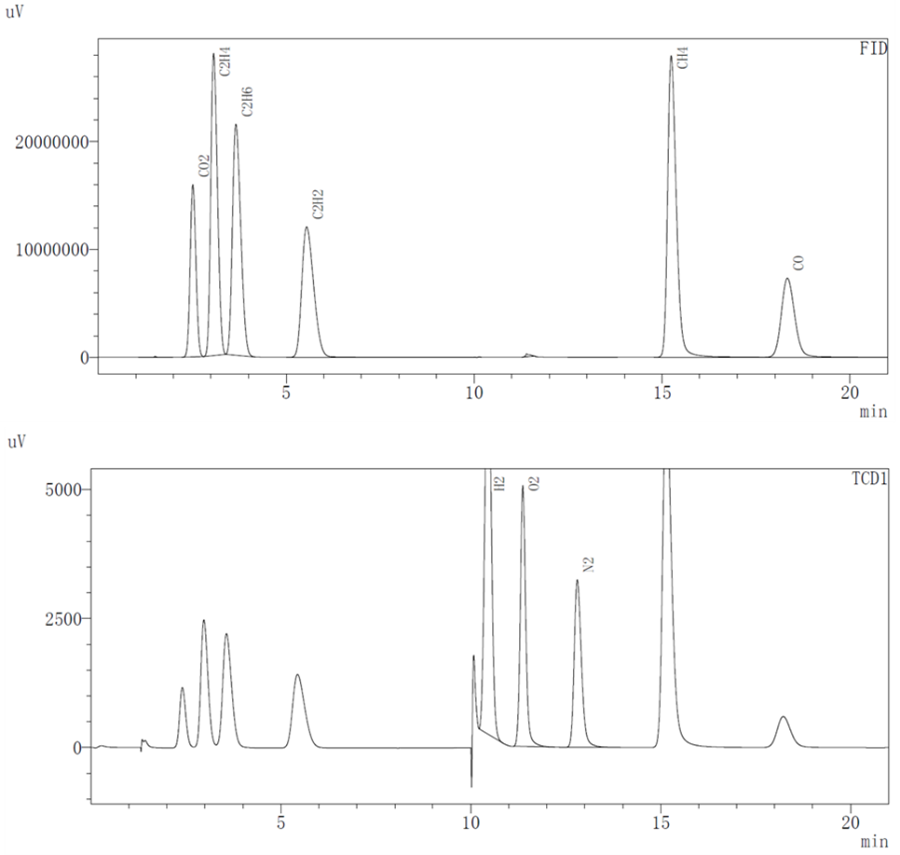
Figure 3. Gas species detectable by TCD and FID detectors — H₂, CO, CO₂, CH₄, C₂H₆, C₂H₂ and hydrocarbons, covering the full battery gassing spectrum for LFP overcharge and overdischarge analysis
As shown in Figure 4, the volume and voltage change curve of the lithium ion from the positive electrode during the normal charging stage of the charging cell, the voltage increases, as the voltage increases, and the cell volume increases, and the process of graphite can reach 10%[2]。Graphite negative electrode is a typical phased interlayer lithium embedding process. After lithium ion is embedded, the layer keeps the plane. The graphite layer and the embedded layer are arranged in parallel, and every third layer, 2 and one layer are regularly embedded to form Li-C interlayer compounds (LiCx) with different phases such as 3,2 and 1.The initial stage is stage 4, and the state of each three layer of lithium ion is called stage 3, which corresponds to Li0.3C6Compounds, with a relative lithium concentration of 33.33%.Each two layers of lithium embedding is stage 2, corresponding to Li0.5C6, The relative concentration was 50%.After the graphite is completely embedded with lithium, the LiC is formed6Compound, one lithium ion embedded in the middle of every six hexagonal carbon atoms, is a 100% relative lithium-embedded concentration[2].
As shown in Figure 5 shows the change of the negative state in the normal charging stage of LFP cell. The above lithium embedded stage is in a completely ideal state. The actual lithium embedded state inside graphite is more complex, which is often a mixture of multiple stages.The volume change of the corresponding cell charging stage is mainly related to the structural phase change caused by the negative electrode lithium embedding[5], In the initial stage of charging, with the increase of lithium embedded, the volume of graphite lattice expands, forming the expansion curve with the larger slope of the first stage, the lattice size of graphite changes least between x=0.2 and 0.6, and the expansion appears a platform curve; LiC6The layer spacing of the phase is significantly greater than that of Li0.5C6each other.equal LiC6The maximum slope for the increase of the corresponding thickness change occurs in the presence of the phase.
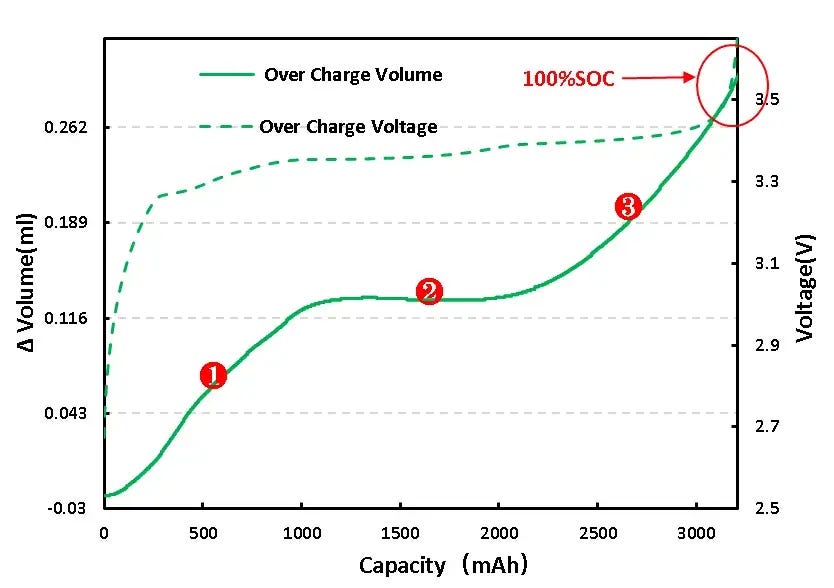
Figure 4. LFP cell volume change during normal charging — staged graphite lithiation (stage 4 → stage 1, LiC₆) produces characteristic volume increase with inflection points at each phase transition
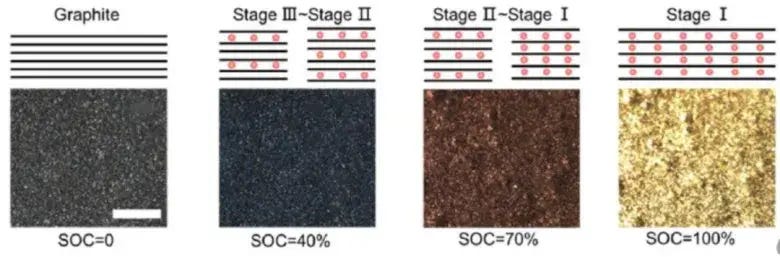
Figure 5(1). Graphite anode staging during normal LFP cell charging[2] — phase sequence stage 4 → stage 3 (Li0.3C₆, 33%) → stage 2 (Li0.5C₆, 50%) → stage 1 (LiC₆, 100%)
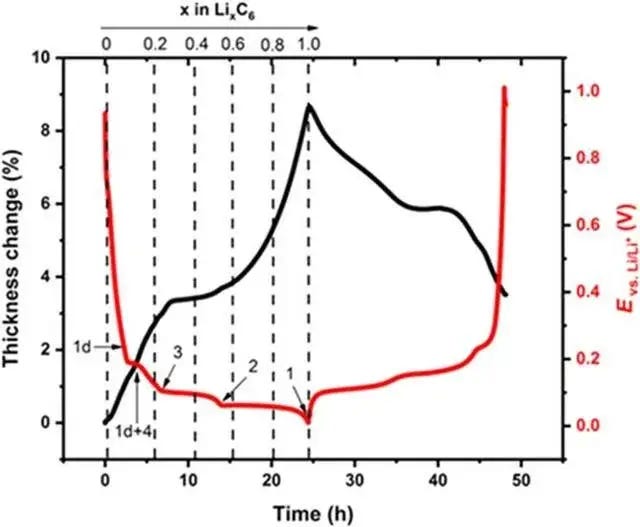
Figure 5(2). Graphite volume expansion vs relative Li concentration[5] — plateau region (x = 0.2–0.6) and maximum slope at LiC₆ formation
Overcharge (to 5.0 V): Volume versus voltage curves show a clear inflection point near the overcharge onset (~110% SOC), followed by sustained volume growth even as voltage holds at the overvoltage plateau. Visible pouch bulging occurs, indicating gas generation and irreversible swelling — classic battery gassing from electrolyte decomposition and moisture-driven reactions (Figure 6a).
Overdischarge (to 0 V): Volume is stable through most of the discharge, but an inflection appears below approximately 0.4 V; prolonged low-voltage conditions drive continued volume increase and mild bulging (Figure 6b), consistent with reductive side reactions at the anode-current collector interface.
These volume inflection signatures enable rapid, non-destructive detection of battery gassing onset and provide precisely timed triggers for GC headspace sampling — the core advantage of combining in-situ GVM monitoring with post-test gas chromatography for battery gas analysis.
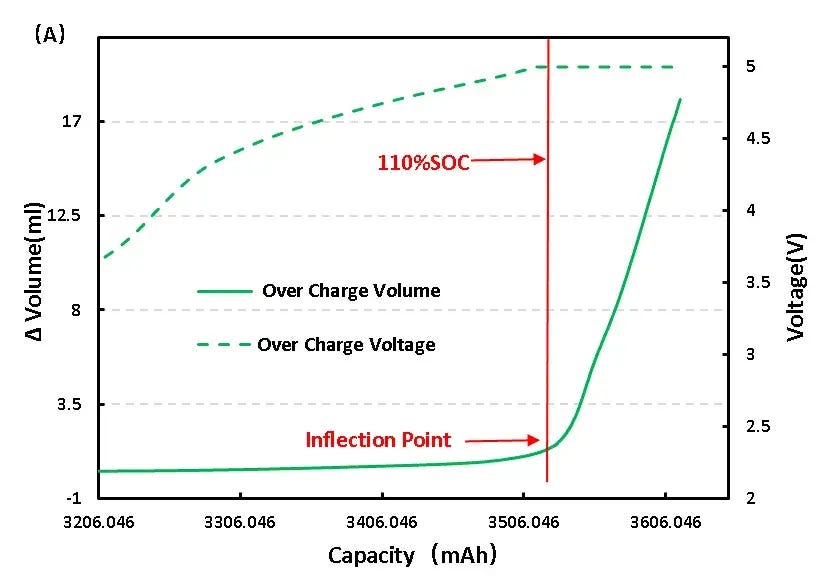
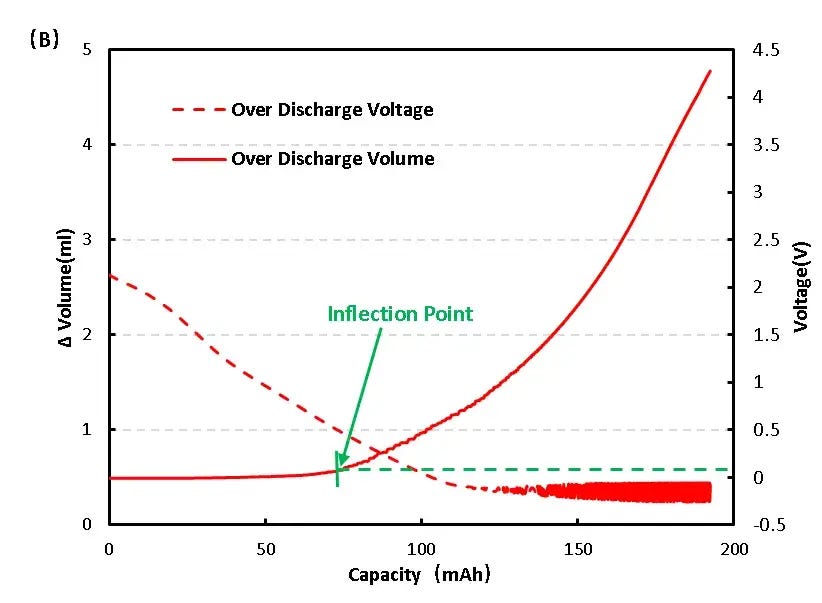
Figure 6. LFP cell volume change during (a) overcharge to 5.0 V — inflection at ~110% SOC confirms battery gassing onset; (b) overdischarge to 0 V — inflection below ~0.4 V from reductive gas evolution
Headspace samples taken after overcharge and overdischarge were analyzed by GC with TCD and FID detection. Major findings for LFP cell battery gas analysis:
Hydrogen (H₂): Highest proportion in both conditions — likely from trace water decomposition and side reactions at elevated potential or temperature. Moisture impurities in electrodes or electrolyte catalyze H₂ evolution.
Carbon oxides (CO, CO₂): Detected in substantial quantities during overcharge, confirming oxidative decomposition of carbonate-based electrolyte solvents (EC, DMC, EMC, DEC). CO₂ is a well-established product of carbonate electrolyte oxidation at high potentials.
Light hydrocarbons (CH₄, C₂H₆, C₂H₂): Present in smaller but measurable amounts, reflecting radical-pathway electrolyte fragmentation and possible SEI degradation. Presence of C₂H₂ may indicate severe electrolyte breakdown.
Overall, the battery gas analysis confirms that overcharge generates a richer mixture of oxidative decomposition gases (CO, CO₂, hydrocarbons) in addition to H₂, while overdischarge yields primarily H₂ and lower levels of oxidation products. GC spectra and quantitative comparisons are shown in Figures 7–8 and Table 1.
H₂: May originate from water desorption/decomposition on electrodes and catalytic hydrogen evolution at high potentials. Literature suggests water desorption under vacuum at ~350 K with activation energy ~1.3 eV; in cells, localized heating and catalysis accelerate H₂ production.
CO / CO₂: Oxidative decomposition of carbonate solvents (EC, DMC, EMC, DEC) at high potentials generates COx species. Overcharge to very high voltages amplifies solvent oxidation and CO₂ formation.
Hydrocarbons / C₂ species: Radical pathways and electrolyte fragmentation produce small hydrocarbons; presence of C₂H₂ may signal severe electrolyte breakdown.
Overall, gas analysis battery results confirm that overcharge produces a richer mixture of oxidative decomposition gases (CO, CO₂, hydrocarbons) in addition to H₂, while overdischarge yields significant H₂ and lower levels of oxidation products.
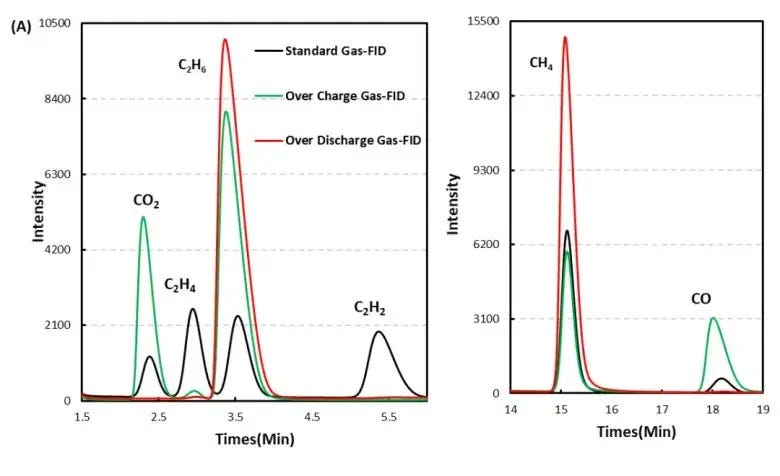
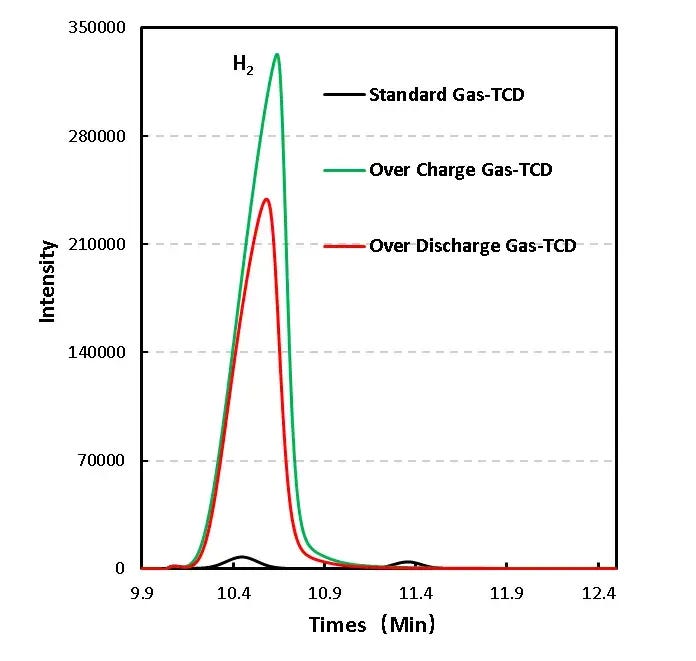
Figure 7. GC headspace gas analysis results — (a) overcharge: H₂, CO, CO₂, CH₄, C₂H₆, C₂H₂ from electrolyte oxidation; (b) overdischarge: H₂-dominant with lower CO/CO₂, consistent with reductive reactions
Table 1. Gas species comparison: LFP cell overcharge vs overdischarge
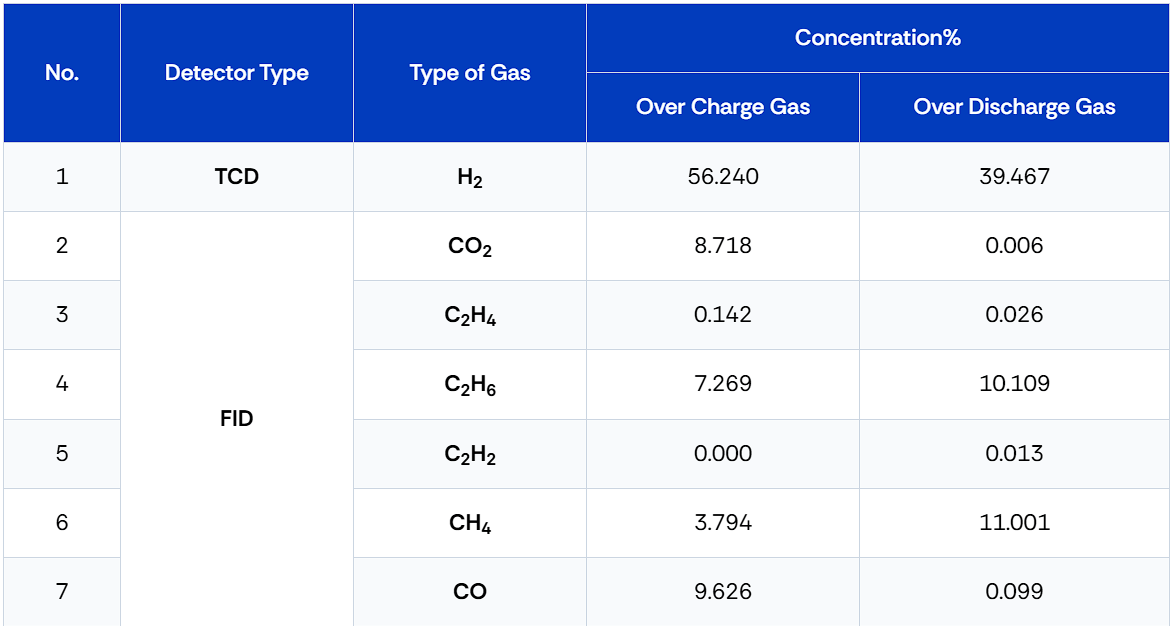
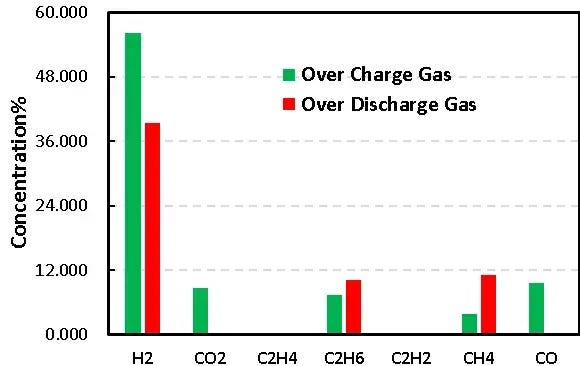
Figure 8. Total gas production comparison — LFP cell overcharge (more diverse oxidative gas mixture) vs overdischarge (primarily H₂)
H₂: Originates from water desorption and decomposition on electrode surfaces and catalytic hydrogen evolution at high potentials. Literature indicates water desorption from graphite surfaces at ~350 K with activation energy ~1.3 eV; in cells, localized heating and catalysis at the electrode-electrolyte interface accelerate H₂ generation.[3,4]
CO / CO₂: Oxidative decomposition of carbonate solvents (EC, DMC, EMC, DEC) at high potentials produces CO and CO₂. Overcharge to 5.0 V significantly exceeds the electrochemical stability window of standard electrolytes, amplifying solvent oxidation and CO₂ formation.
C₂H₂ and other hydrocarbons: Radical fragmentation pathways during extreme electrolyte breakdown produce trace C₂ species. Detection of C₂H₂ is a marker of severe electrolyte degradation beyond normal operating conditions.
Early battery gassing detection: Real-time volume monitoring with the GVM series provides immediate indicators of gas generation onset through volume inflection signatures, enabling timely intervention during testing and manufacturing validation. Combining volume signals with targeted GC sampling yields robust, quantitative battery gas analysis results.
Moisture control: Minimizing residual moisture in electrodes and electrolyte is critical to reducing H₂ evolution. Strict material drying protocols and dry-room humidity control directly reduce the dominant gas hazard in both overcharge and overdischarge scenarios.
Electrolyte design: Electrolyte formulations with improved oxidative stability and high-voltage-stable additives reduce CO/CO₂ formation under overcharge conditions. LFP cells, while safer than high-Ni NCM chemistries, still experience electrolyte solvent oxidation at extreme states.
Failure forensics: Quantitative gas species data combined with precise timing relative to SOC/voltage from the GVM allows root-cause analysis — distinguishing thermal runaway precursors from purely electrochemical decomposition events and supporting pack-level safety system design.
Combining in-situ battery gassing volume monitoring (GVM2200) with GC electrochemical cell headspace gas analysis provides a powerful gas analysis battery workflow for LFP cell abuse studies. Key outcomes:
Overcharge to 5.0 V produces a mixed gas dominated by H₂, CO, and CO₂, plus light hydrocarbons — consistent with electrolyte oxidation and moisture-related reactions at extreme potentials.
Overdischarge to 0 V yields significant H₂ production, reflecting moisture-related and reductive side reactions at low potential.
Real-time volume trends provide precise timing for GC sampling and support rapid safety validation, R&D diagnostics, and quality control for LFP-based systems.
This combined approach helps engineers and researchers understand battery gassing mechanisms, improve cell formulations, and design safer batteries and packs.
[1] Zheng Zhikun Cheng.Research on lithium iron phosphate energy storage overcharged thermal runaway and gas detection safety early warning [D].Zhengzhou University.
[2] Reynier Y, Yazami R, Fultz B, et al. Evolution of lithiation thermodynamics with the graphitization of carbons[J].Journal of Power Sources, 2007, 165(2):552-558.
[3] Yang L, Chen H S, Song W L, et al. Effect of Defects on Diffusion Behaviors of Lithium-Ion Battery Electrodes: In Situ Optical Observation and Simulation[J].ACS Applied Materials & Interfaces, 2018, 10(50).
[4] Kajiura H, Nandyala A, Bezryadin A. Quasi-ballistic electron transport in as-produced and annealed multiwall carbon nanotubes[J].Carbon, 2005, 43(6):1317-1319.
[5] H.Michael, F.Iacoviello, T.M.M.Heenan, A.Llewellyn,J.S.Weaving, R.Jervis, D.J.L.Brett, and P.R.Shearing. A Dilatometric Study of Graphite Electrodes during Cycling with X-ray Computed Tomography[J]Journal of the Electrochemical Society, 2021,168: 010507.
Need high-precision structural data for your R&D? Talk to our engineers:
This article was originally published at: Analysis of Gassing Behavior Of LFP Cell Battery During Overcharge And Overdischarge Stages first appeared on IEST Instrument | World-leading Innovative Lithium Battery Tester Solution Providers originally published at:
No posts
Comments
Nothing yet. Say the first thing.
Sign in to join the conversation.