
So I was really excited this morning to find detailed data on the state of education in the US. I have heard from a number of reputable people, including Ian Rowe, about the horrifying numbers of students at grade level in math. I’ve also heard from Larry Sand about grade inflation in California. What I don’t have is the data.
So this morning I stumbled upon NAEP which is the organization that Rowe was talking about, and I got very excited when I saw that I could download data from their website. Then I did it. I was blown away. Not by the numbers, but by the weedy garden of numbers. In other words, I got a worms-eye view.
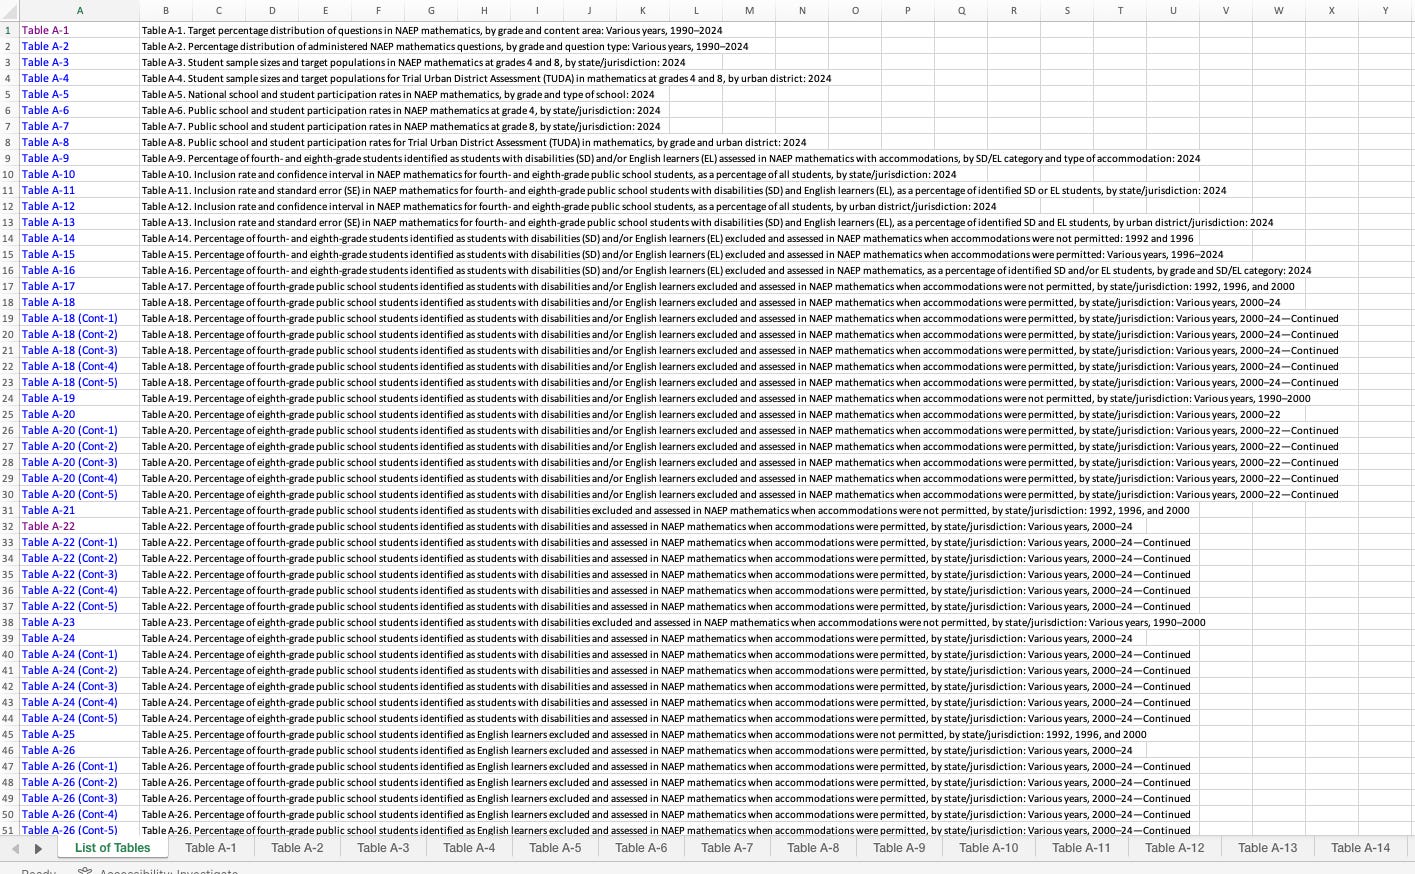
The National Report Card website offers transparency. Yeah like looking through a telescope the wrong way. What you see is a huge number of protected classes of students rigorously segregated out in an index of 96 tables. Each on has the following MadLib title in the following form
Table A-35. Percentage of [fourth-grade] public school students identified as [English learners (EL)] excluded and assessed in NAEP mathematics, [when accommodations were permitted] by [urban district/jurisdiction]: Various years, 2003–24
Here are the blanks:
{fourth-grade, eighth-grade}
{students with disabilities (SD), English learners (EL), }
{when accommodations were permitted, when accommodations were not permitted}
{urban district/jurisdiction, state/jurisdiction}
Oh by the way, those ‘various years’ are like {1992, 1996, 2000} So no not every year.
This is a transparency nightmare. This is 1996 level technology. Actually worse than that. I almost want to volunteer to get all of their data together, because there’s really not that much. But their website is just primitive. Those of you who know me know I want to help with all such data issues. I literally want to ask if they’ll pay me. We shall see. It took me 15 minutes to take a guess at which spreadsheets to download via a custom screen and another 10 minutes just to download
Here’s what I’m saying. You should be able to download the entire dataset, which cannot be more than I would guess, 200 MB and have a free full OLAP client running on your laptop and ask any question in English to an LLM that would generate SQL and automatically generate everything you wanted to know. I still don’t know what the actual numbers are. Fortunately Ian Rowe knew. For fourth graders it was between 17-25% of kids could do long division by the time they were in the fourth grade. OK? Pathetic. I’m a professional and I couldn’t get to that number from their website in an hour of digging.
This has to change.
PS. You know that I’ve been telling you that Musa al-Gharbi told me that 90% of American sociologists are only studying inequality. Now you can see materially how they publish their results.
No posts
Comments
Nothing yet. Say the first thing.
Sign in to join the conversation.