
Whether we are talking about it at the index level or in aggregate across indexes, sectors and/or stocks, new highs are an encouraging sign of strength. The reflect bullish underlying patterns and encourage optimism and the continuation of bullish behavior among investors. Investors anchor off of peaks (and troughs) but peaks are the final high in what is usually a series of new highs. Most new highs lead to additional new highs (this logic applies to new lows and troughs as well). When we see new highs, especially when accompanied by other new highs, we should be encouraged not concerned.
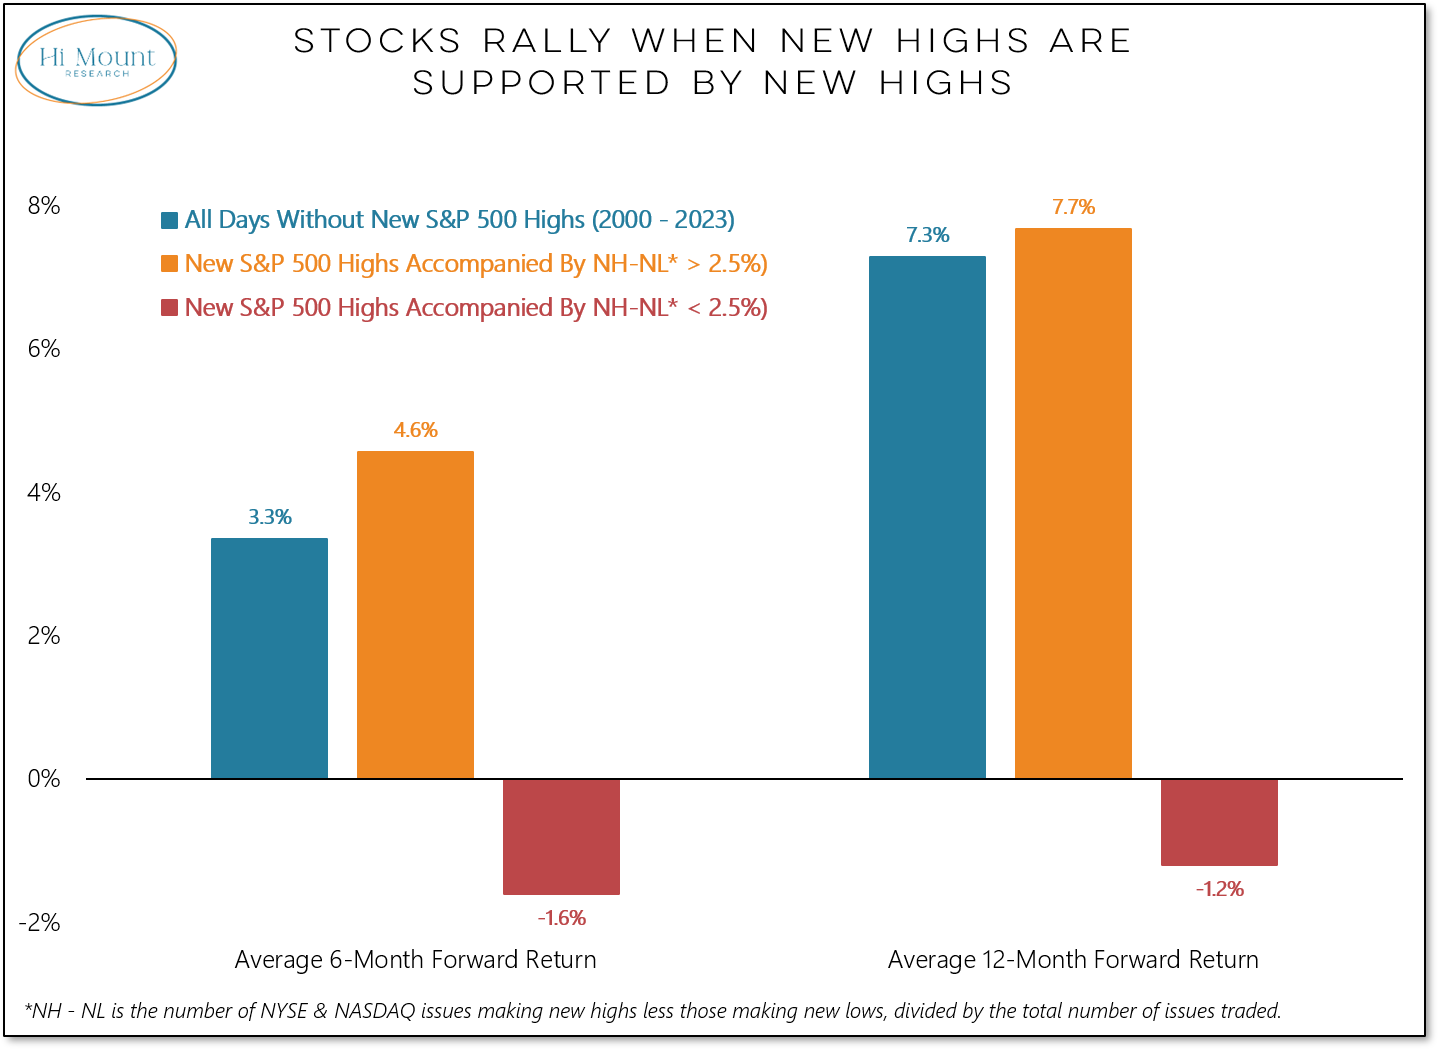
In that respect, after a week that saw stocks flirting with trouble, the S&P 500 rallying to multiple new highs last week was encouraging evidence that bulls are still in control. When supported by broad strength, days on which the S&P 500 makes new highs tend to be followed by more strength than days on which the S&P 500 does not make new highs). More on that caveat in just a minute.
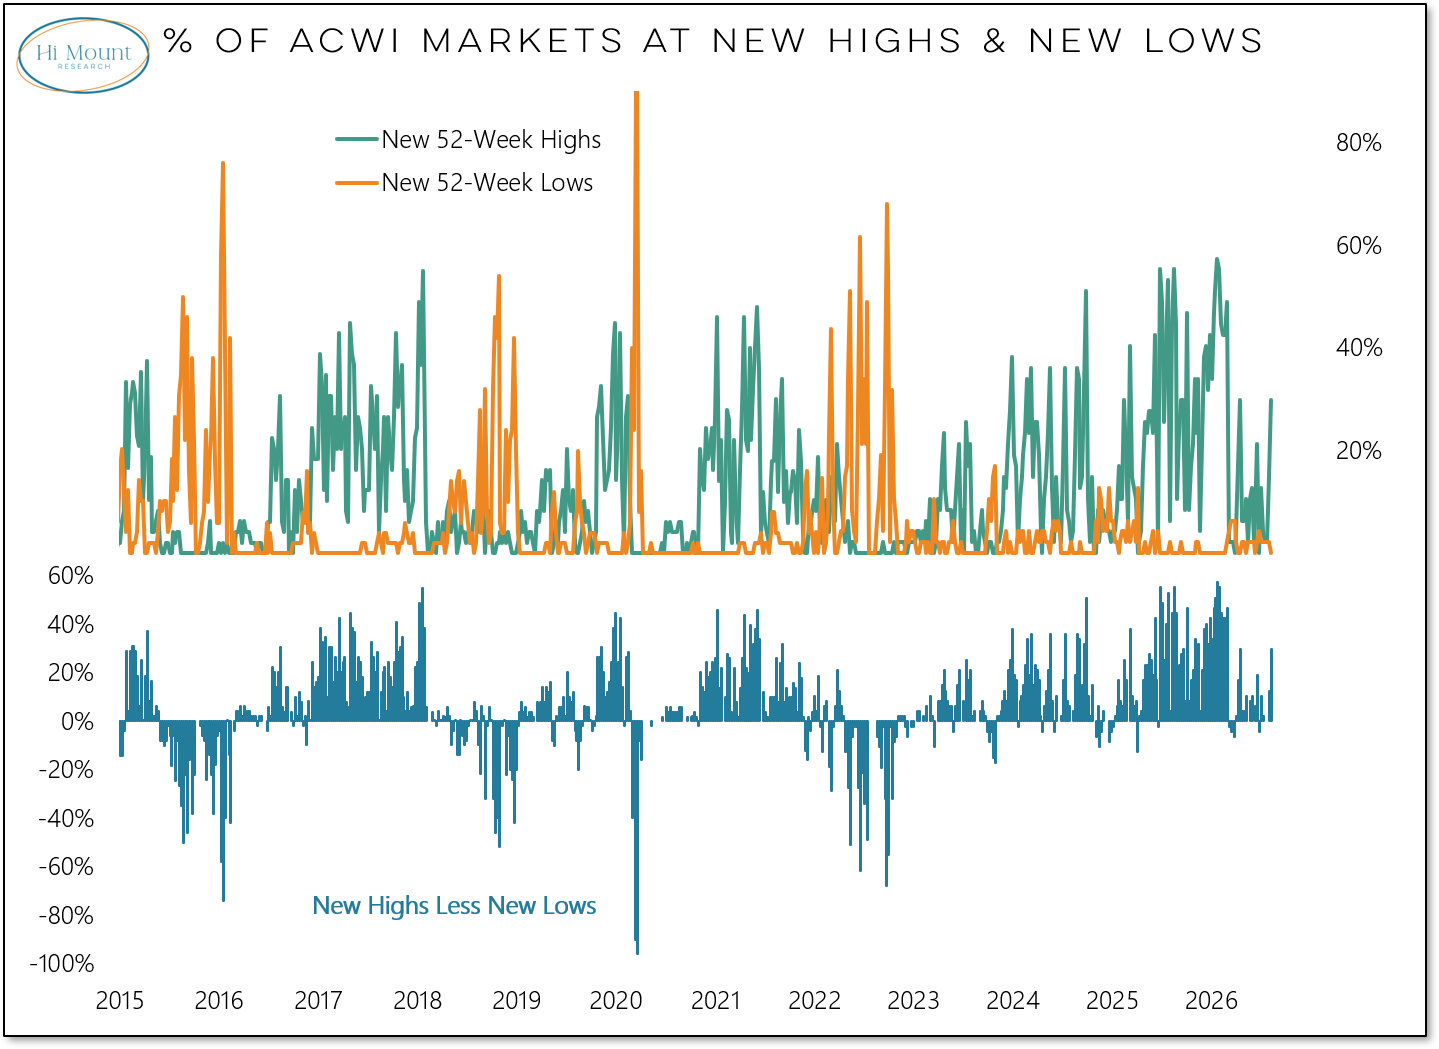
It was not only the S&P 500 that was climbing to new highs last week. More than one-third of markets around the world made new 52-week highs, the best showing since February. The percentage of US industry groups making new highs also expanded.
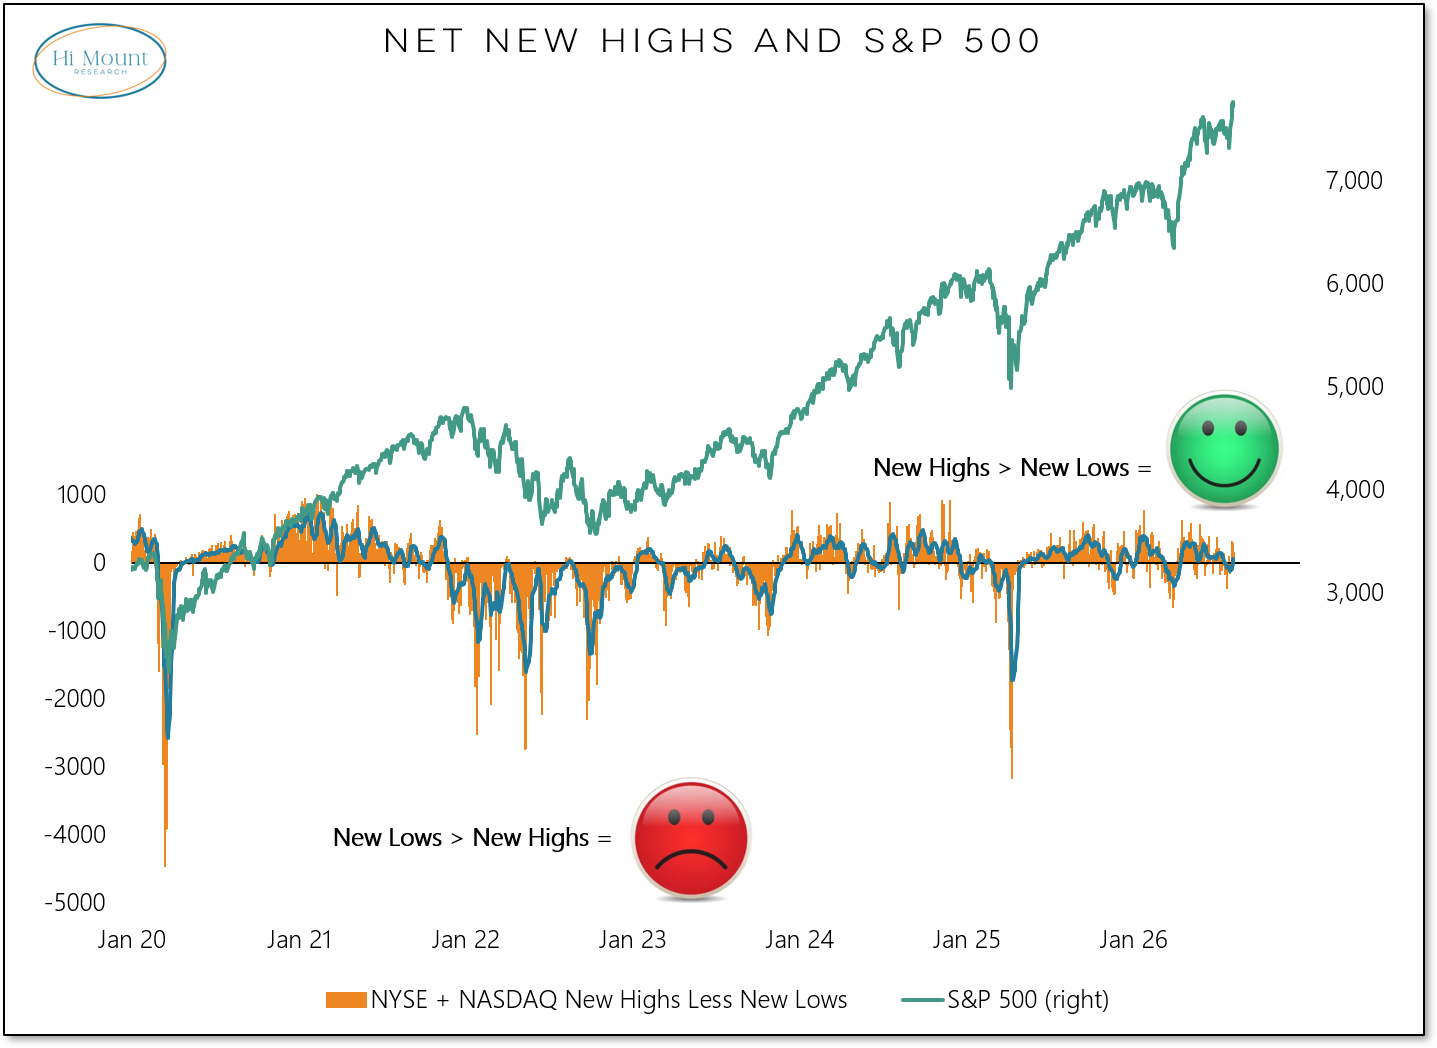
More individual stocks made new highs last week than new lows and the 10-day trend also turned positive. The puts a smile on our face and also returns our tactical Fear or Strength Model back to its bullish mode. The total number of stocks making new highs versus those making new lows, however, has not surged.
This brings into play the caveat that we mentioned above. The red bars in our first chart this week are missing in most of the popular analysis that looks at what happens after the S&P 500 makes new highs. For one reason, it can complicate an otherwise convenient narrative. For a second reason it is relatively rare. For both of those reasons its worth paying attention to. New index-level highs that are not accompanied by broad strength (as measured by net new highs) are an exception worth noting.
Of the two new highs by the S&P 500 last week, the first (on Wednesday) was accompanied by enough net new highs at the individual stock level to have unambiguously bullish implications. The second (on Friday) was not. This market could really use a breadth thrust right now to help resolve some of the breadth uncertainties - but that has not been forthcoming.
The weekly net new high data shows the tension. Net new highs are back in positive territory but have not broken out.
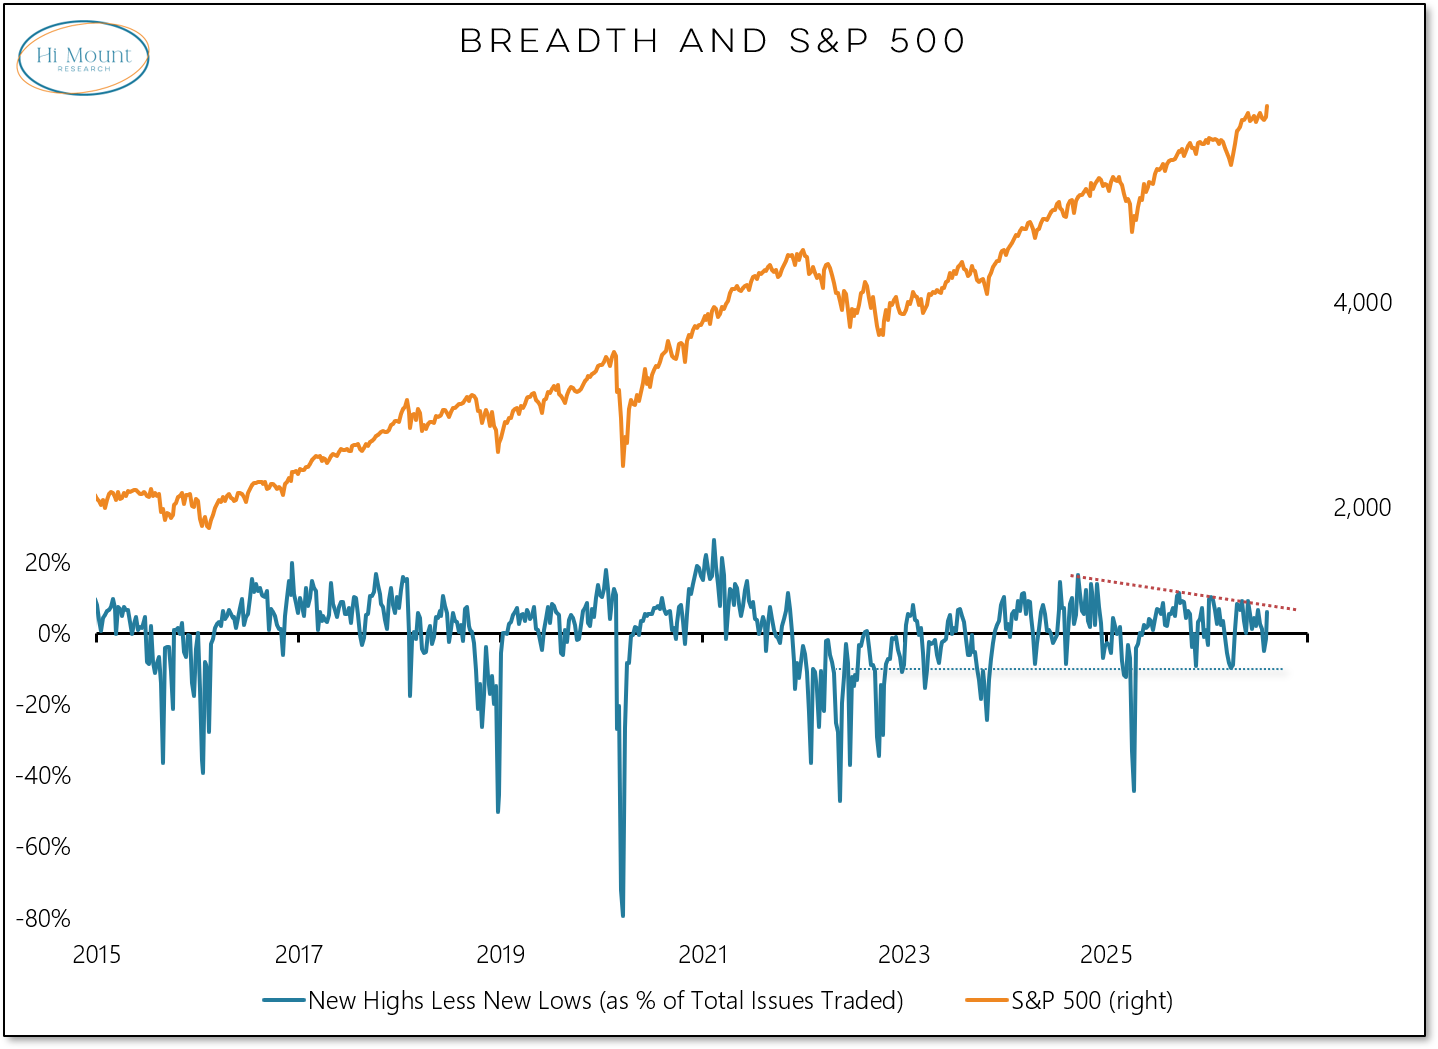
Still, the return of more stocks making new highs than new lows on both a daily and weekly basis is enough to confirm that the bull market continues to behave.
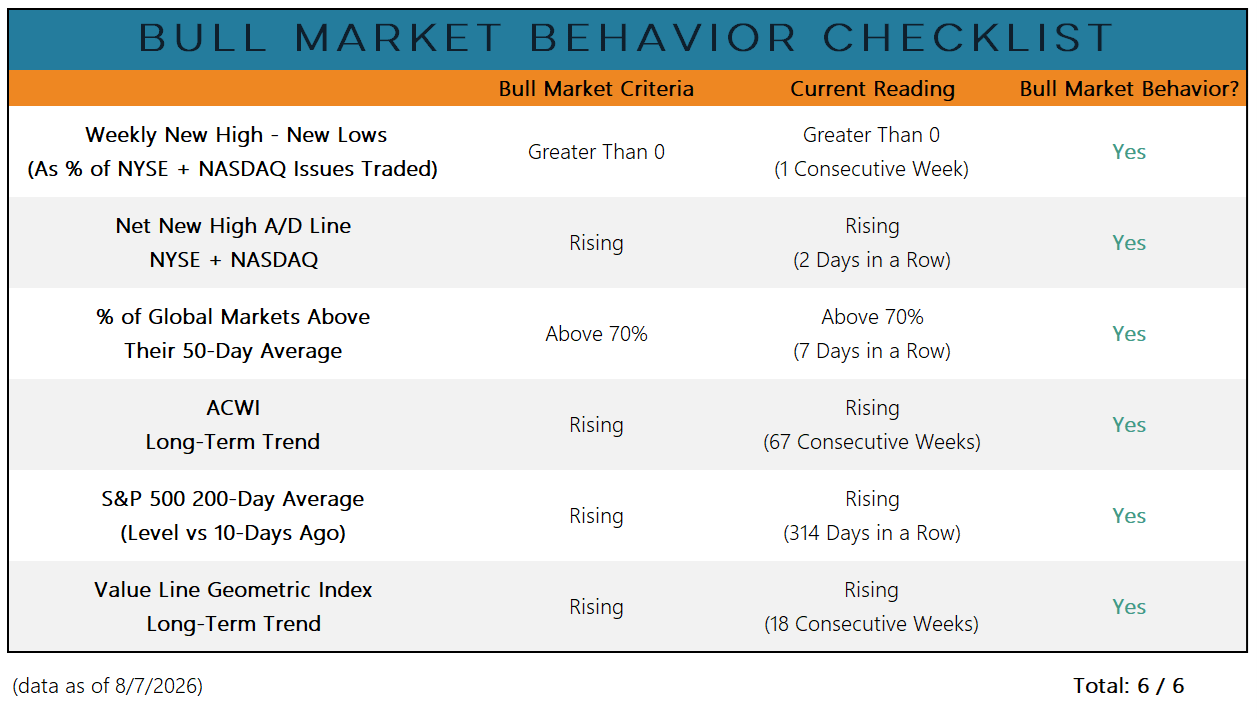
We see reasons for encouragement beyond just new highs. Two specific areas stand out:
Comments
Nothing yet. Say the first thing.
Sign in to join the conversation.