

I am reminded of something a professor once told me and my classmates: that there is no genetic test which could accurately describe someone’s biogeographical ancestry. Being an off-handed remark, it doesn’t really matter much. However, I worry that this lack of understanding is commonplace. Perhaps then, it is necessary to document the extent of racial differences. In this article, I will do so.
Firstly, Rosenberg et al. (2002) is the oldest study on this subject of which I am aware. Theoretically, it’s quite problematic, but the result is interesting nonetheless. The theoretical problem is that SIRE (self-identified race/ethnicity) information is not collected, and so it can not be said for sure that the genetic clusters identified herein are consistent with SIRE categories. That is the biggest problem with cluster analysis: although SIRE are distinct clusters, there are also distinct clusters for non-SIRE categories (e.g., German, Norwegian, British, etc.). I will elaborate on this point later on. Despite that, however, it is interesting that genetic clusters are clearly formed.
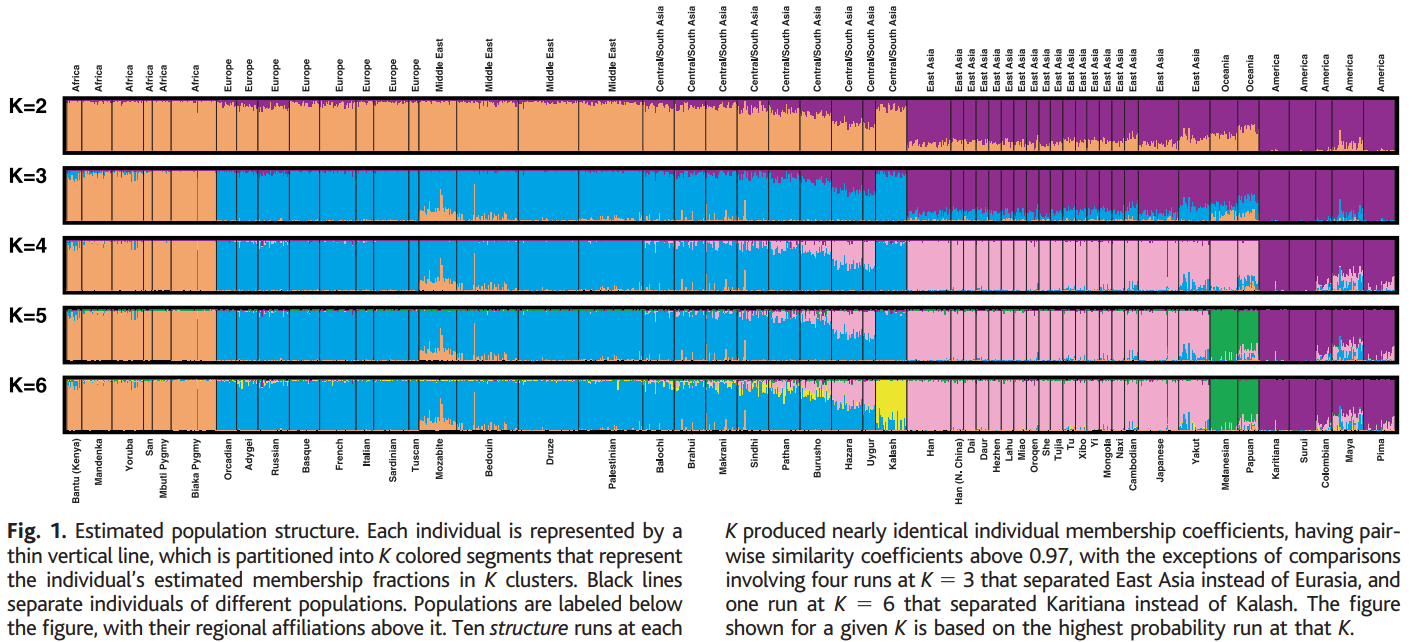
Another aspect of Rosenberg et al.’s study, which a critic may point out is that only 3–5% of the included SNPs were found to be population-specific. This is a fair transition into discussing Edwards (2003), which is the article known for having originated the most mainstream method of racial and ethnic classification. That is, by comparing frequencies of common SNPs rather than comparing specific SNPs. After comparing the frequencies of only twenty SNPs, classification accuracy rose to 99%. It’s worth noting here that there are thousands of SNPs at various loci, but only twenty were needed to achieve this result.
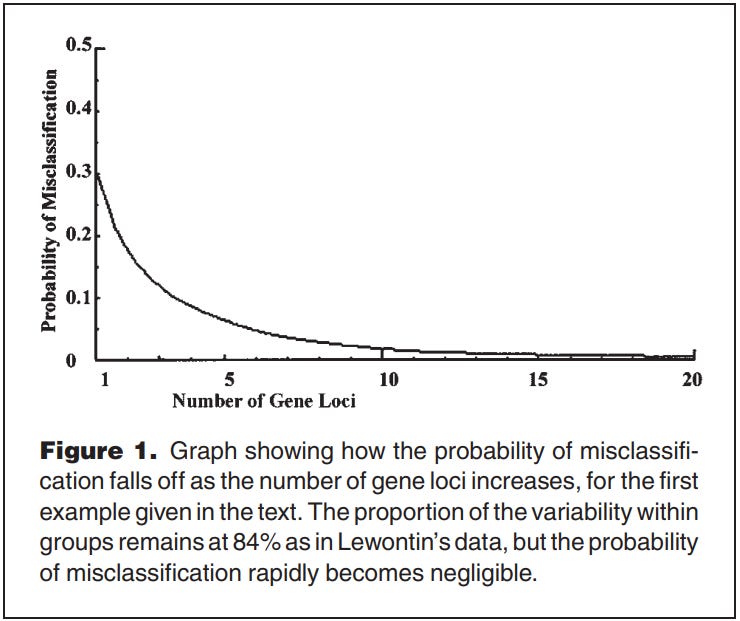
In other words, substantial and identifiable group differences exist even when few population-specific SNPs are identified.
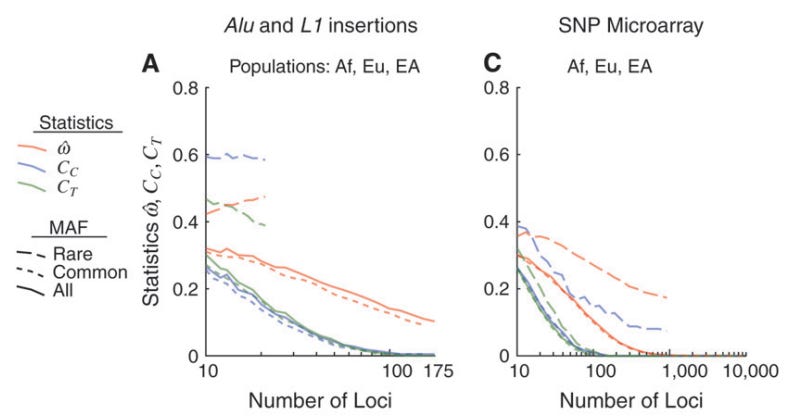
Building on this logic, Witherspoon et al. (2007) addressed the frequency (ω) with which a pair of random individuals from two different populations is genetically more similar than a pair of individuals randomly selected from any single population. This study is almost a direct response to the argument that within-group variation is so large that racial classifications are biologically meaningless. As shown in their SNP Microarray data (Figure 2, Graph C), the probability of an individual being more similar to someone in a different population (ω) is around 30% when only 10 loci are sampled. However, as the number of loci increases, this probability drops sharply. When using 1,000 or more SNPs, the value of ω reaches effectively zero.
Adding on, Bamshad et al. (2004) compared differences in the frequencies of 50,736 SNPs in racial groups found in the United States. Particularly, among “African (n = 20), Asian (n = 19) and European–American (n = 20)” participants. The main finding is that “The mean accuracy of allocation improves to 99–100% with the use of a modest ~100–160 markers” (p. 601). Bamshad et al. is quite fatally limited in that the sample size in small enough such that the degrees of freedom may be so inadequate that the distribution is distorted. However, I include it here only because its main finding is consistent with better research (i.e., those I’ve already referenced and those I have yet to, such as …).
Additionally, Tang et al. (2005) compared the genetically derived ancestry of 3,636 participants to their SIRE group. This is probably the most known study that I’m including herein, and like the rest of this research, SIRE is consistent with genetic differences in 99.86% of participants.
For the group reporting a major SIRE category, the correspondence between genetic cluster and SIRE is remarkably high, with only 5 (0.14%) of 3,636 individuals being differentially classified (table 2). Accordingly, in this case, major SIRE category and genetic cluster are effectively synonymous (p. 271).
By “major SIRE category”, Tang et al. are referring to Caucasian, African, Hispanic, Chinese, and Japanese. Likewise, this level of accuracy was derived from 326 SNPs. Similarly, in a sample of “270 individuals from four different populations: Yoruba in Ibadan, Nigeria (YRI); Japanese in Tokyo, Japan (JPT); Han Chinese in Beijing (CHB), China; and Utah residents with ancestry from northern and western Europe (CEU)”, Allocco et al. (2007) predicted their SIRE with 95% accuracy from merely 50 SNPs.
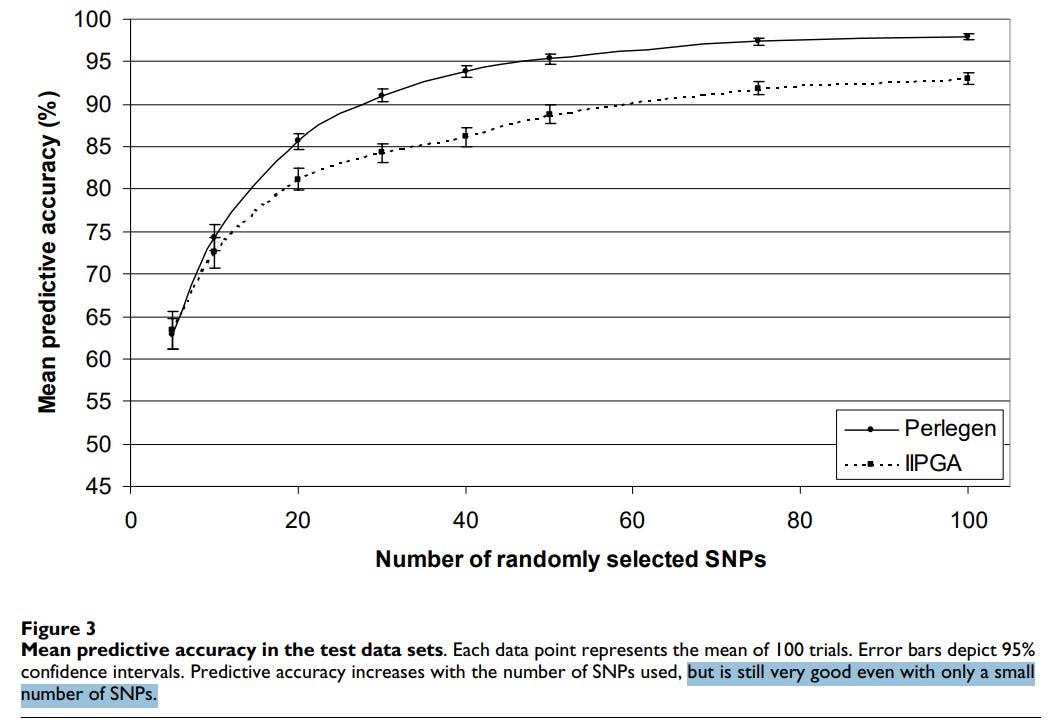
As is shown in this table, the prediction of SIRE in the IIPGA dataset is much lesser than in the Perlegen dataset. That is because the sample sizes in the IIPGA dataset are so small that the distribution is likely distorted; remember what I wrote about degrees of freedom earlier.
The second test data set consisted of 4,124 SNPs genotyped as part of the Innate Immunity Program for Genomic Applications (IIPGA) and made publicly available on their website [25]. Nine individuals in this data set were also excluded from the analysis because they were genotyped in the HapMap Project. This test data set therefore included data for 24 African-Americans and 14 European-Americans (p. 2).
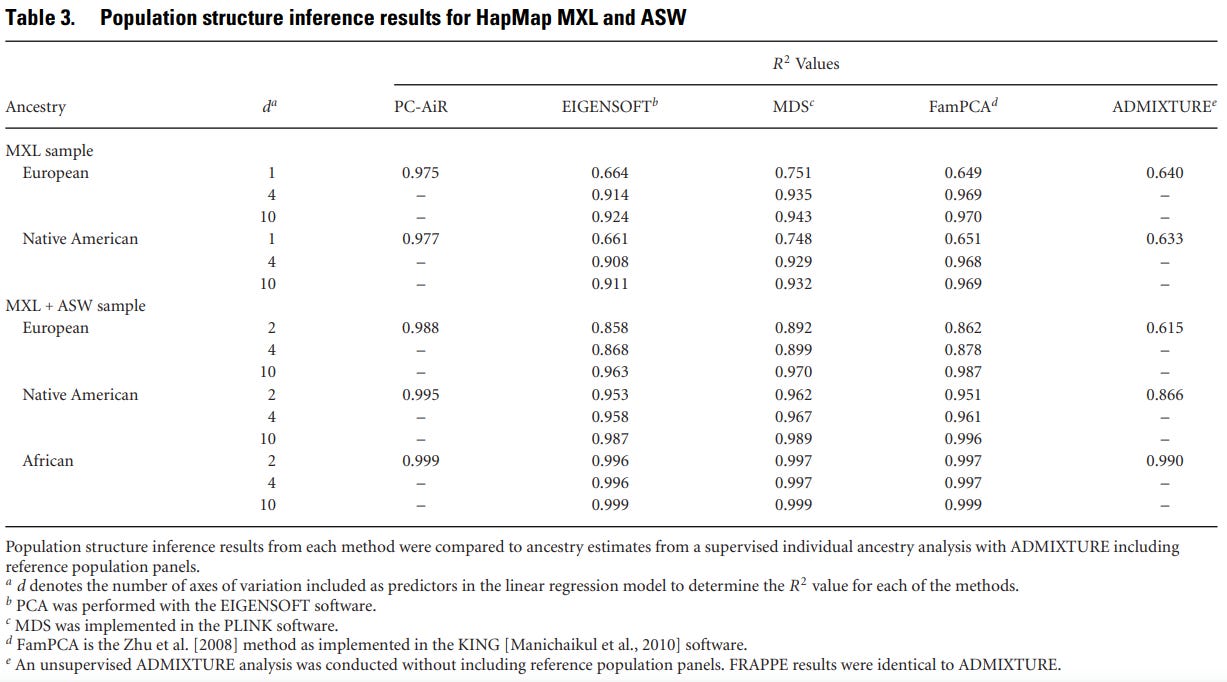
Meanwhile, Conomos et al. (2015) originated a method called PC-AiR, which is similar to cluster analysis except it doesn’t require differentiating specific SNPs and common SNPs (pp. 277-278). From two datasets (n = 800) with 150,872 common SNPs included in the analyses, it was found that PC-AiR could predict SIRE with 98% to 99% accuracy with only 2 axes of variation whereas the other methods required up to 10 axes to be similarly accurate.
Guo et al. (2015) is certainly the best study on this subject. I say this because (1) Guo et al. utilized two different samples in an attempt to replicate their results and (2) both of said samples are very large: “the College Roommate Study (N = 2,065) and the National Longitudinal Study of Adolescent Health (N = 2,281)”. The SIRE category of white is found to have 99% accuracy with genetic differences in both samples.
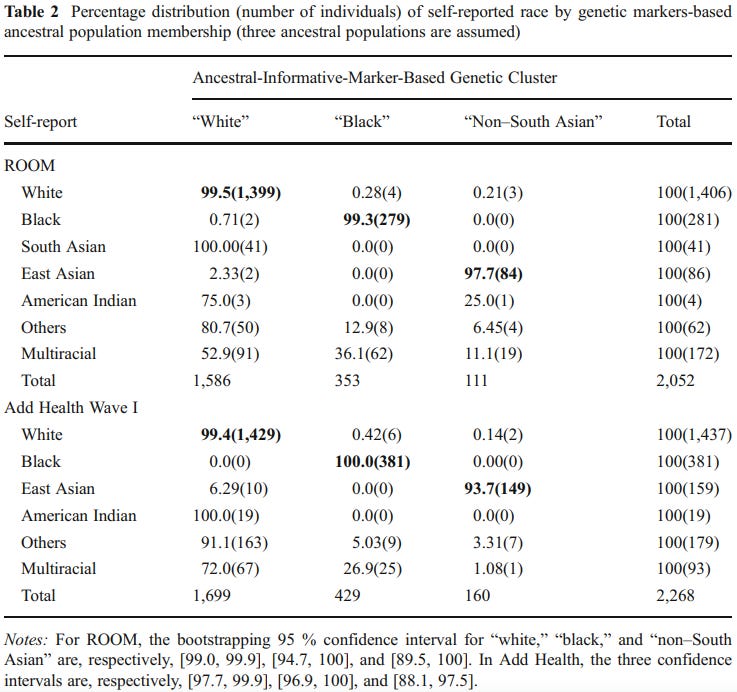
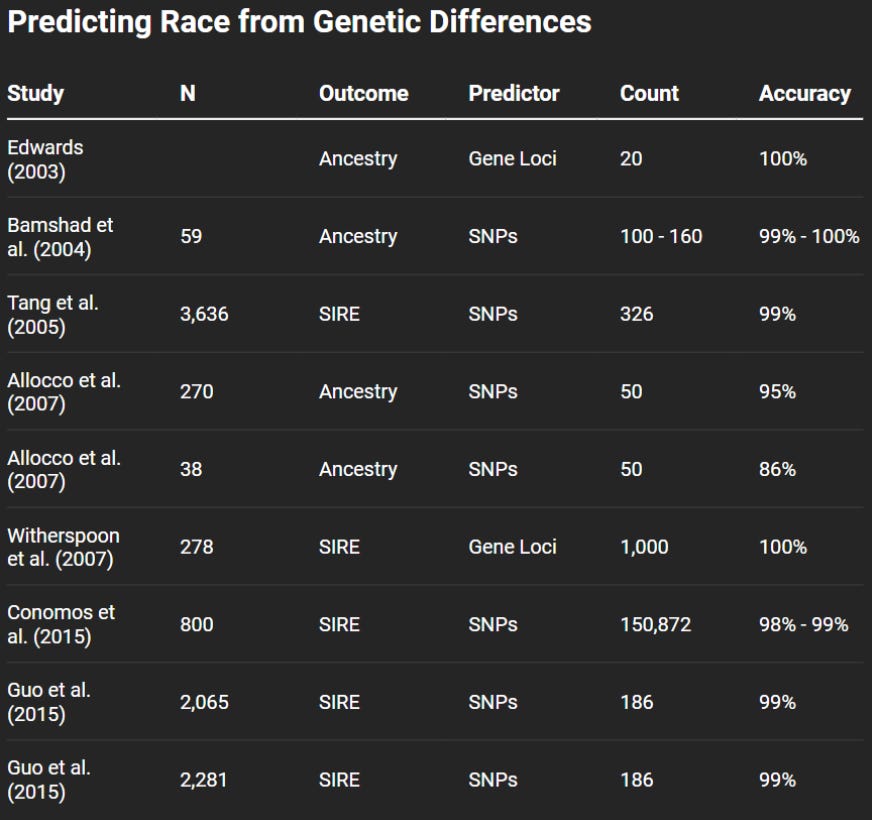
In the end, Guo et al. concluded that although some racial categorizations are invalid, others are valid. In other words, that “Race is, indeed, multiple and fluid, but not all identifications of race are equally constructed. Some deviate more and some less from bio-ancestry”. So although the categories of white and black are valid, the categories of American Indian and South Asian are not. Moreover, they also conducted cluster analysis, finding that SIRE categories are distinct clusters (Figure 2). So, to summarize the research described so far, see the following table.
Critics of this research have argued that because the studies cited above do not include mixed-race participants that classification of mixed-race people will be inaccurate. This is an assumption, although I confess that it has not been tested very much. There is only one article I know of that is specifically about mixed-race people. Kirkegaard (2021) is a study similar to most cited above. Regarding people who are not mixed-race, Kirkegaard’s results are theoretically consistent with everything referenced above (n = “571 Whites, 140 Blacks, 25 mixed”).
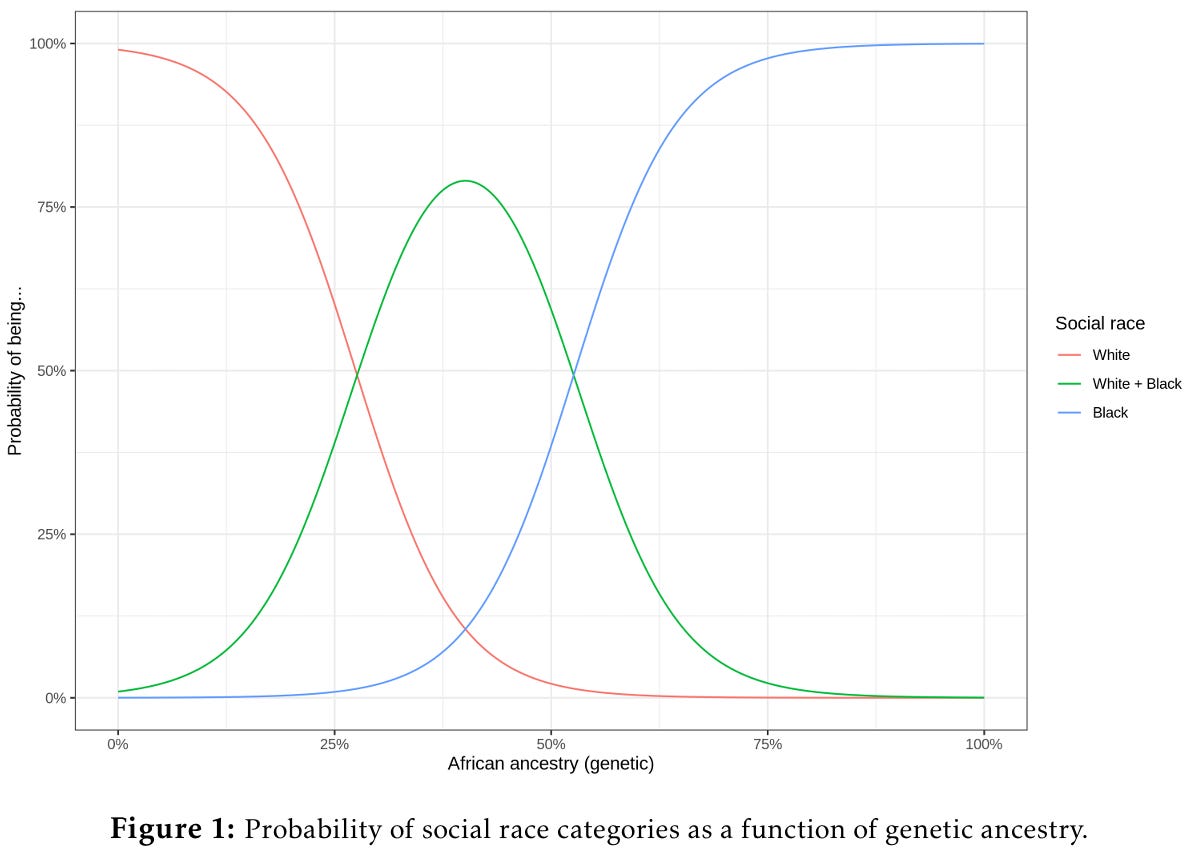
The n = 25 is quite small, however. Recall what I wrote about degrees of freedom. That is a big problem since sample sizes smaller than 30 could have distorted distributions, which seems likely in this instance because the highest probability of being mixed-race reported here is 80% among those with 50% African ancestry. So Kirkegaard’s results for mixed-race people are probably inaccurate. There are no other studies I could find which are about mixed-race people specifically. However, I will note that the vast majority of people are not mixed-race, and so we should not dismiss the research on racial categorization simply because there is not much research on mixed-race people as of yet.
Earlier on, I said that cluster analysis is not relevant to this section on the basis that both SIRE and non-SIRE categories are distinct clusters. Another reason to be critical of cluster analysis is that it is derived from principle component analysis, which reduces complex information down to only two axes, so as to circumvent statistical complexities.
With a large number of variables, the dispersion matrix may be too large to study and interpret properly. There would be too many pairwise correlations between the variables to consider. Graphical displays may also not be particularly helpful when the data set is very large. With 12 variables, for example, there will be more than 200 three-dimensional scatterplots.
To interpret the data in a more meaningful form, it is necessary to reduce the number of variables to a few, interpretable linear combinations of the data. Each linear combination will correspond to a principal component.
Seeing as SIRE categories are perfectly genetically distinguished with a small number of SNPs, there is obviously no reason to reduce this data down to only two principle components (for further elaboration on this point, see Thuletide, 2022). With that acknowledged, it is interesting that both SIRE (e.g., Liu et al., 2006; Li et al., 2008; Xing et al., 2010; Gyawali et al., 2023) and non-SIRE (e.g., Gillet et al., 2004; Chen et al., 2025) genetic clusters are clearly identified with only two principle components. The final point to raise regarding cluster analysis is that SIRE categories are more genetically distinguished than are non-SIRE categories.
Additionally, because the boundaries among groups are fuzzy, the number of human groups is flexible. The sharpest divisions are at the continental level (e.g., Africans, Europeans, Asians), but genetic research has shown that these groups can be broken down into smaller, more local groups (Shiao et al., 2012; Tishkoff et al., 2009). For example, Italians and Norwegians can be distinguished from one another in genetic ancestry tests; this does not mean that the racial group of “Europeans” does not exist or that “Europeans” is a useless categorization. There is no set number of racial or ethnic groups in the world; different levels of analysis will produce different numbers of groups of people with a shared ancestry (Novembre & Peter, 2016; Winegard, Winegard, & Boutwell, 2017). Sometimes, it will make sense to classify people into a small number of groups, each with many people in them (e.g., continent-level races). At other times, it will be beneficial to classify individuals into smaller, more local groups at the regional level (Warne, 2020, p. 205, emphasis added).
It is also worth noting that while racial boundaries are not perfectly discrete, they are also not perfectly continuous or clinal. Genetic distances between major clusters are often significantly larger than what would be predicted by simple geographic distance alone. This phenomenon is largely driven by major geographic features (e.g., the Sahara Desert, the Himalayas, and various bodies of water) which act as significant barriers to migration. For example, the genetic impact of crossing the Sahara is massive; when properly corrected for within-population comparisons, crossing this barrier is equivalent to roughly 10,000 km of geographic distance. To put that in perspective, crossing the Sahara represents a genetic distance worth approximately half of the Earth’s circumference. These ‘migration troughs’ align with these physical barriers, resulting in genetic clusters that are more distinct than a purely distance-based model would suggest (Angleton, 2024).
In response to the above, I suspect that a hypothetical person may respond to me by saying something like “genes are a trait that you cannot see when speaking with another person, and so you should not assume someone’s race during an interaction”. However, race does affect physical traits. One study on this is by Relethford (2009), who documented racial differences skull shape.
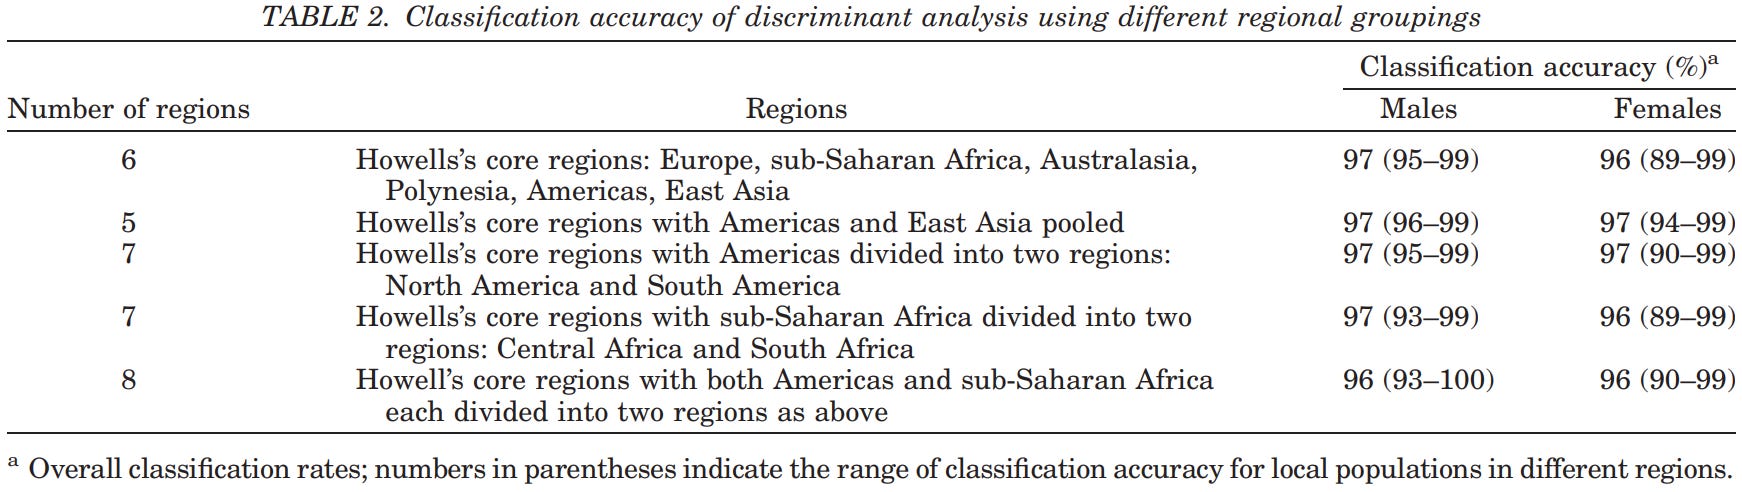
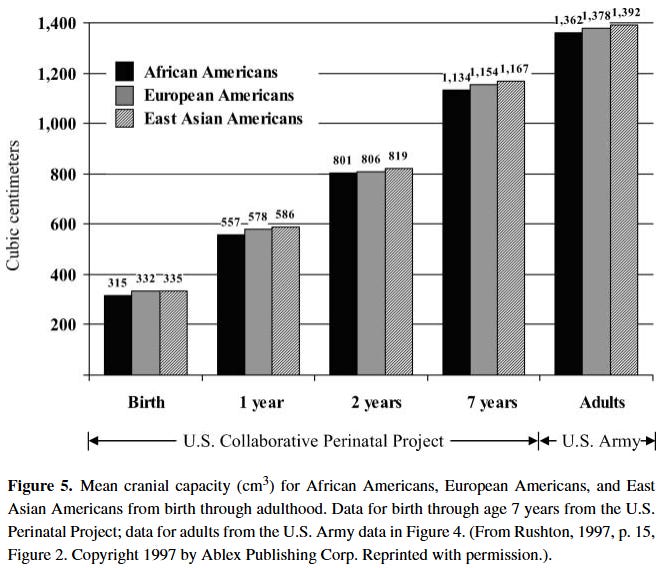
Racial groups were classified by differences in skull shape with 96–97% accuracy which is also a finding of Ousley et al. (2009). Another noteworthy aspect, although small, is that there are statistically significant differences in skull size (within sex category, obviously).
Some of the most obvious traits present in Europeans but not in other SIRE groups are differences in hair color and eye color. Firstly, Han et al. (2008) conducted GWAS on four samples of European women totaling 9,325 participants, most of which were either control groups or replication samples. The true sample size is 2,287 women. 38 SNPs were found to be correlated with differences in hair color, although 7 of these were subject to linkage disequilibrium decay (i.e., not all ethnicities included are affected equally). After removing those, it was found that the same SNPs which are correlated with blondness are also correlated with red hair.
Twenty-two of these 30 SNPs showed very strong evidence for association with natural hair color (p<9.5×10−8 = 0.05/528,173) in a pooled analysis of the initial GWAS and the validation sample (Table 3). Of the remaining eight SNPs, three showed very strong evidence for association with hair color either after excluding women with red hair or when comparing women with red hair to those without (Table 3).
The same SNPs which are correlated with differences in hair color are also correlated with differences in eye color, skin color, and tanning ability. Unfortunately, polygenic scores are not reported. The same problem is evident in Lin et al. (2015); polygenic scores are not reported. In other GWAS, however, polygenic scores are reported. For example, Simcoe et al. (2021) find that “In Europeans, the 112 autosomal SNPs identified through conditional analysis (all autosomal SNPs shown in table S1) explained 99.96% (SE = 6.5%, P = 4.8 × 10−279) of the liability scale for blue eyes (against brown eyes)”, whereas those same variants in Asians are correlated with variations of brown eyes. It is also stated upfront that differences in hair color is “one of the most recognizable visual traits in European populations and is under strong genetic control”, according to Hysi et al. (2018).
In response to the above, I suspect that a hypothetical person may respond to me by saying something like “so your saying that race only affects genes and some physical traits. However, these traits have no bearing on personality and therefore neither of these matter”. However, there are racial differences in psychological traits.
The first and most obviously differing psychological trait to discuss herein is intelligence. Indeed, it is quite easy to find that the existence of racial differences in intelligence is acknowledged in the mainstream. For example, based on an edited book commissioned by the National Research Council and including chapters from nineteen researchers, Wigdor (1982) reported the following.
Research evidence does not support the notion that tests systematically underpredict the performance of minority group members. There are certain important exceptions to this generalization. One cannot give a Spanish-speaking child an English-language test and expect the scores to mean the same as those of a native English speaker. But the research evidence does not support the frequent contention that tests are unfair because they underpredict the performance of certain subpopulations. In this sense, tests are not biased and can be called “fair.” … The rather large differences in average performance on most ability tests between blacks and whites, for example, will tend, when test scores dominate a selection process, to screen blacks out of jobs and into special education programs. Because of the exclusionary effects of tests, they are no longer simply the concern of the employer or a matter of school policy (p. 7).
fourteen years later, Neisser et al. (1996) reported the same thing based on more recent research. According to Neisser et al., “Although studies using different tests and samples yield a range of results, the Black mean is typically about one standard deviation (about 15 point) below that of Whites (Jensen, 1980; Loehlin et al., 1975; Reynolds et al., 1987). The difference is largest on those tests (verbal or nonverbal) that best represent the general intelligence factor g (Jensen, 1985)” (p. 93). Therefore, this seems commonly known. There is much controversy over whether the differences in intelligence are mostly genetically caused or mostly environmentally caused, however, discussing that controversy is beyond the intent of this article.
A noteworthy criticism of the conclusion that races differ in intelligence is the claim that intelligence tests are racially biased against nonwhite people. Both of the above sources deny this claim; and yet it maintains prominence among some critics of intelligence testing. There is quite a lot to say about test bias, and although the research therein is more vast than I could possibly summarize here, the most comprehensive review of this research that I’ve seen has been by Reynolds & Suzuki (2012). They summarized research on (1) differential predictive validity, (2) differences in rank-order item difficulty, and (3) tests of measurement invariance, concluding that all three of these lines of evidence contradict the claim of test bias. Actually, regarding differential predictive validity, they concluded there to be “no predictive bias, or small bias against whites, in predicting grade point average and other measures of college performance” because of a pervasive over-prediction in outcomes for nonwhites.
The second psychological trait to discuss herein is self-control. For example, Li (2005) reports that white (n = 158) criminals have the most self-control, followed by Hispanic (n = 111) and then black (n = 263) criminals.
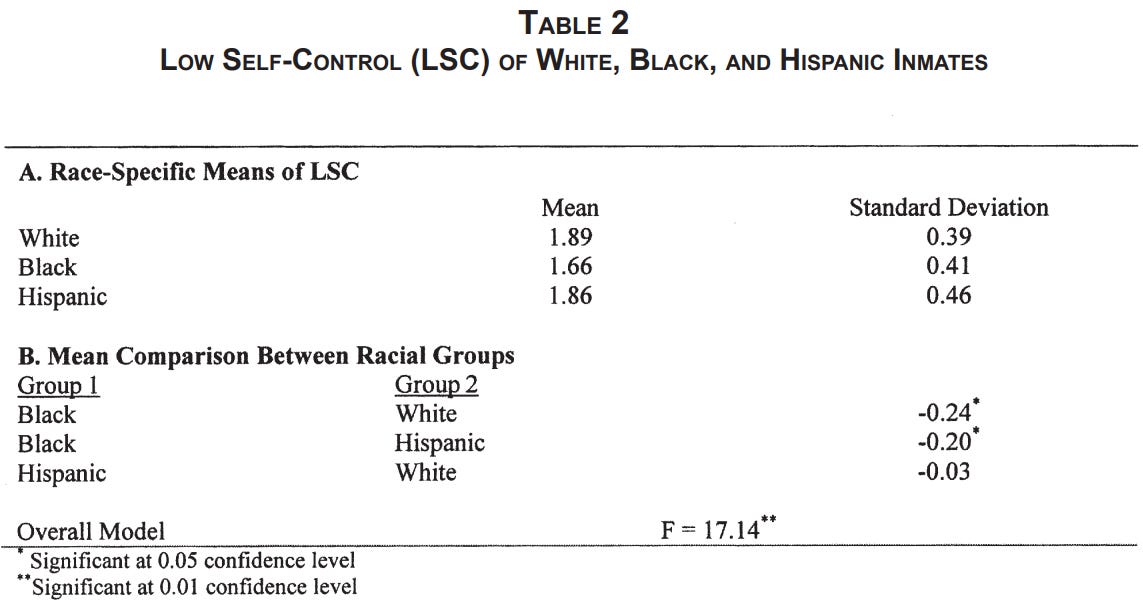
However, another study by Fix et al. (2021) found neither statistically nor practically significant differences in self-control between white adolescent criminals and black adolescent criminals. Ward et al. (2018) found that among (N = 2271) prisoners, “While nonwhites have greater self-control than whites, they have more volatile tempers” (p. 39), although the specific races which make up the nonwhite category here are not reported. So research on criminals is very mixed. But what about research on non-criminals? Several studies have found black children to take the immediate reward whereas White children take the delayed reward (e.g., Zytkoskee et al., 1971; Price-Williams & Ramirez, 1973; Herzberger & Dweck, 1978; Castillo et al., 2011; Andreoni et al., 2019). Similarly, in a study on adults, Warner & Pleter (2001) report that “blacks are estimated to be significantly more likely to take the lump sum than other nonwhites while whites are significantly less likely” (p. 47), implying there to be differences in self-control.
The third noteworthy trait to discuss in this section is psychopathology, which is measured by the Minnesota Multiphasic Personality Inventory. To start this section off, McDonald & Gynther (1963) compared white (n = 263) and black (n = 354) adolescents. They found that “Negroes got significantly higher scores than whites on Scales L, F, 2, 5, 8, and 9” and, interestingly, that social class had no effect on racial differences in any MMPI subscale.
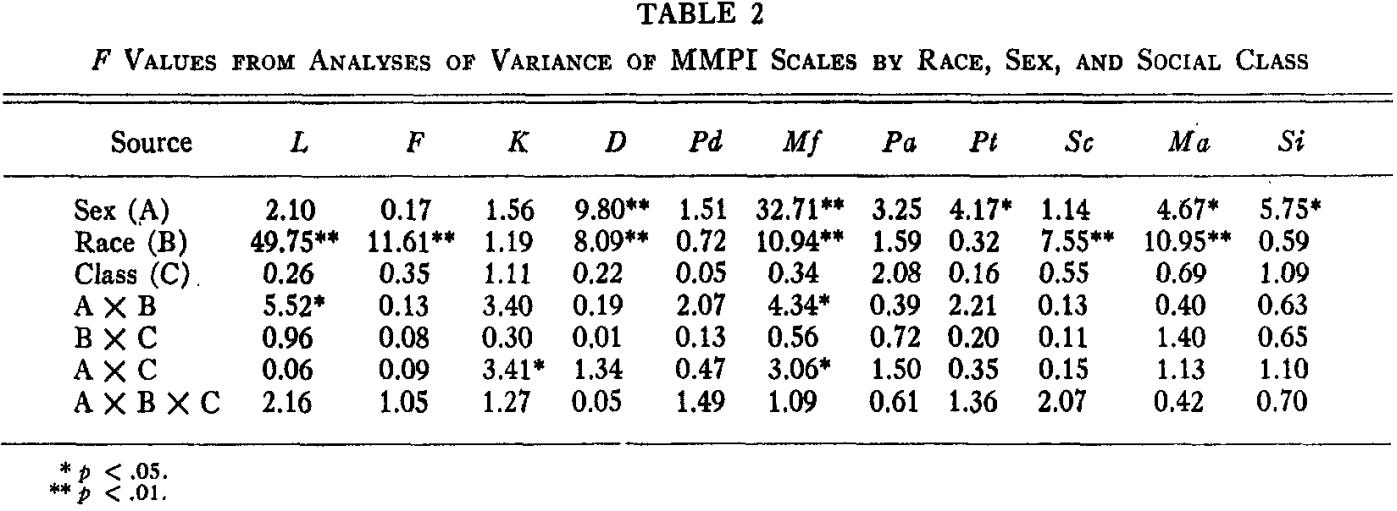
Many other studies finding these kind of results are reported by Lynn (2019), particularly in the following table.
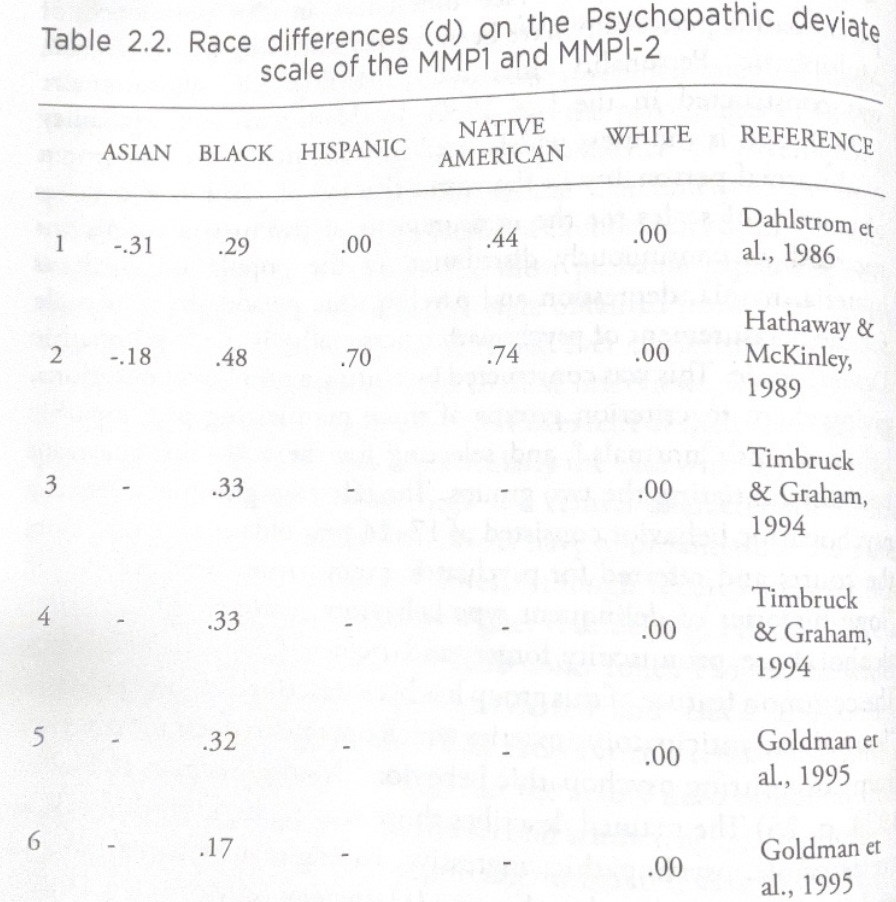
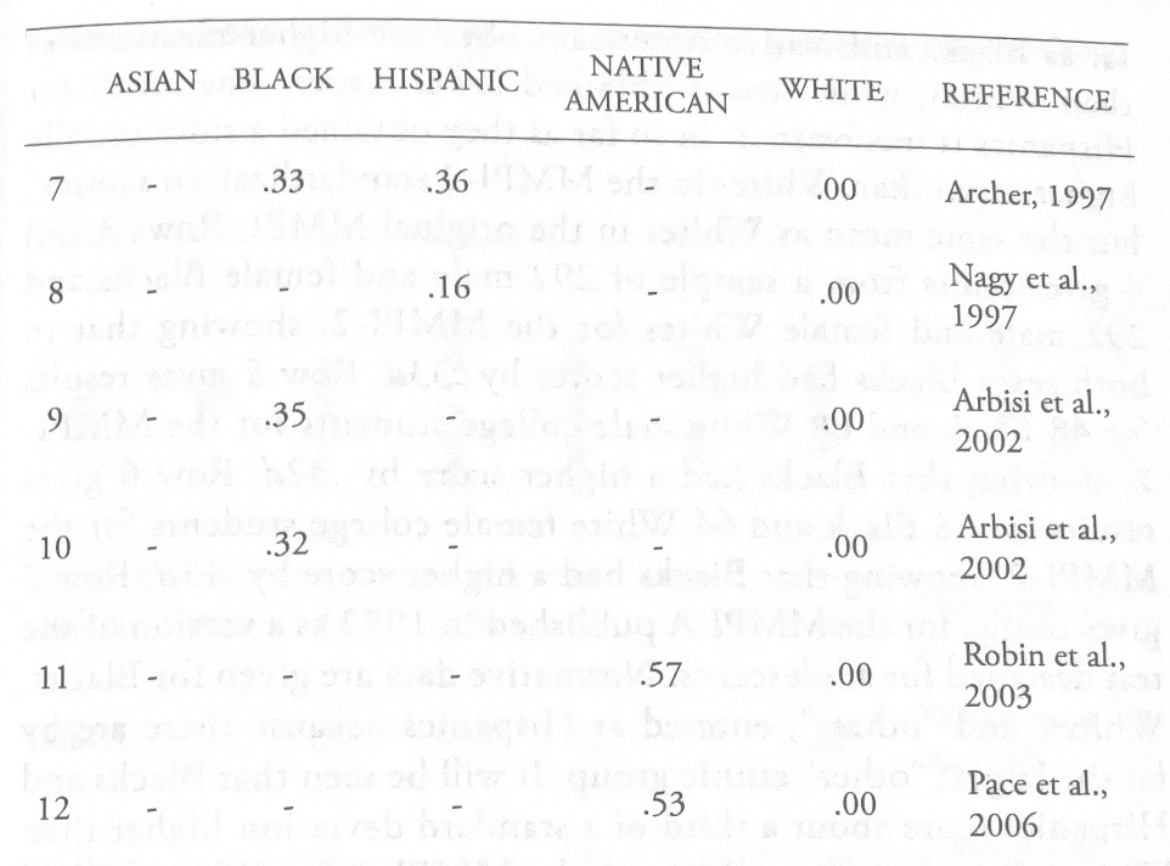
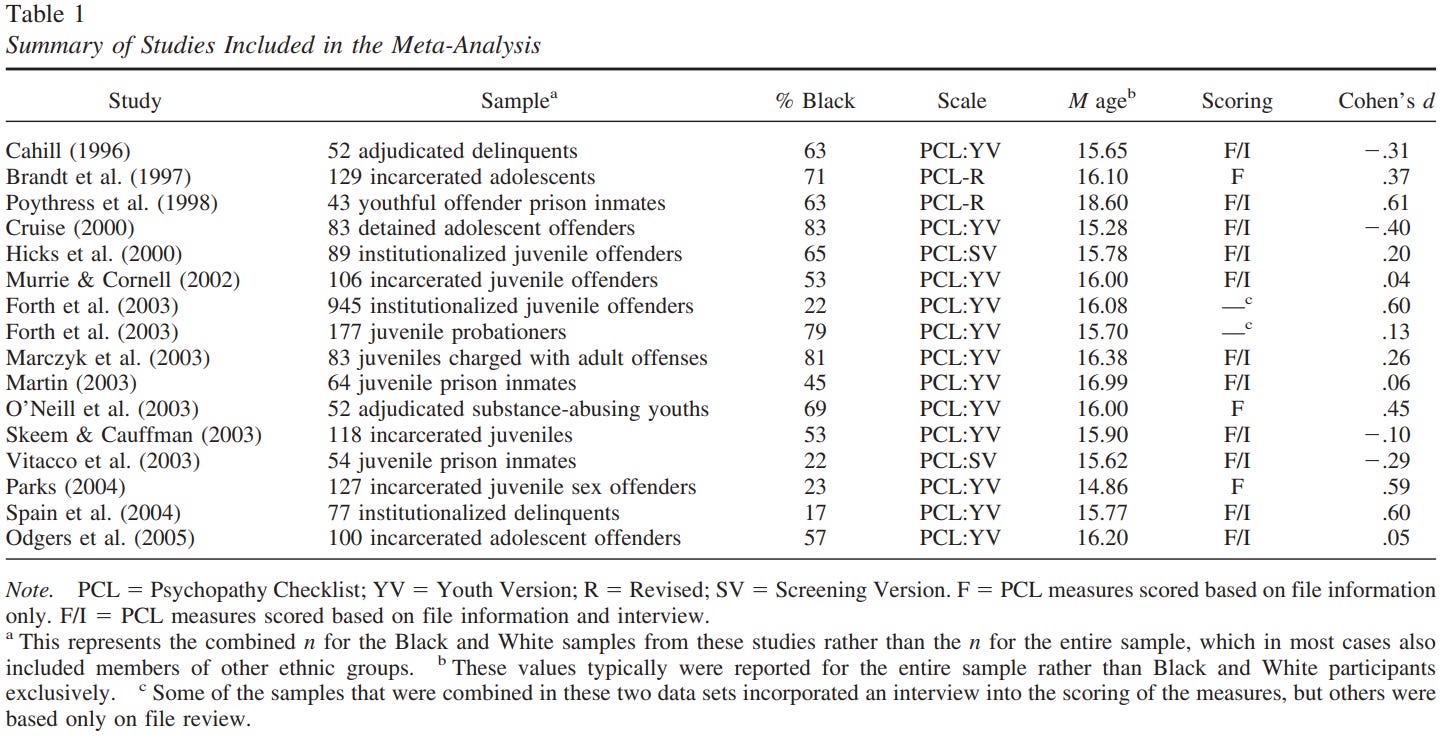
In his book, Lynn was using this data to explain racial differences in crime rates (e.g., Skardhamar et al., 2014; Becker & Kirkegaard, 2017)1 since differences in intelligence were not enough to explain them alone. Some researchers have argued that Lynn’s conclusion is flawed because some of the studies he referenced do not control for differences in SES, but Lynn (2003) explains that these other researchers confused the cause of psychopathy with the effect it has on behavior; a phenomenon called reverse causality. It is also worth noting that a meta-analysis by McCoy & Edens (2004) reported a small effect size between white and black adolescents. After correcting for heterogeneity through random effects meta-analysis, “The mean weighted effect size across these studies was .20, p = .03 (95% CI = .02–.37). These results suggest that, although black youths were rated as significantly higher in their level of psychopathic traits in the aggregate, the overall magnitude of this effect was very small (i.e., about 1.5 points on a 40-point scale)” (p. 389). However, McCoy & Edens are faced with the problem that most of their sample is incarcerated or institutionalized. Because of this, it is less representative than the samples included by Lynn. In order to understand why this is a problem, recall the mixed results for racial differences in self-control among criminals which I described earlier on.
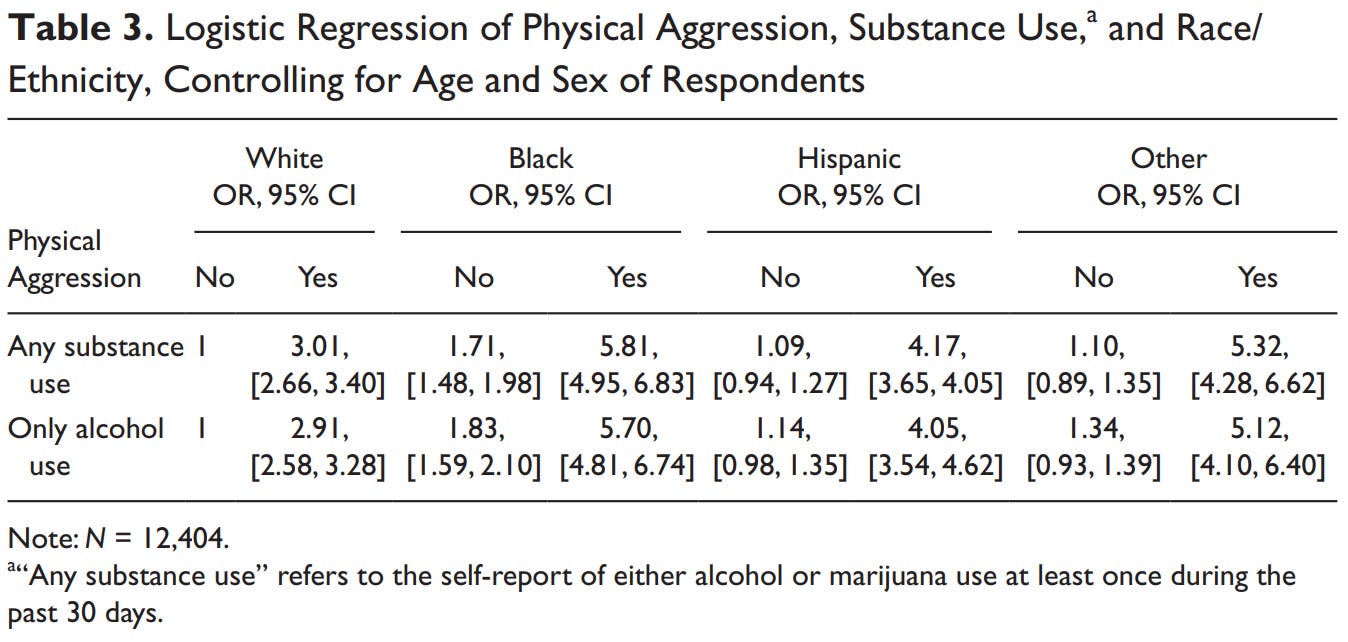
Anyways, this is a fair transition into the final psychological trait to summarize, which is aggression. Actually, I really cannot think of how I may summarize the research on aggression better than was done by Francis Black, and so I recommend reading his article on that. There are a few studies he did not mention, and so I will describe those. Firstly, Harris (1992, p. 207) found that (n = 24) black men reported engaging in significantly more violent behaviors than did white men whereas (n = 390) white men reported both insulting others and being insulted by others more often than did black men. Using data from the Youth Risk Behavior Survey in 2007, Mercado-Crespo et al. (2013) found that white high school students are the least aggressive compared to black students. Differences between white and Hispanic students were only statistically significant among those who consumed any addictive substance in the last 30 days.
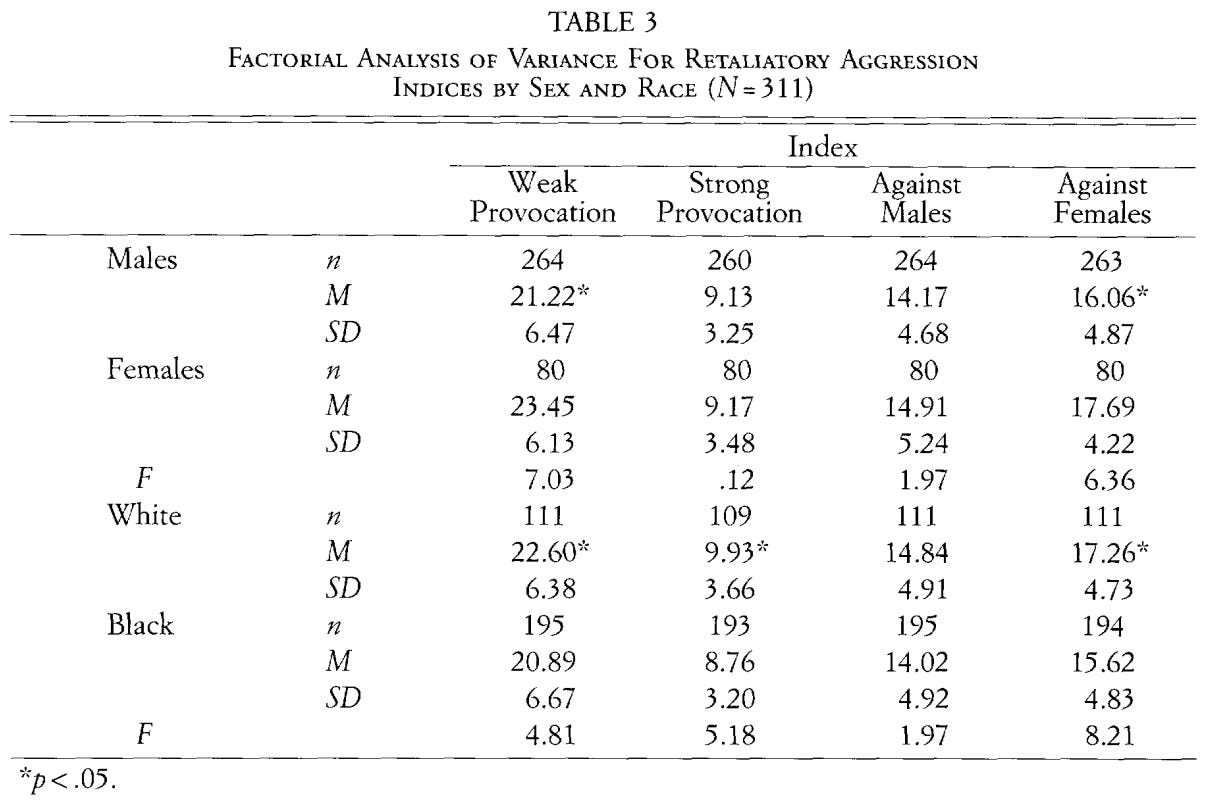
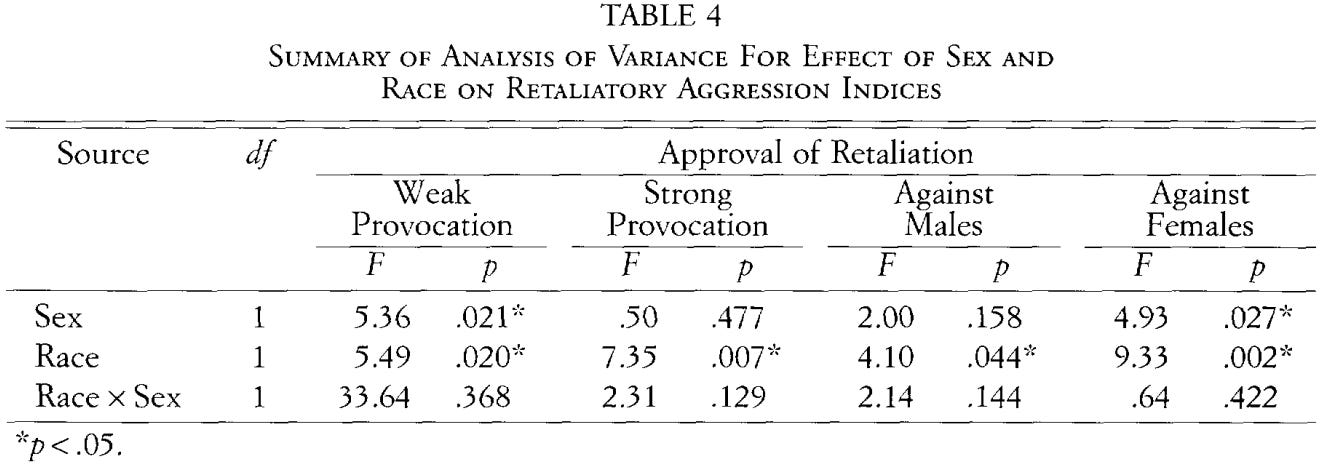
Thirdly and finally, a study by Haff et al. (2006) found that black people were way more likely than were white people to endorse the use of retaliatory aggression against both men and against women.
So, there are a few questions that need answering.
Can you tell someone’s race from genetic testing? Yes.
Can you tell someone’s race from their appearance? Yes.
Do racial groups behave differently on average? Yes.
This article is a documenting of research on these three points. Indeed, mankind is very diverse, sad though it is that some people deny the reality of race and the many differences that these groups bring about.
There is one study I can think of which reports a finding contrary to those I cited here. Vasiljevic et al. (2020) report that, although non-European immigrant crime is relatively increased for some crimes and relatively decreased for others when compared to European immigrants, there is no overall trend of either increased or decreased crime.
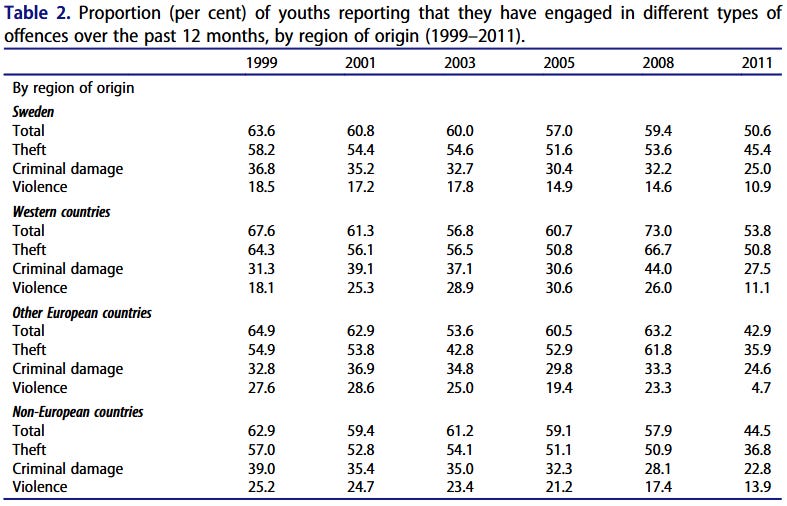
This result is undermined by the outcome measures utilized which are survey data unlike the studies by Skardhamar et al., Becker & Kirkegaard. It is well known that nonwhite people lie more than white people on surveys about crime and delinquency (e.g., Hindelang et al., 1981). For an example of why that matters, see Alexander (2025).
Comments
Nothing yet. Say the first thing.
Sign in to join the conversation.