

Australia has more land than almost any country on earth. It has run a sustained construction boom. It has, by the standard international measure, a housing supply that responds to prices more readily than Britain's. And it has some of the least affordable housing on the planet.a national price-to-income ratio of 8.2, a Sydney ratio of 10.1, and a Sydney house priced at roughly thirteen times median household income, second in the world only to Hong Kong. Three years ago, on one widely used measure, 43 per cent of median-income households could afford a median home. Today the figure is 14 per cent.
There are two popular explanations for this, and Australia has helpfully run the experiment on both.
The first is immigration. The second is that Australia simply does not build enough. Both are wrong, and the country's own data is what shows they are wrong. Once you clear them away, what is left is not a market that has failed. It is a machine working exactly as built.
Take immigration first. If population growth were the engine, closing the borders should cool the market. Australia closed its borders. During the pandemic, net migration fell to its lowest level in roughly a century, and house prices rose anyway. Whatever drives Australian house prices, it is not the marginal migrant, because the market kept climbing while the migrant stopped arriving. This is not an argument about immigration policy. It is the observation that the variable does not move the outcome.
The second explanation is more stubborn, because it is half true. Australia does not build enough where it counts. But "build more" as a general prescription runs straight into a measurement trap.
On the OECD's national estimates, Australian housing supply has a long-run price responsiveness of 0.528. That is mid-table, and, awkwardly for the undersupply story, higher than the United Kingdom's 0.395. The trouble is twofold. First, 0.528 is a long-run figure, the response after full adjustment over many years, the same OECD work shows the actual speed of adjustment is a slow crawl, and short-run estimates collapse by an order of magnitude. As a point of order, by the definition of economists, the ‘short run’ could be a quite a significant chunk of your adult life. Second, and more important, a national elasticity is an average over wildly different local markets. The Institute for Fiscal Studies has modelled this at neighbourhood level for England, and the figure runs from around zero in the high-demand, job-rich areas up to roughly 0.23 in the cheap periphery. The national number is dragged upward by the places nobody is fighting to live in.
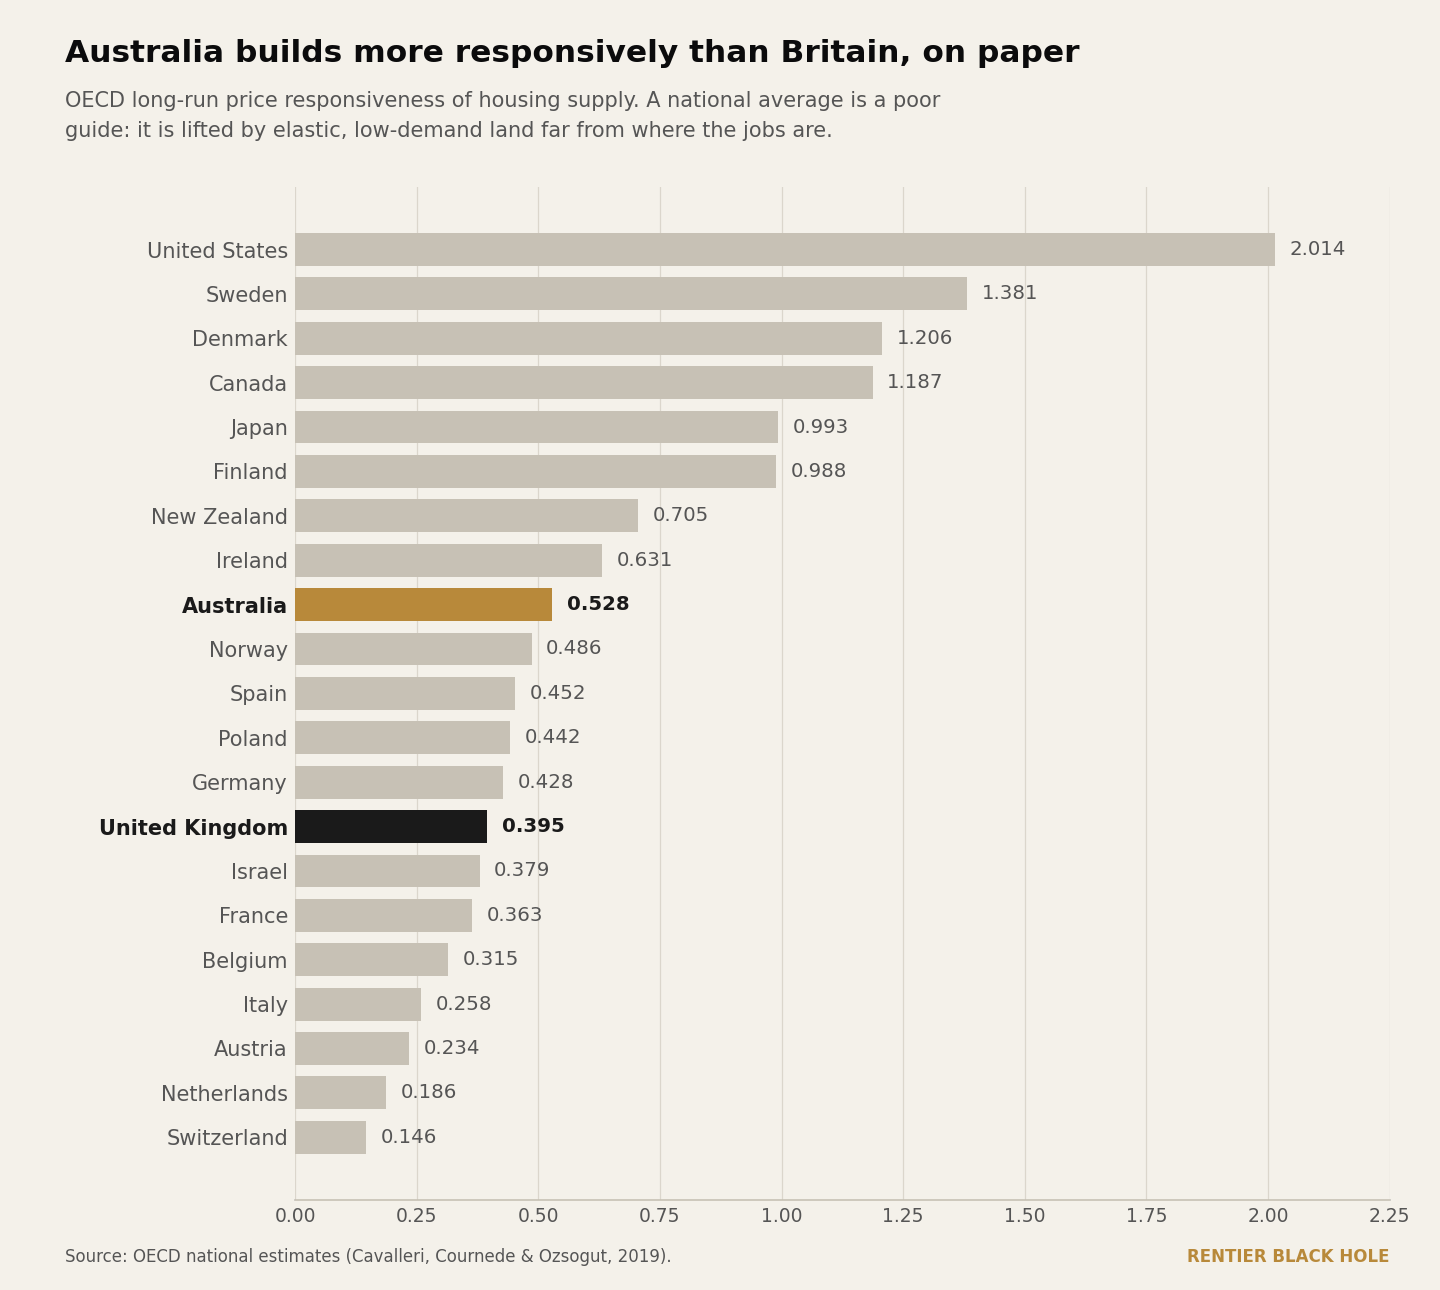
This is the whole game. The one thing that cannot be manufactured is well-located land near where the wages are. Australia can build, and does, but it builds on the fringe, where the jobs are not. For a good example, building two million empty homes in the outback would lift the national construction statistic and do nothing for a flat in Sydney.
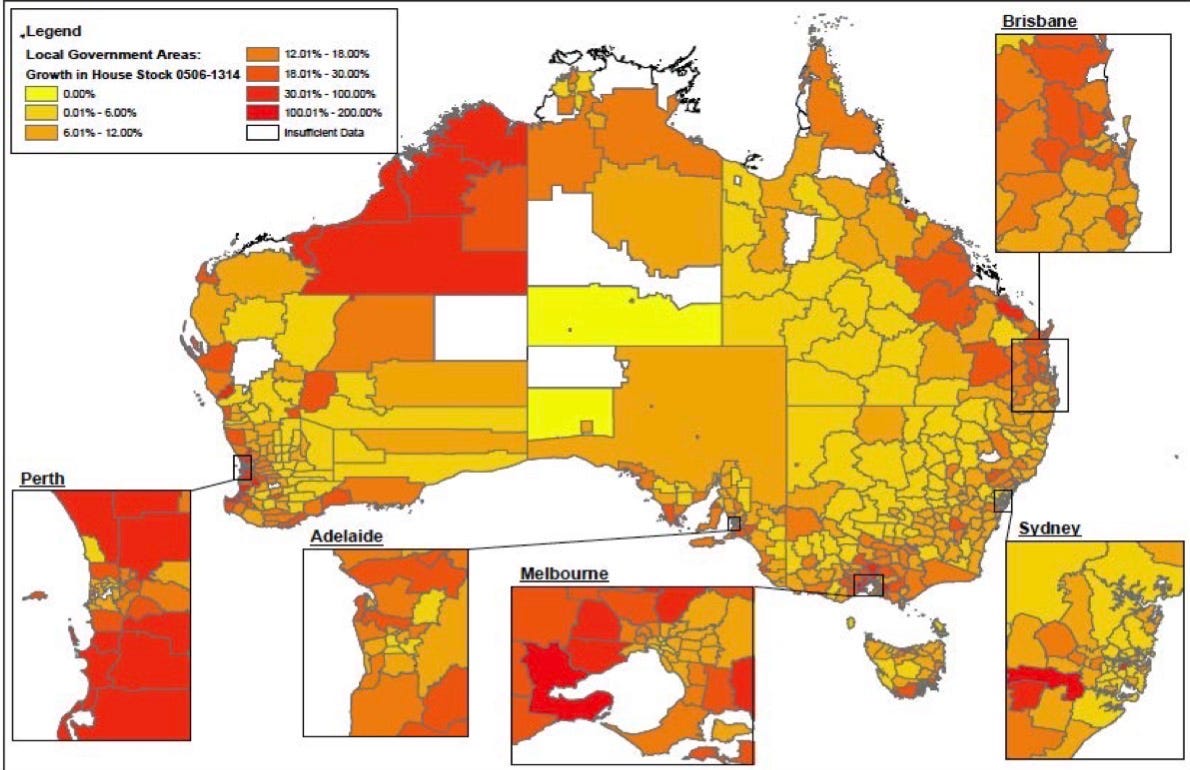
When we look at the pattern of housing stock increases, this is almost essentially what Australia has operated. Massive percentage booms in the housing stock, in the north west, the literal wrong end of the country when we consider which part would truly benefit from such an expansion in the housing stock.
For anyone who pictures Australia as a permissive build-anywhere paradise, it is, by the OECD's count, slower to issue a building permit than Britain, around ninety days against seventy. The country you imagine as endless sprawl is, on paper, more restricted than the UK.
So it is not the people, and it is not, in any simple sense, the building. It is the machine, and the machine has three parts.
The first part is credit, and Australia has built one of the most concentrated, most property-saturated banking systems in the developed world. Four banks hold roughly three-quarters of every mortgage in the country, a structure formalised since the 1990s as the "four pillars," under which the big four may compete but not merge. Their share of total banking assets closely tracks their share of mortgages, which is to say the system's balance sheet is, to a first approximation, a single claim on residential land. A housing stock worth around eleven trillion dollars against mortgage debt of roughly two and a third trillion. Household debt sits near 182% of income, among the highest on earth.
Here is why the concentration into mortgages matters, rather than being a neutral fact. When a bank lends against land whose supply cannot respond, the loan does not call forth new land. It cannot, the land is fixed. So the credit does the only thing left to it. it bids up the price of the land that already exists. Lending against an inelastic asset is not the financing of supply. It is fuel for price. The collateral rises, which supports more lending, which bids the collateral higher again. This is the loop, and it requires nobody to intend it.
Australia's regulator is not unaware of this. In February 2026 APRA activated a debt-to-income limit, capping the highest-leverage lending and holding a serviceability buffer and a countercyclical buffer alongside it. These are the structurally correct instruments, because they act on the quantity of credit rather than its price, which is where the dynamic actually lives. But they were calibrated, by the regulator's own account, so as not to overly constrain lending or disturb the smooth functioning of property transactions, and most banks already sit comfortably beneath the limit. The right tool, set deliberately below the level at which it would bind. That is not a criticism of any individual. It is what happens when the instrument that would work is also the instrument that would hurt, and the system chooses not to be hurt yet.
The second part is the one Australia, unusually, has written down in plain legislation, which is what makes it such a clean case. Two rules do the work.
The first is negative gearing. An investor who runs a rental property at a loss, with the mortgage interest counted as a cost, may deduct that loss against their wage income. The state, in effect, refunds part of the cost of holding the asset. The second rule, introduced in 1999, taxes only half of the capital gain when the asset is eventually sold.
Read the two together and the design becomes visible. You are rewarded for running the rental at a loss, because the rent was never the point. The point is the capital gain, and the capital gain is taxed at half rate. The structure converts taxed salary into discounted, deferred, lightly taxed appreciation on land. It is, quite literally, a mechanism for turning income from work into income from owning, with the tax code subsidising both ends of the trade.
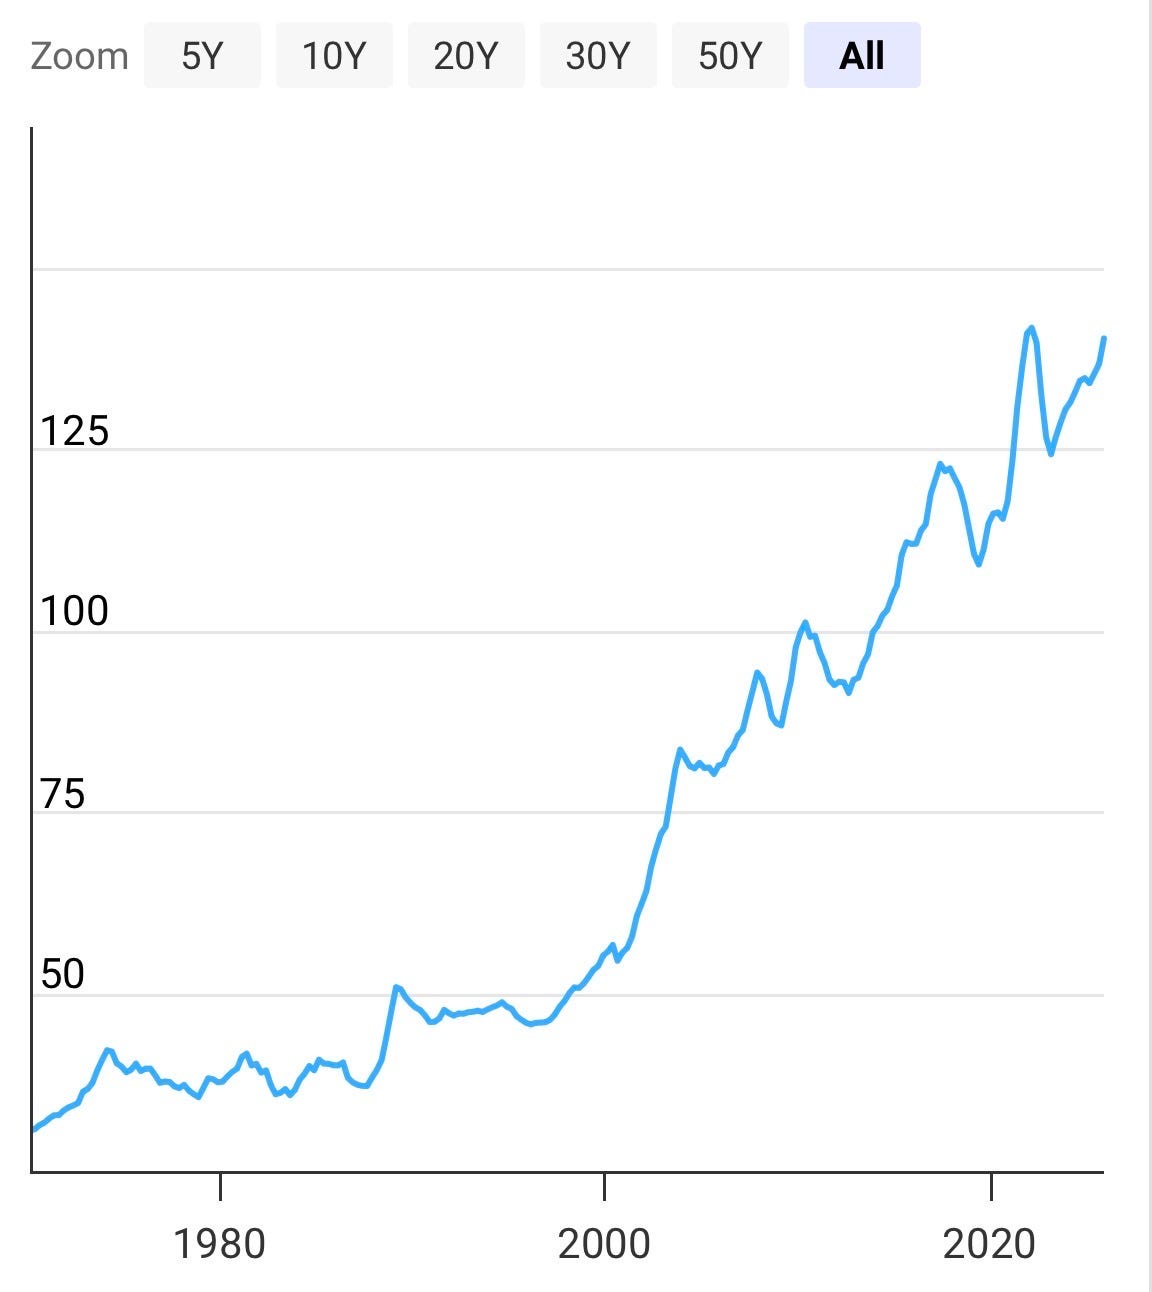
The scale is not marginal. The capital-gains discount alone is estimated to forgo around 21.8 billion dollars of revenue in 2025-26, with roughly 83 per cent of the benefit flowing to the wealthiest tenth of earners. Even the Reserve Bank has conceded that Australia's tax treatment is friendlier to property investors than that of comparable countries. And a long-run chart of real Australian house prices is broadly flat for decades and then lifts off almost exactly when the 1999 rule arrives. That last point is correlation rather than proof, and ought to be stated as such, but the timing is difficult to ignore.
If the tax code subsidises the supply of leveraged demand, a third set of policies subsidises the demand directly. Australia lets first-time buyers in with almost nothing down, a five per cent deposit for first home buyers, as little as two per cent for single parents, with the government guaranteeing the gap, and, since late 2025, no cap on the number of places. There is also a shared-equity scheme in which the Commonwealth takes a stake of up to forty per cent in a new build.
These are presented as help for buyers, and for the first cohort through the door they are exactly that. The difficulty is what they do to everyone behind that cohort. Hand buyers more borrowing power in a market where supply cannot respond, and the extra borrowing power does not become houses. It becomes price. Britain ran precisely this experiment with its Help to Buy scheme, and the academic evidence is fairly settled. It raised prices more than it raised supply or ownership, concentrated where supply was already tight. A demand subsidy poured into an inelastic asset is capitalised into the asset. We have watched this film, and we know how it ends.
A configuration like this leaves fingerprints, and they appear far from the property pages.
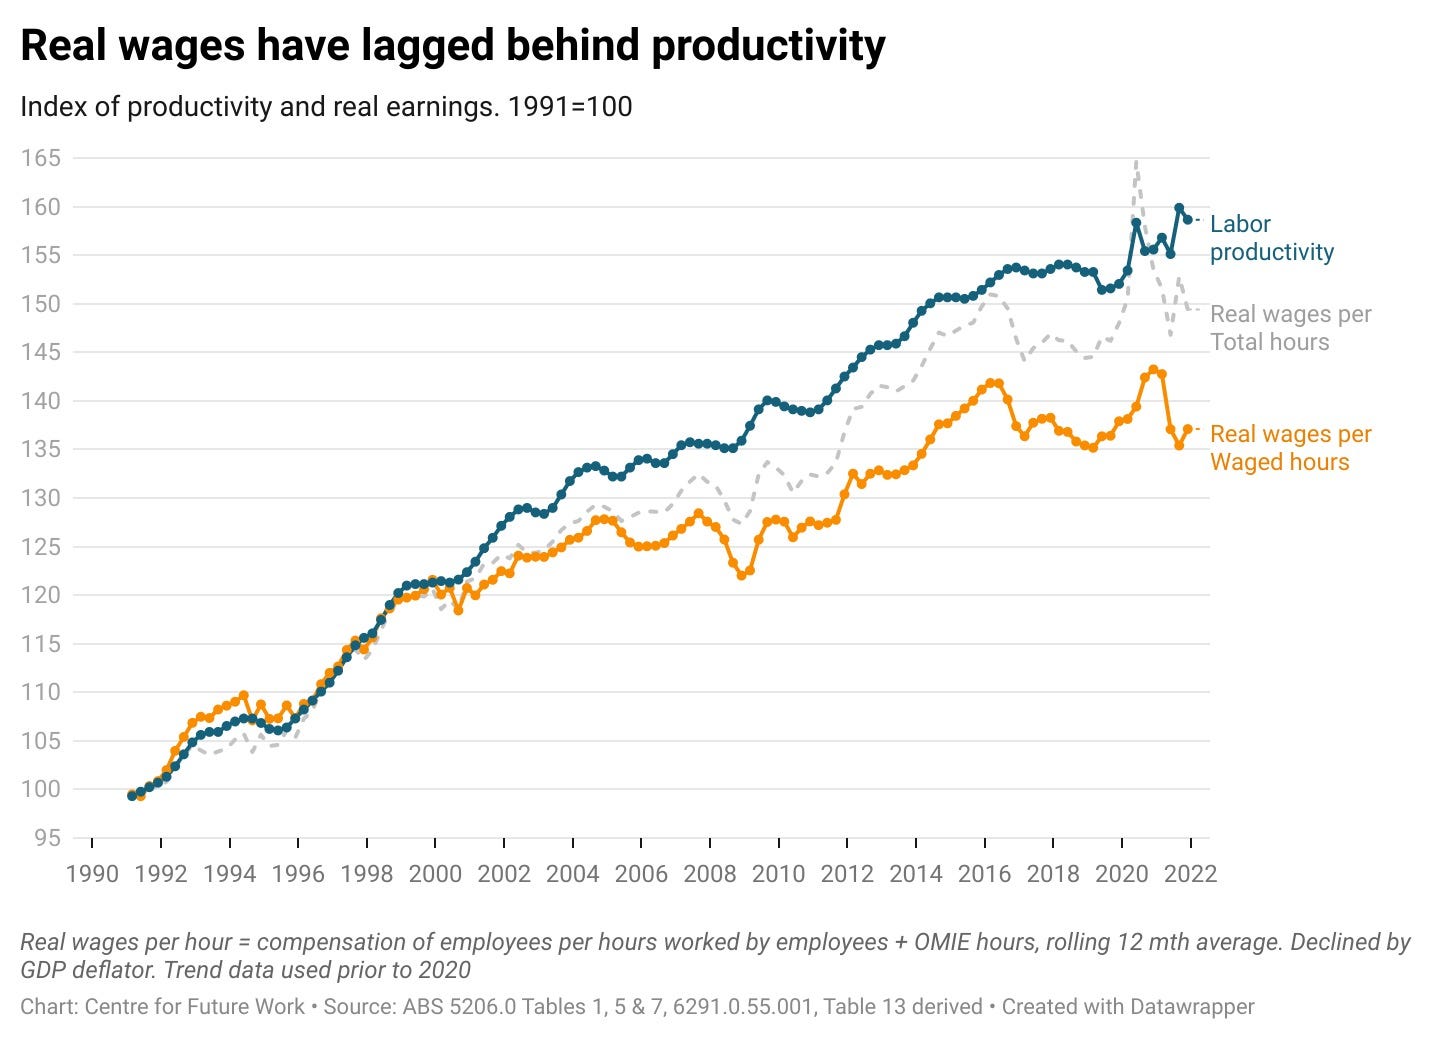
The first is in wages. Since the early 1990s, Australian labour productivity has climbed steadily, output per hour worked has gone up. Real wages per hour have not kept pace. The gap between the two has widened for more than two decades, and because the standard series deflate both sides by the same price index, that gap is not a measurement quirk. It is, arithmetically, the shrinking share of national income going to labour. Part of that shrinking share is precisely the transfer this machine performs. The economy's gains flowing to whoever owns the land and the credit, rather than to the people doing the work.
The second fingerprint is in the national balance sheet. Around two-thirds of all Australian household wealth, roughly 67 per cent, is held in residential property. The country's banks, as we have seen, are about three-quarters mortgages. Both sides of the national balance sheet, the assets households hold and the loans the banks make, are, to a first approximation, the same bet on the same asset. An entire developed economy is long one thing, and that thing is land it cannot make more of.
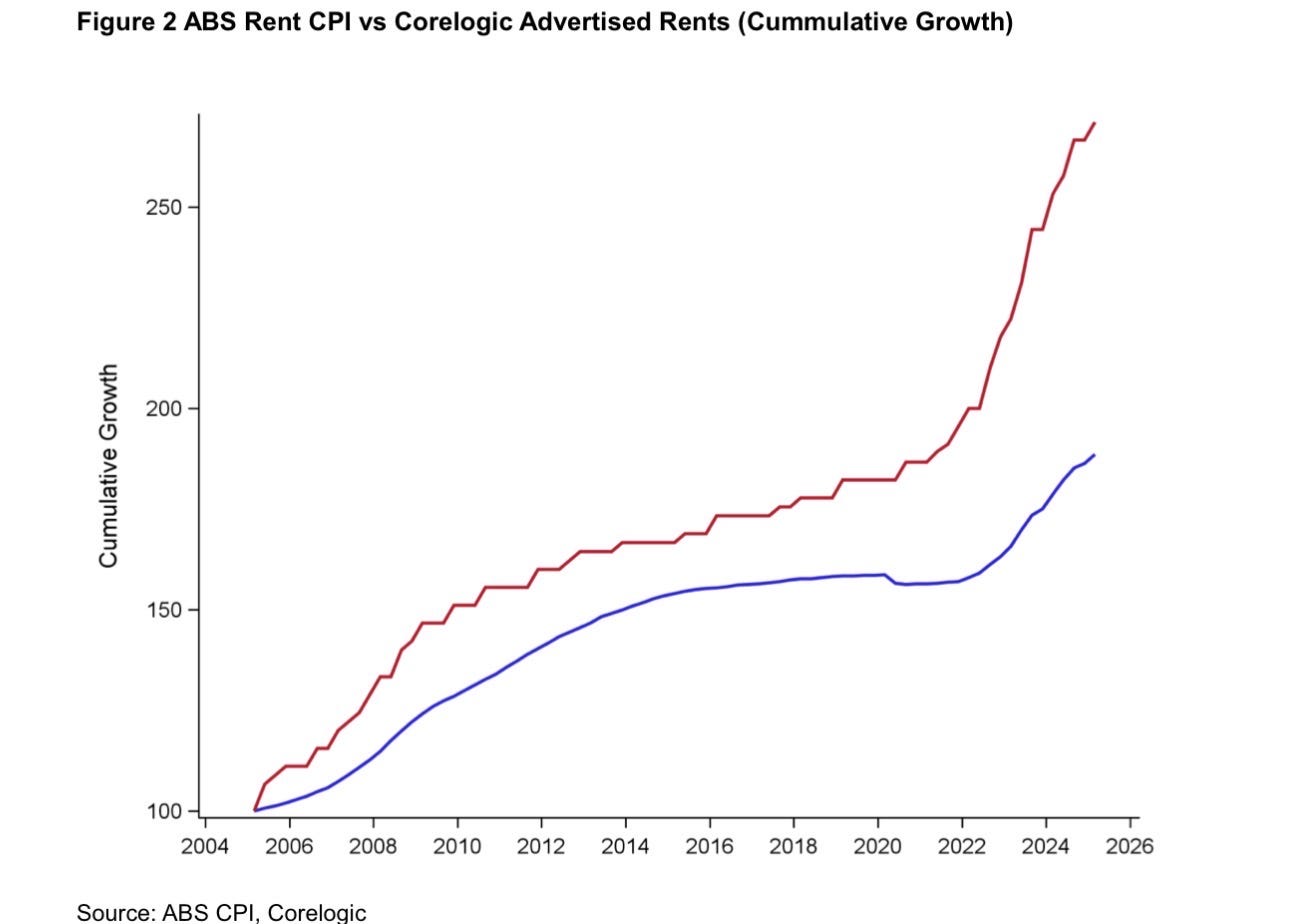
And the lived experience is worse than the official figures admit. The government's rent index has risen about 88 per cent since 2005. Advertised rents, what a new tenant actually pays on signing a fresh lease, have risen about 170 per cent over the same period. The official measure is dominated by slow-moving sitting tenancies; the marginal renter lives on the higher line. The statistic quietly understates the very burden it exists to measure.
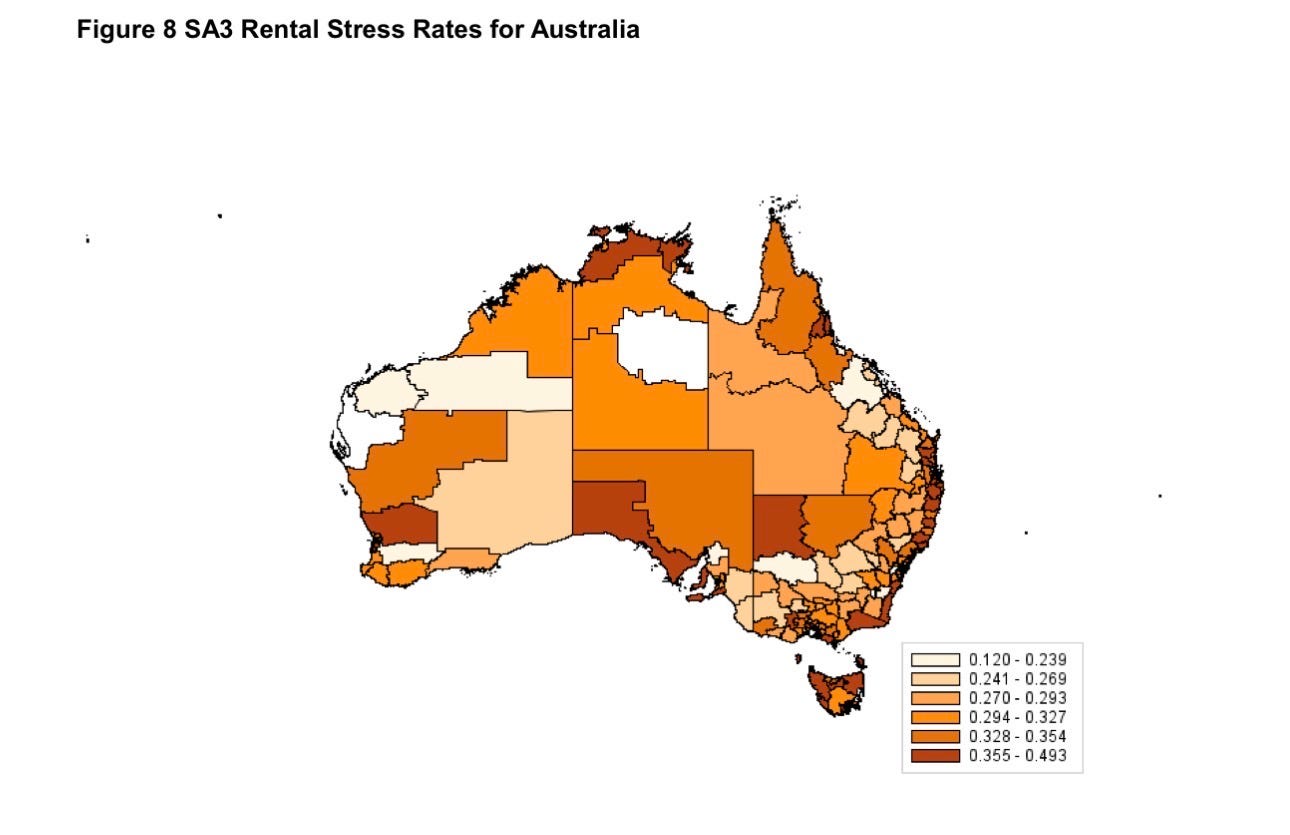
(Rental stress by SA3 region: the share of renting households spending more than 30 per cent of income on rent)
Here is what makes Australia worth watching rather than merely diagnosing. It is the first of these economies to try to take the machine apart.
The 2026-27 federal budget begins unwinding the tax part. From the 1st of July 2027 the fifty per cent capital-gains discount is replaced by indexation of the cost base plus a minimum tax, and negative gearing on established dwellings is restricted for purchases made after the 12th of May 2026. The legislation is before parliament. It is a real reform, aimed at a real accelerant.
It will not be enough, and the framework says why with some precision. The transfer this machine performs is a property of all three parts acting together. Land that cannot be made, a banking system that bids against it, and a tax code that subsidizes the bid. Remove the tax accelerant and the other two keep running. The land is still fixed. The banks still lend against it. The deposit schemes still pump demand in. And the reform is built to land softly, existing holdings are grandfathered, new builds are carved out, and the family home is untouched, so it bites at the margin by design.
So here is a dated, falsifiable prediction, which is what a diagnosis ought to leave behind. After July 2027, watch two numbers, the imputed-rental share of GDP, and the price-to-income ratio. If this were a tax problem, both should ease. The framework predicts they will not, that the float keeps expanding and the ratio holds or climbs, because the binding constraints were never the tax. The tax was the most visible part of the machine, which is precisely why it was the part that got touched.
The Australian economy, has in no uncertain terms, looked at the UK and stated proudly ‘hold my beer’, and derived for itself a singularity of obscene size and pull.
The commentary seen about affordability, the cost of living, of hard working Australians being priced out of a life their parents could have expected, hides a darker and more insidious element.
When everyone decides that only one investment in the economy works, that is ‘as safe as houses’, inelastic in its supply, pro cyclically boosted by loose credit, and with tax advantages that look more fitting for Gran Cayman than Canberra, the story today is the house you can’t afford, the story tomorrow is about the industry and real economy you can’t afford to save.
As property dominates the investment decisions of all Australians, productive capital is starved, the relative value of business investment in the country as a percentage of GDP will decline in relative terms. In fact it has, for 60 years.
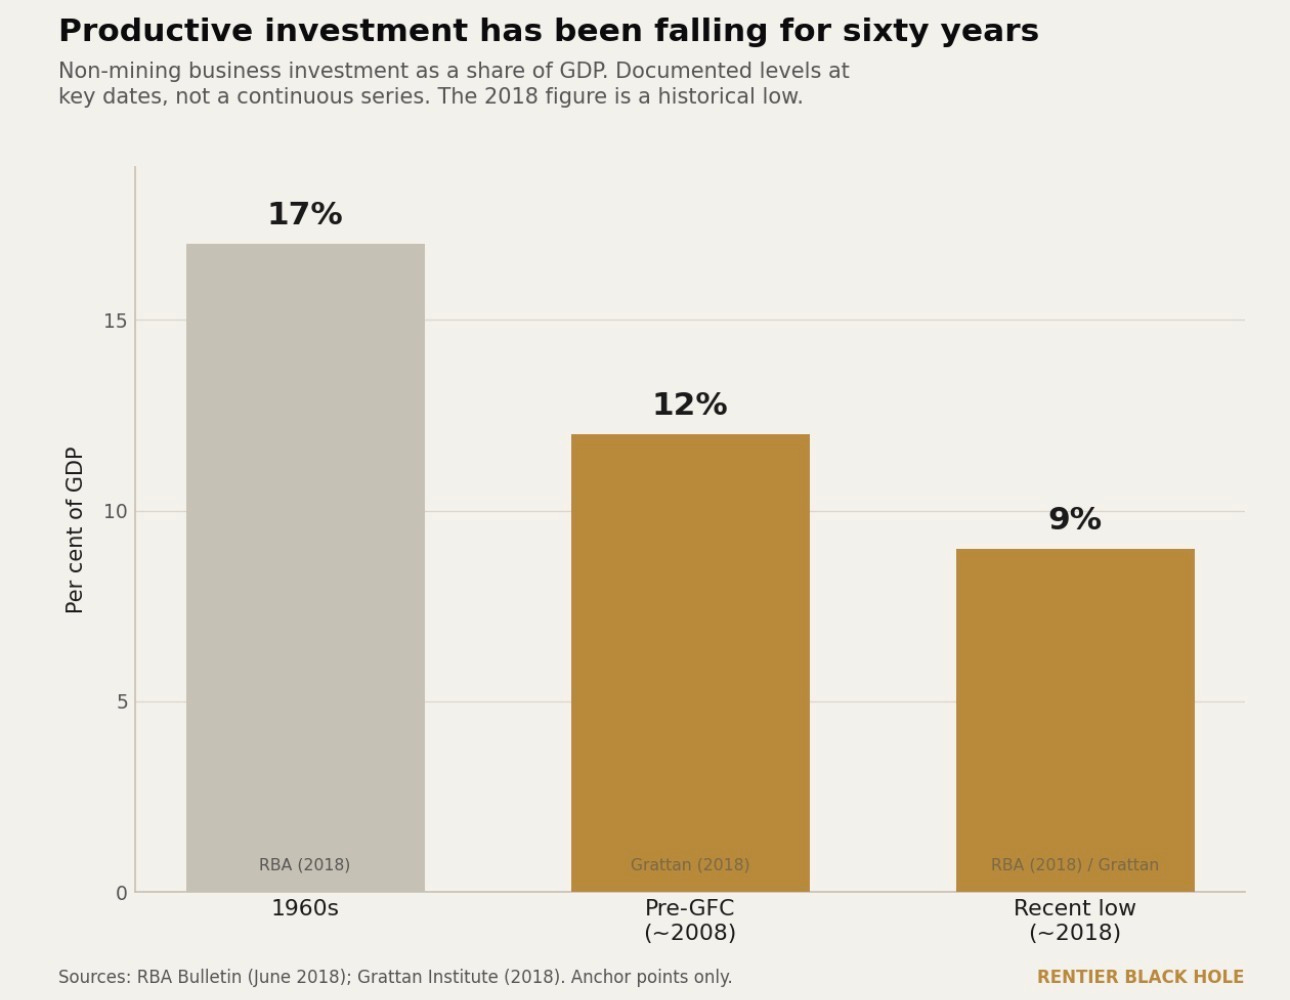
That investment, is the capital, the intellectual property, the machines, the factories, the capability, the real industry that pays the real wages. That is what is being suffocated by a scramble for patches of red dirt.
The question then becomes. How long can a real wage pay an inflated rent, and how long can a real economy support an imagined one.
If you would like to learn more about the core Rentier black hole concept, come along, we will be running through the list of the worst offenders here on Substack, or for a look at the working papers in progress they are available on rentierblackhole.com
No posts
Comments
Nothing yet. Say the first thing.
Sign in to join the conversation.