
Copenhagen averages about nine degrees a year. Nobody owns a nine-degree wardrobe. You own a winter coat and summer clothes, and you check the season before you get dressed.
Yet the standard portfolio is built for exactly that nine-degree climate. Its inputs - expected returns, volatilities, correlations - are long-run averages, computed across booms and busts, inflation shocks and disinflations, and then held constant. The mix that comes out is worn unchanged through every economic environment. Not because anyone believes the environment is irrelevant; every professional investor knows it is not. The reason is simpler and older: the state of the cycle was filed away, decades ago, under unknowable. You cannot condition a portfolio on a variable you cannot observe, so the industry learned to average over it instead.
That is the assumption this article challenges. The state of the business cycle can be observed - monthly, by fixed rules, dated to the month, on a chronology that runs back to 1970. And once the cycle becomes an observable variable rather than an opinion, an old question acquires a practical answer: what should a portfolio hold, given the state the economy is actually in - rather than the average of all the states it might be in?
The classification puts every month into one of four phases. Expansion: the economy grows broadly - employment, output and income rising together. Slowdown: growth cools from its peak while the level of activity remains high; this is the longest and most variable phase, and the most misread. Contraction: measured activity falls - the recessionary regime, the winter of the cycle. Recovery: activity turns up from its low, typically before the backward-looking data admits it.
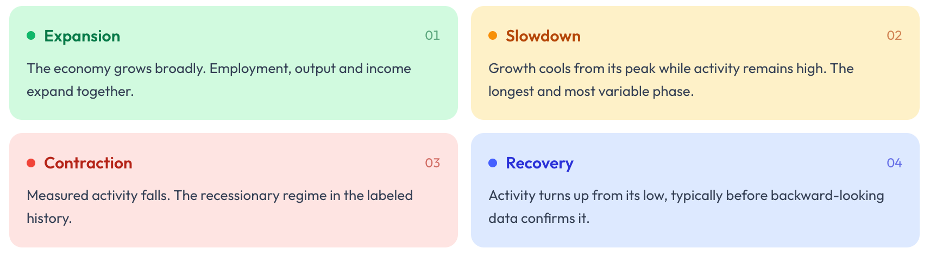
The four phases. A full cycle runs Expansion, Slowdown, Contraction, Recovery; the economy is always in exactly one phase.
Two structural facts give the framework its discipline. First, the economy is always in exactly one phase - there is no in-between state to argue about. Second, the sequence never breaks: since 1970 the United States has moved through 29 dated phase episodes, and the order has been one-two-three-four in every single cycle. The durations vary enormously - slowdowns have run from 3 months to 69, expansions from 9 to 48 - but the grammar of the cycle has not changed in half a century. Dating cycles is not new; economists have done it for a hundred years. What follows is.
For a century, cycles were dated the way history is written - after the fact, by committee, with revisions. That is valuable for scholarship and useless for allocation. What has been missing is the cycle as a live, objective, monthly variable: something an investment process can reference the way it references a benchmark weight or a risk limit.
The picture below shows the machine end to end. Hundreds of raw economic series - employment, income, production, orders, credit conditions - feed a small set of composite gauges. A leading composite turns before the economy does; a coincident composite measures what is happening now; a nowcasting layer estimates the freshest months while the slowest official data is still pending. A fixed, deterministic rule then reads the composites and publishes one phase. From that single answer, the right-hand side of the picture follows: an allocation across five liquid building blocks - equities, Treasuries, gold, commodities, cash - and, inside the equity sleeve, a further resolution into the industries that have historically led in each phase.
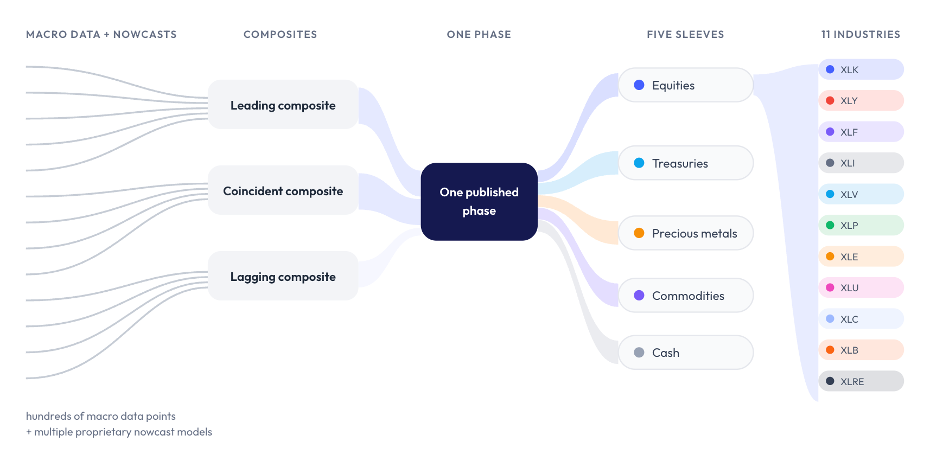
From hundreds of macro data points to one published phase, and from the phase to the portfolio: five asset sleeves, with the equity sleeve resolved into industry books.
The division of authority between the gauges is the framework’s quality control. The leading composite may open the transitional phases - Slowdown and Recovery - because those are, by nature, anticipatory calls. But only the coincident composite, the measured real economy, can declare a Contraction or a new Expansion. Market prices alone can never print a recession. That single design choice is why October 1987 - a twenty percent crash in a day - left the classification unmoved: the measured economy had not turned, so no false winter was declared, and none needed to be retracted.
Three properties matter for anyone who would build a process on this. The rule is deterministic - the same inputs always produce the same phase, with no discretionary override. Every transition is timestamped and the published history is never restated - the record can be audited like infrastructure, not like research. And the cadence is calm: roughly one phase transition every two years. This is not a trading signal. It is the answer to a slower and more consequential question - what economic environment is the portfolio living in?
Bucket fifty-six years of monthly returns by the labeled phase and the folklore does not survive contact with the data. Three findings stand out.
First, equities earn their best conditional performance not in the euphoric rebound but in the Slowdown - the cooling phase most investors instinctively fear. The largest equity cell on the whole map sits there: an annualized mean of 12.3% with a 66% monthly hit rate. The economic logic is sound once you see it: activity is still expanding from a high level while markets begin to price the easing ahead.
Second, and most important for portfolio construction: the classic stock-bond hedge is least reliable exactly where portfolios lean on it hardest. Inside Expansion, the correlation between equities and long Treasuries runs +0.33, against +0.10 over all history. In the good times, the two sides of the classic balanced portfolio tend to rise and fall together - the parachute is tangled precisely when you are flying highest. It is in the downturn that the defensive assets do their real work: Treasuries have returned 7.9% annualized inside Contraction and 7.8% in Recovery, and gold’s strongest conditional showing - a median month of +1.35% with a 61% hit rate - also sits in Contraction.
Third, the catastrophes cluster. Every one of the last half-century’s deepest equity episodes - the minus-fifty-percent kind - occurred inside the same single phase, Contraction, where equity volatility runs near 20% and the worst episode drawdown in the labeled history reached -50.4%. Meanwhile the rebound has an owner of its own: crude oil, with a 20.9% annualized mean in Recovery, the largest single lift on the map. Across all the cells, monthly hit rates barely move - roughly 45% to 66% - while annualized means span -3.5% to +20.9%. The unconditional average that standard portfolios are built on - equities at roughly 9% a year with a -50% worst episode - is simply the blend of these very different seasons. The cycle is where that average comes from.
Claims about regime awareness are cheap; the test design is what makes this one worth a professional’s attention. Take the same five building blocks. Impose the same risk budget - the framework defines risk k of 10 as a worst-drawdown budget of k times 5%, set in the methodology specification, not tuned to any backtest. Build two portfolios. The static book holds one fixed weight set at that budget, rebalanced monthly, with no phase information. The phase-aware book holds phase-specific weights and changes them only when the published phase changes. Same sleeves, same budget, one difference: the signal. The gap between the two lines is therefore the value of the phase information alone - not asset-class selection, not risk appetite, not hindsight about which assets to include.
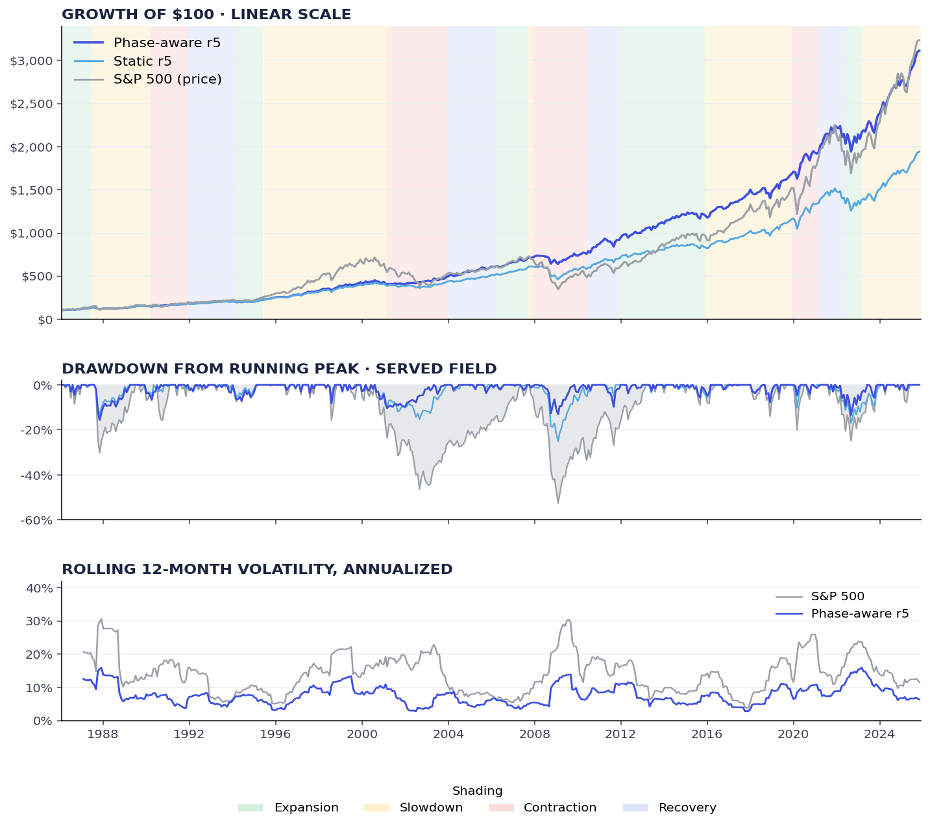
Phase-aware portfolio (risk 5 of 10) against the identical static mix and the S&P 500 price index, 1986-02 to 2025-11, 478 months. Growth of $100 on a linear scale; drawdown from the running peak; rolling 12-month volatility. Phase shading on the growth panel. The index line is price-only - dividends are not counted. Figures are in-sample and gross of costs; chart drawn from the served monthly paths.
Read the three panels in order. Growth: over forty years the phase-aware book compounds to roughly the same destination as the equity index itself, and pulls clearly ahead of its fixed twin. Drawdown - the panel that matters: the index fell 46% in the dot-com bust and 53% in the financial crisis; the static mix broke 25%; the phase-aware book’s worst point in the entire four decades was -15.6%, and it was set on Black Monday in 1987, not in either of the great bear markets. Volatility: roughly half the index’s, throughout.
Comments
Nothing yet. Say the first thing.
Sign in to join the conversation.