
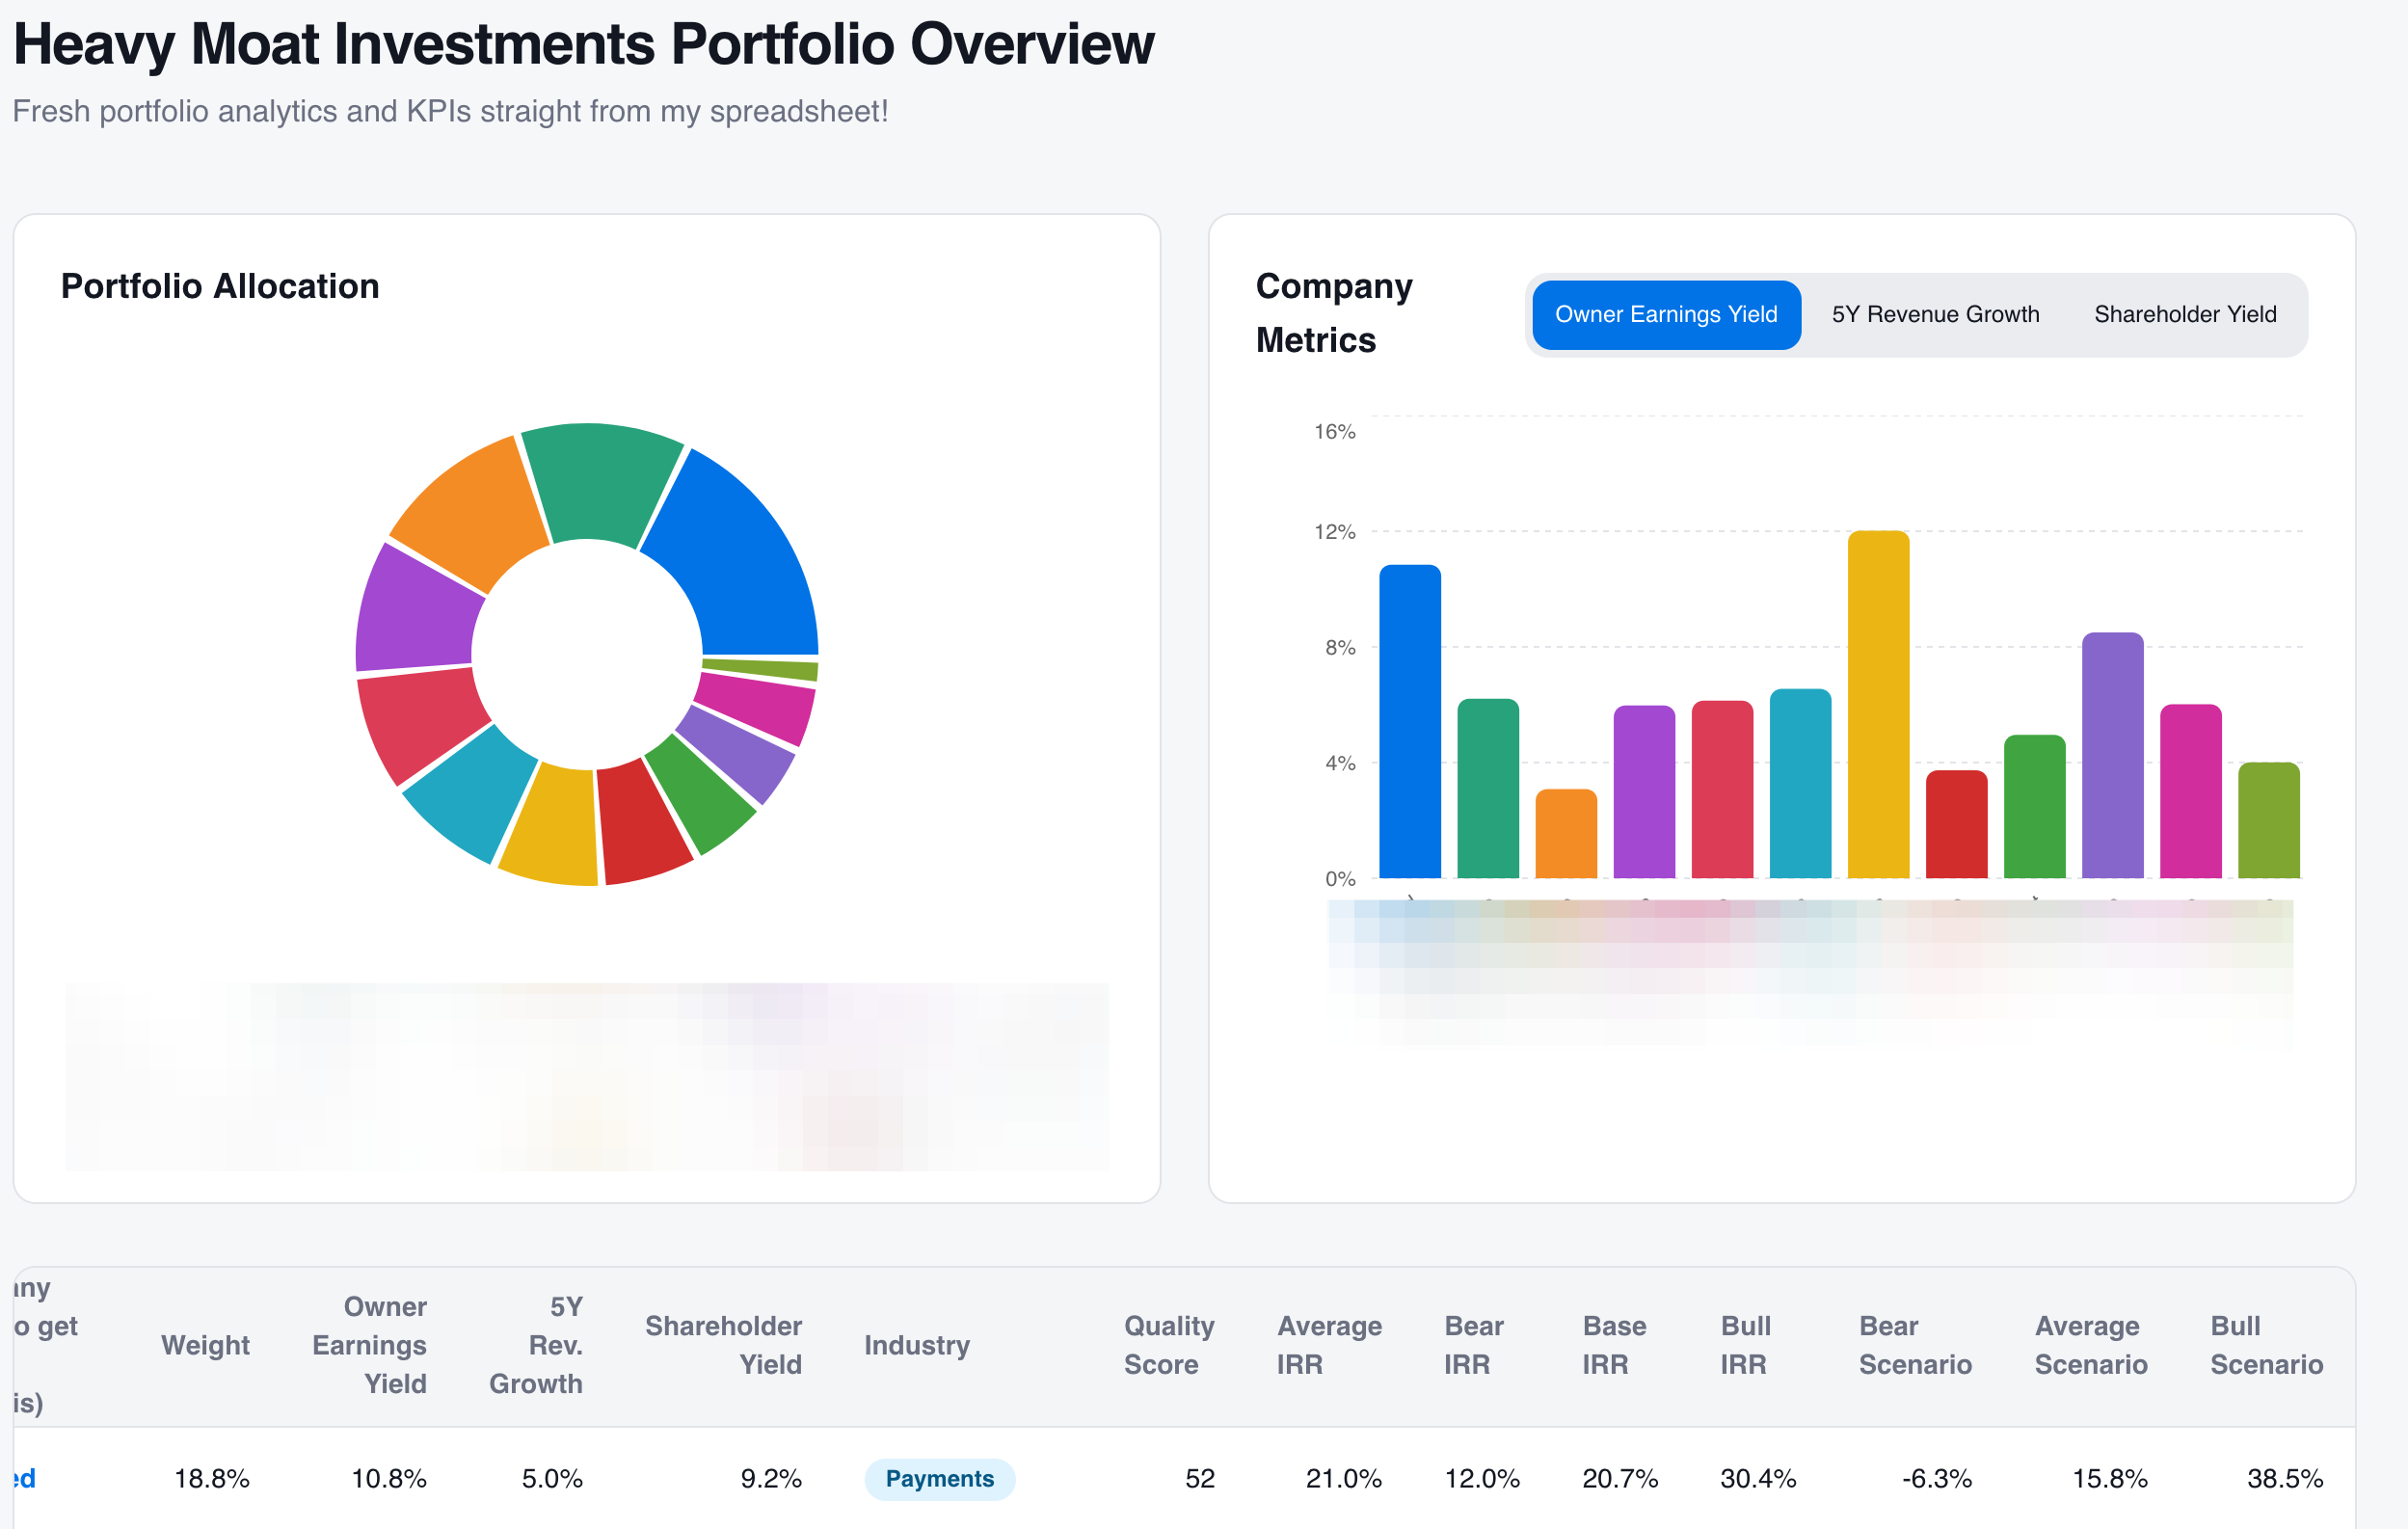
A while ago I decided to build my own little webpage to display live data of my portfolio instead of doing monthly updates. That way you can always just look up how my portfolio looks and where the IRR stands for each position, together with some KPIs like shareholder yield, expected growth and owner earnings yield.
Today I added, besides my older IRR model, the live data for my newer scenario model to the overview. I prefer the new model, so that’s what I mainly use myself now and also in articles. I also moved the page to a new link, which you can find below. Furthermore, I also want to add another table with a few watchlist companies, including live IRR to see if something might be at an interesting price point.
Comments
Nothing yet. Say the first thing.
Sign in to join the conversation.