
My colleague, Edouard Mathieu, recently created an interactive map showing when the populations of countries around the world are expected to peak. This is based on historical estimates and the UN’s medium projections (which we can endlessly debate the assumptions of).
Some countries have already passed the peak. This was not news to me. Nor was it news to me that these countries are basically all in Europe and East Asia.
There was one thing that surprised me, though. Down in South-East Asia, Thailand has apparently passed peak population, too.
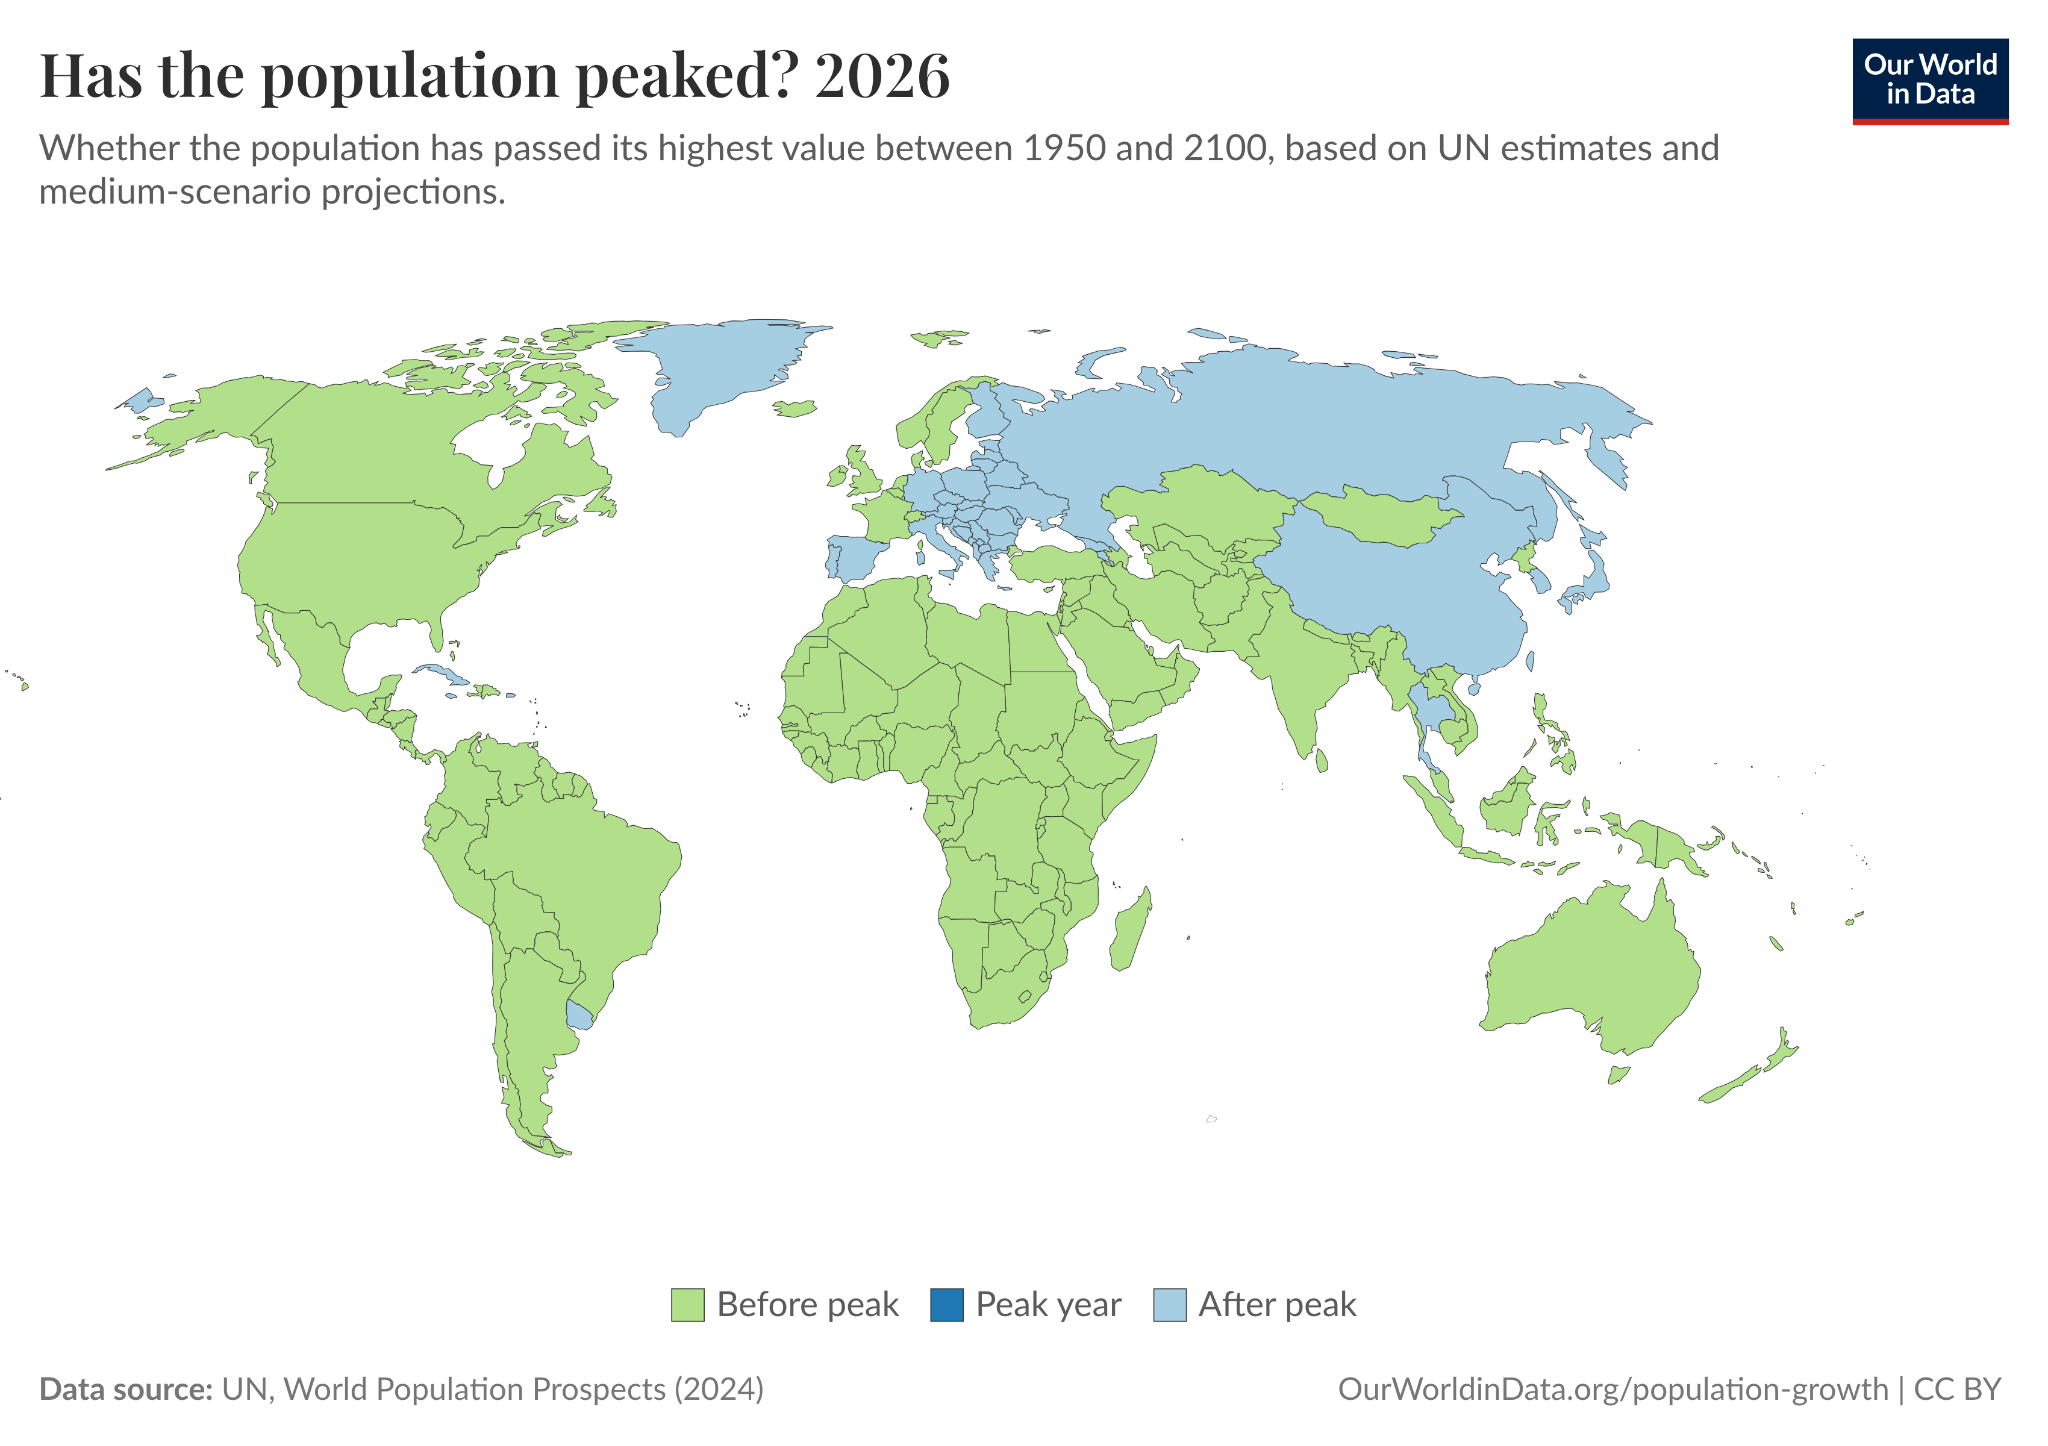
Now, when I say “passed the peak”, it has barely. By the UN’s estimates and projections, it might have been in 2022, and the population has fallen only slightly since then. Still, it’s a regional outlier. Most other countries in South and Southeast Asia are expected to see their populations grow for several more decades. In Thailand, growth has already ended.
What’s going on? Why has population growth slowed so much, and why has its trajectory been so different from its neighbours?
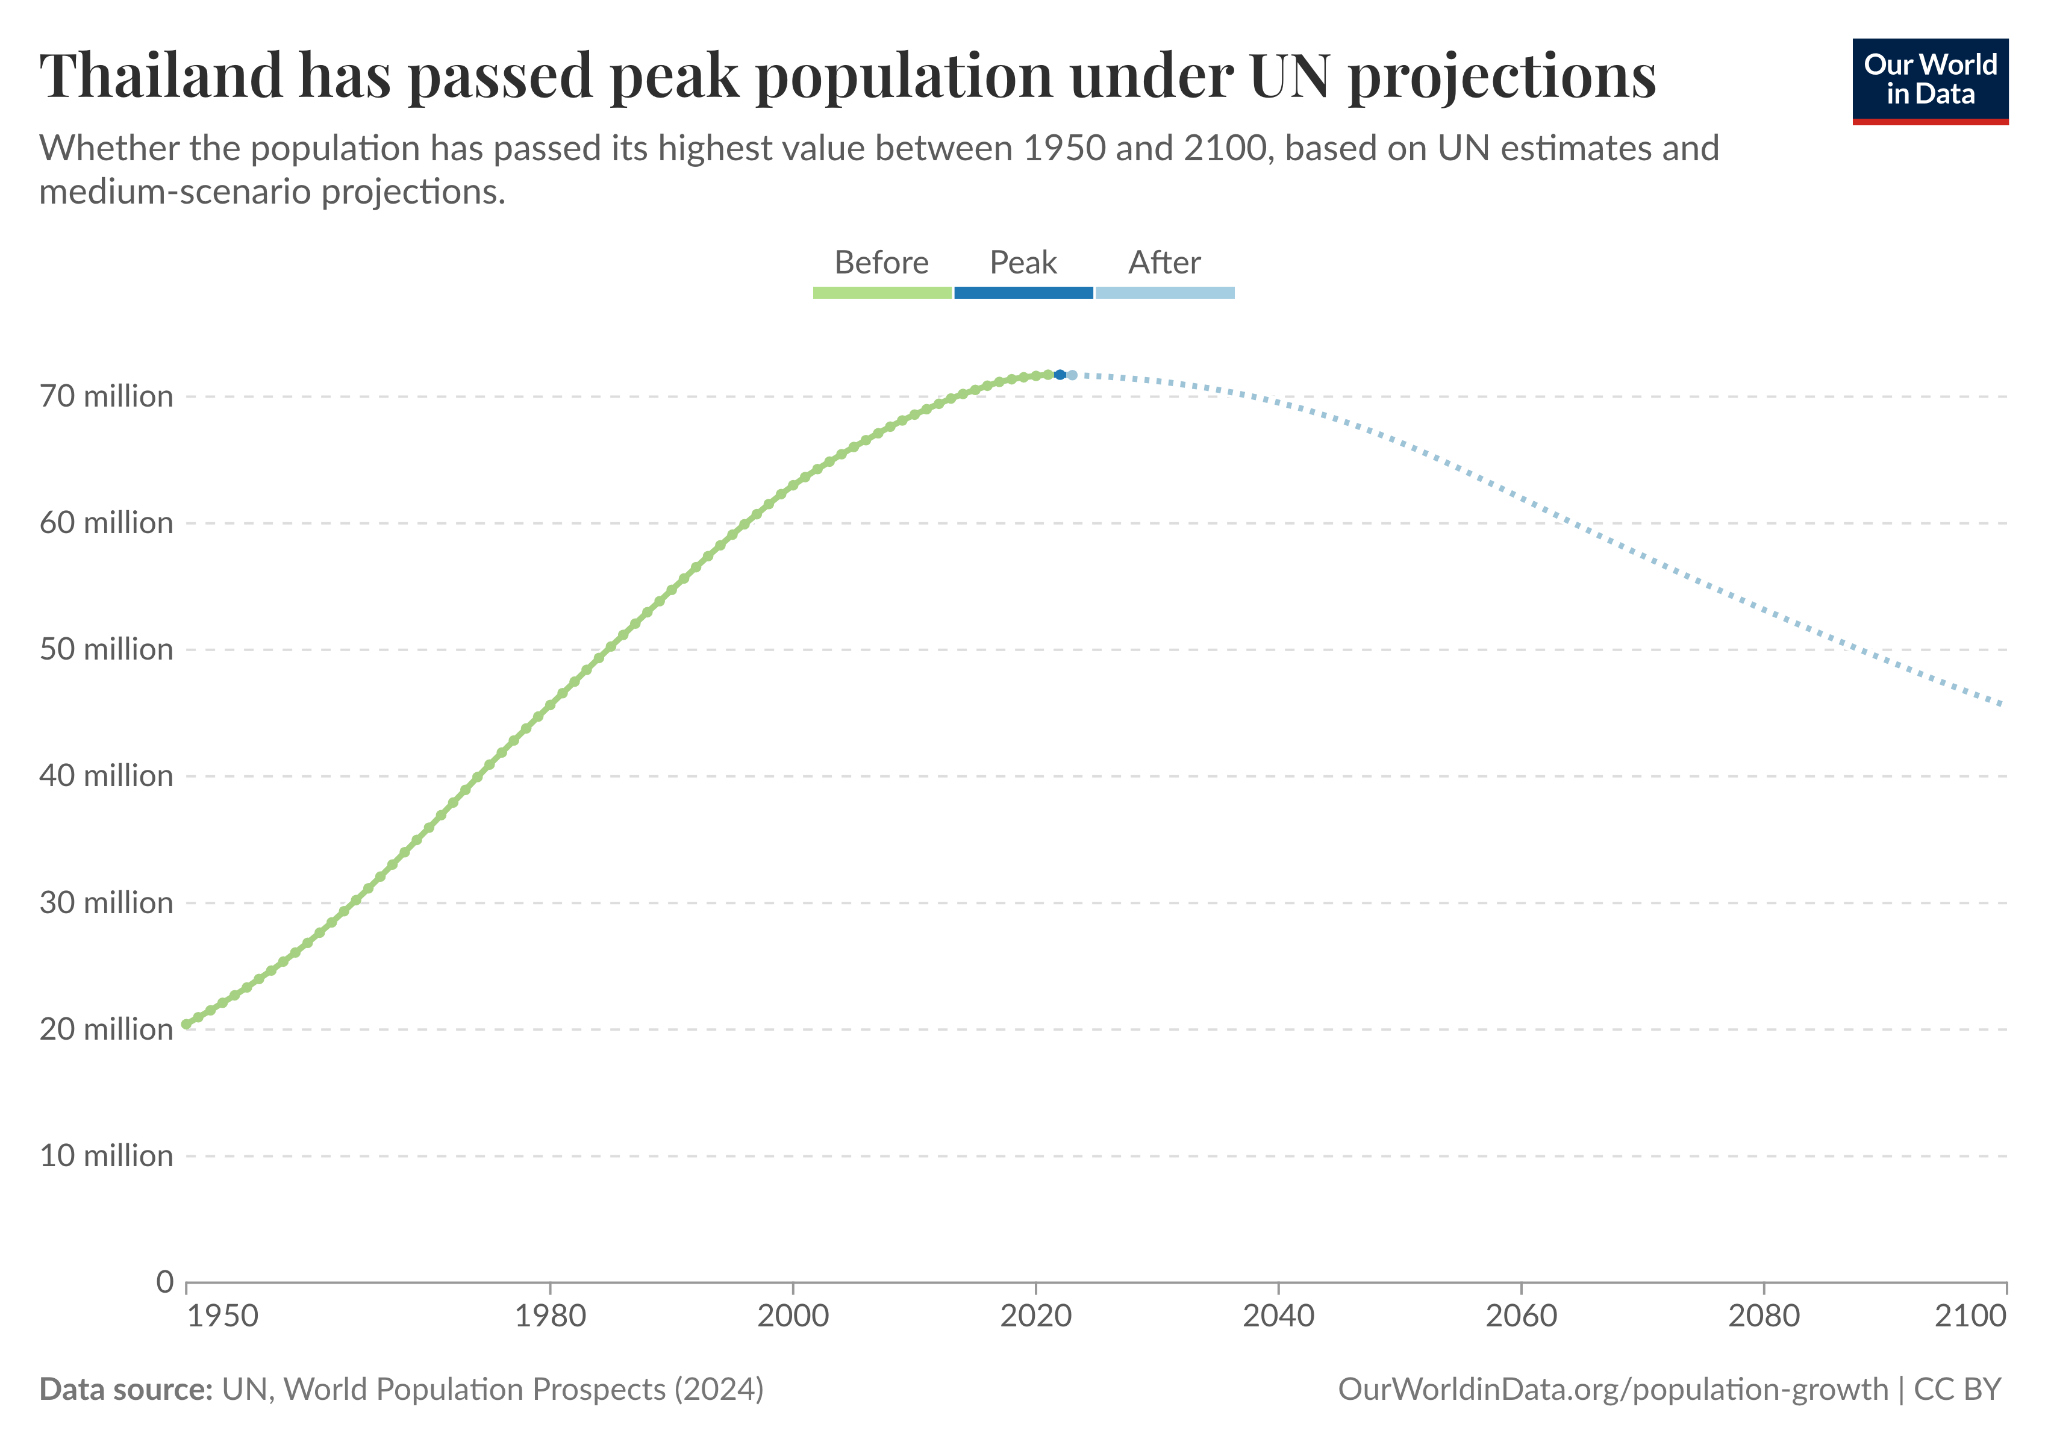
Thailand’s population growth has slowed — and actually gone into reverse — because its fertility rates are extremely low.
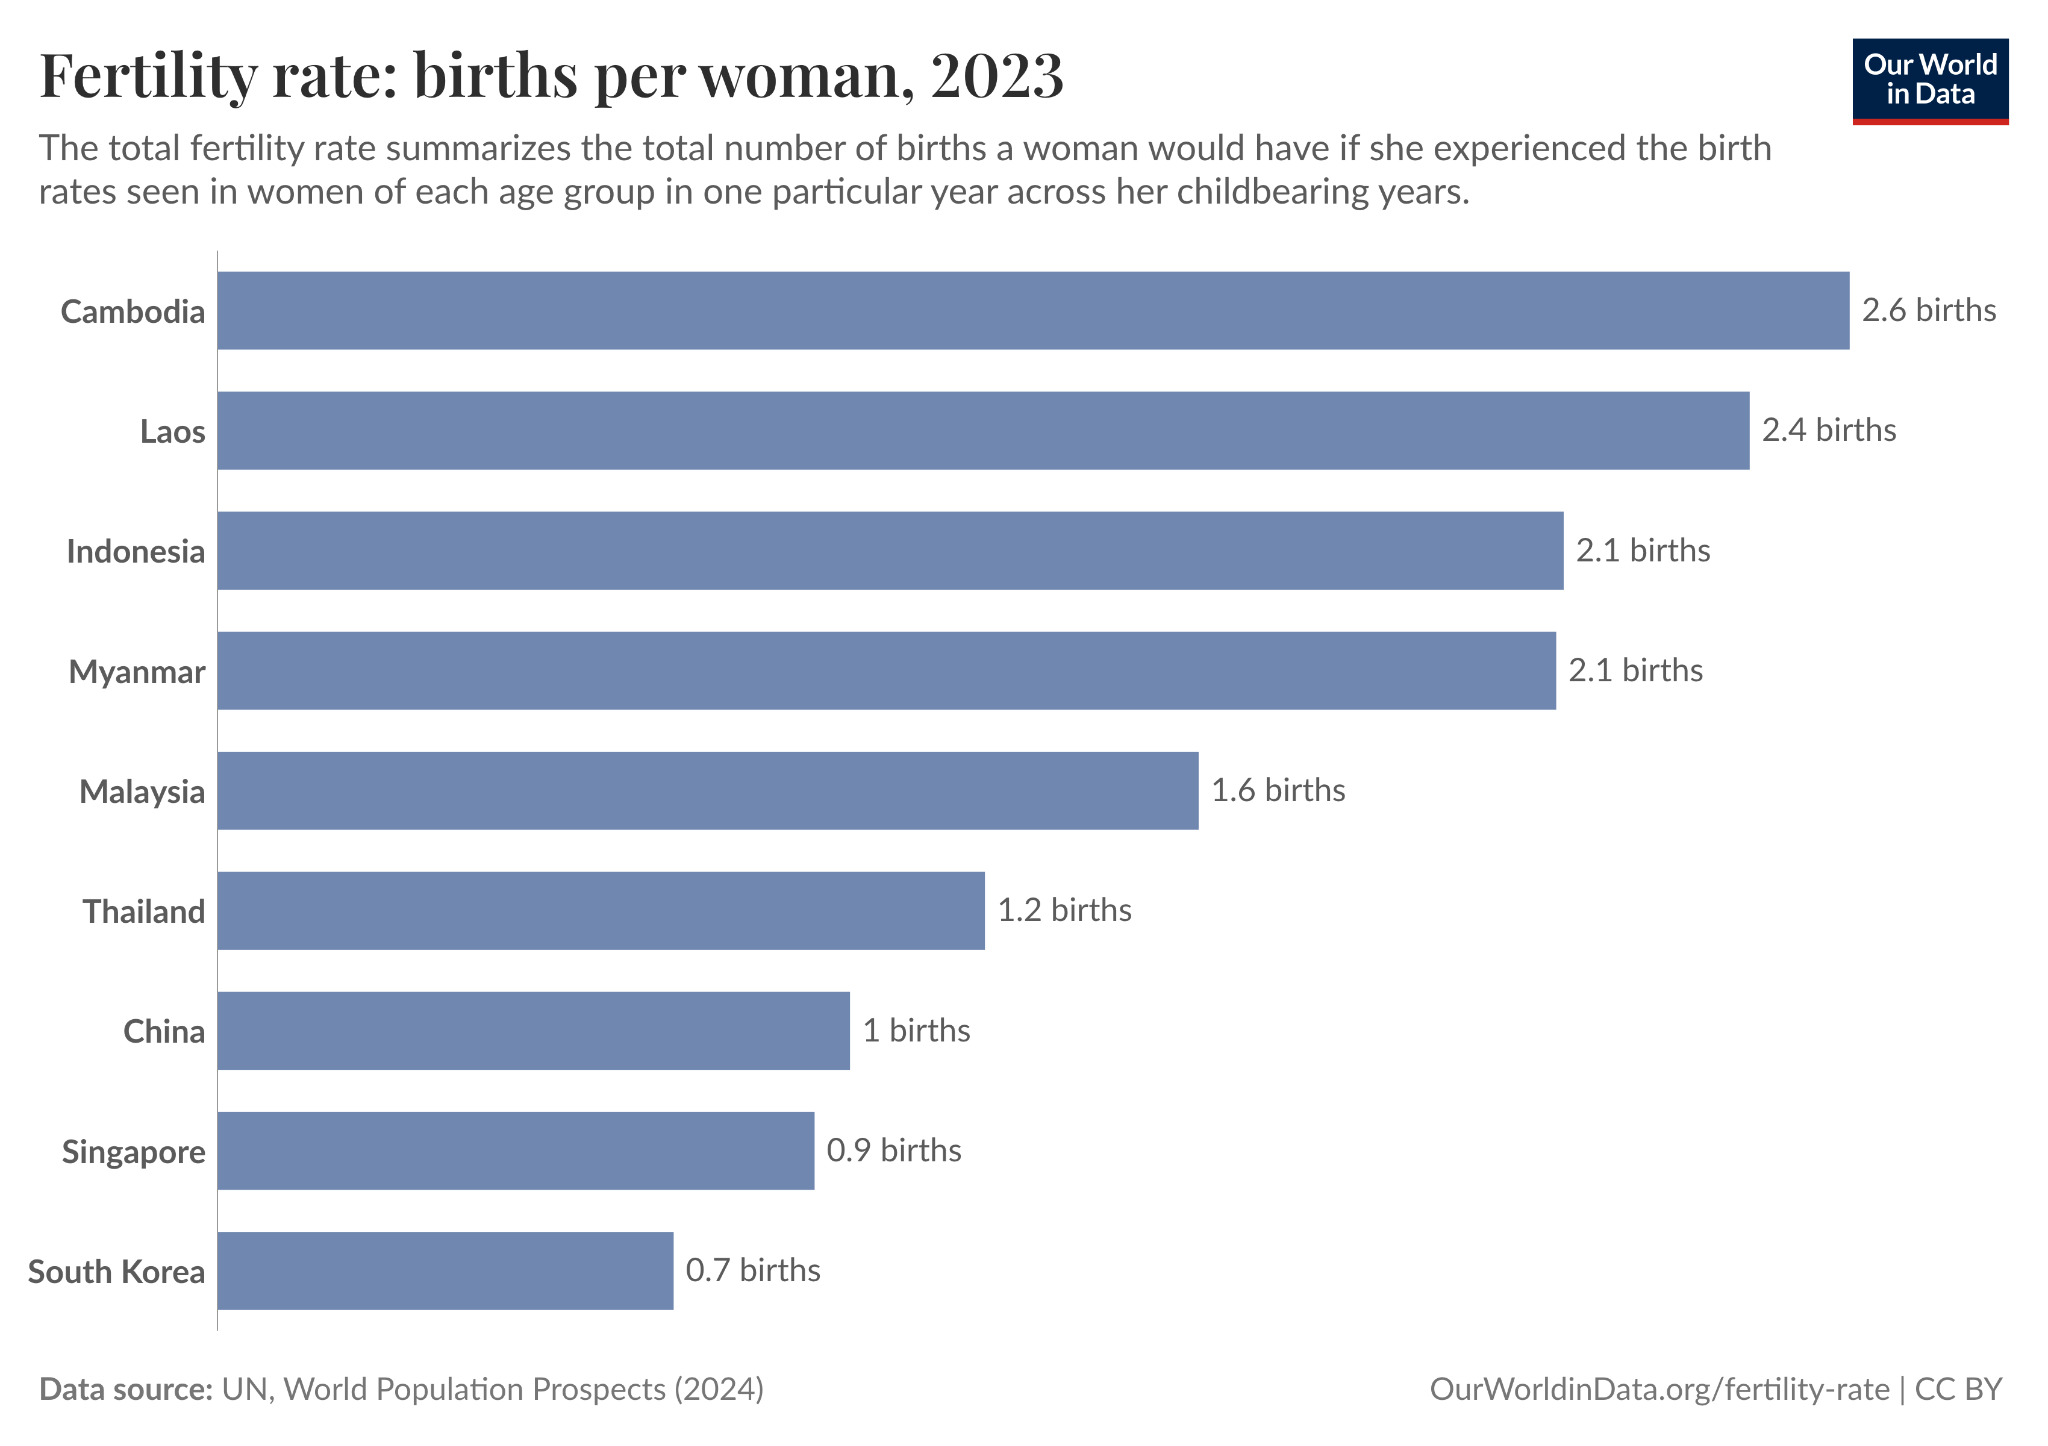
The UN puts recent total fertility rates at around 1.2 children per woman. National statistics and some other sources put it even lower, at just 1.0. This makes it an “ultra-low fertility” country, next to South Korea, Singapore and China.
These rates are much lower than those of its neighbours in Southeast Asia, as shown in the chart. Malaysia — which is richer than Thailand per person — sits at 1.6 births. Others have rates over 2 births per woman.
But what is more striking is how quickly fertility rates fell and the fact that this happened when Thailand was still at a very low level of income.
When people think about rapid fertility decline, they often think of China because of its one-child policy. But Thailand’s trajectory is incredibly similar; it’s basically the same line, without the bumps.
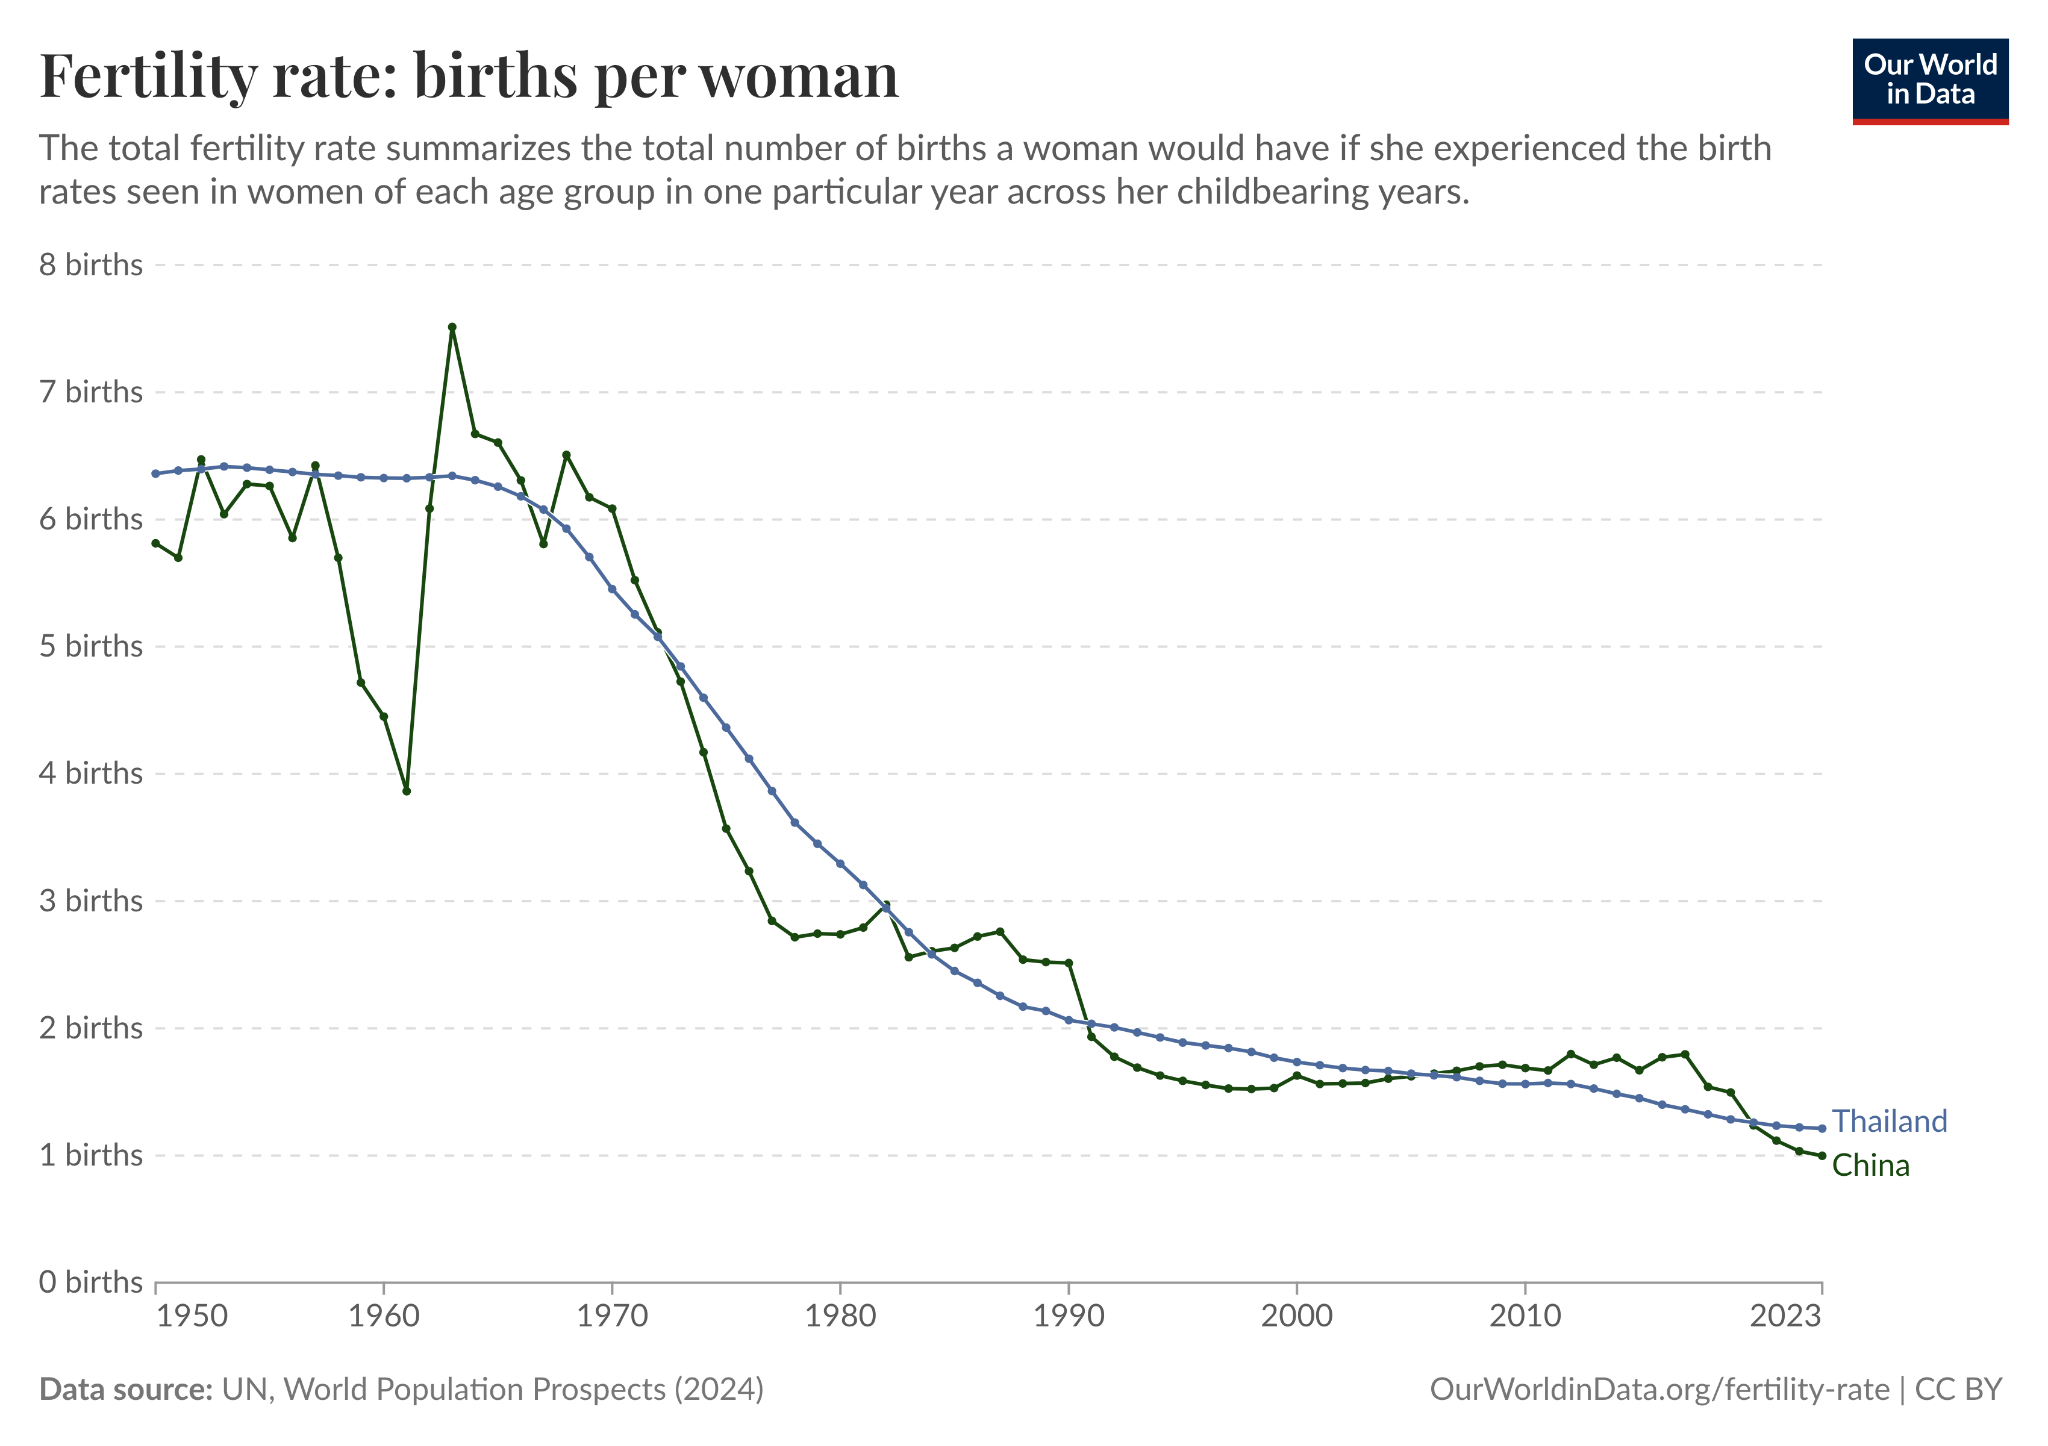
In 1970, women were having, on average, five or six babies. By 1990, this had dropped below 2.1, the replacement rate, which is the average number of children a woman needs to have to keep a population size stable over time. Dropping from 5.5 to 2 over just two decades is among the fastest fertility declines in the world.
It reached this level of low fertility at a much lower income level than most other countries.
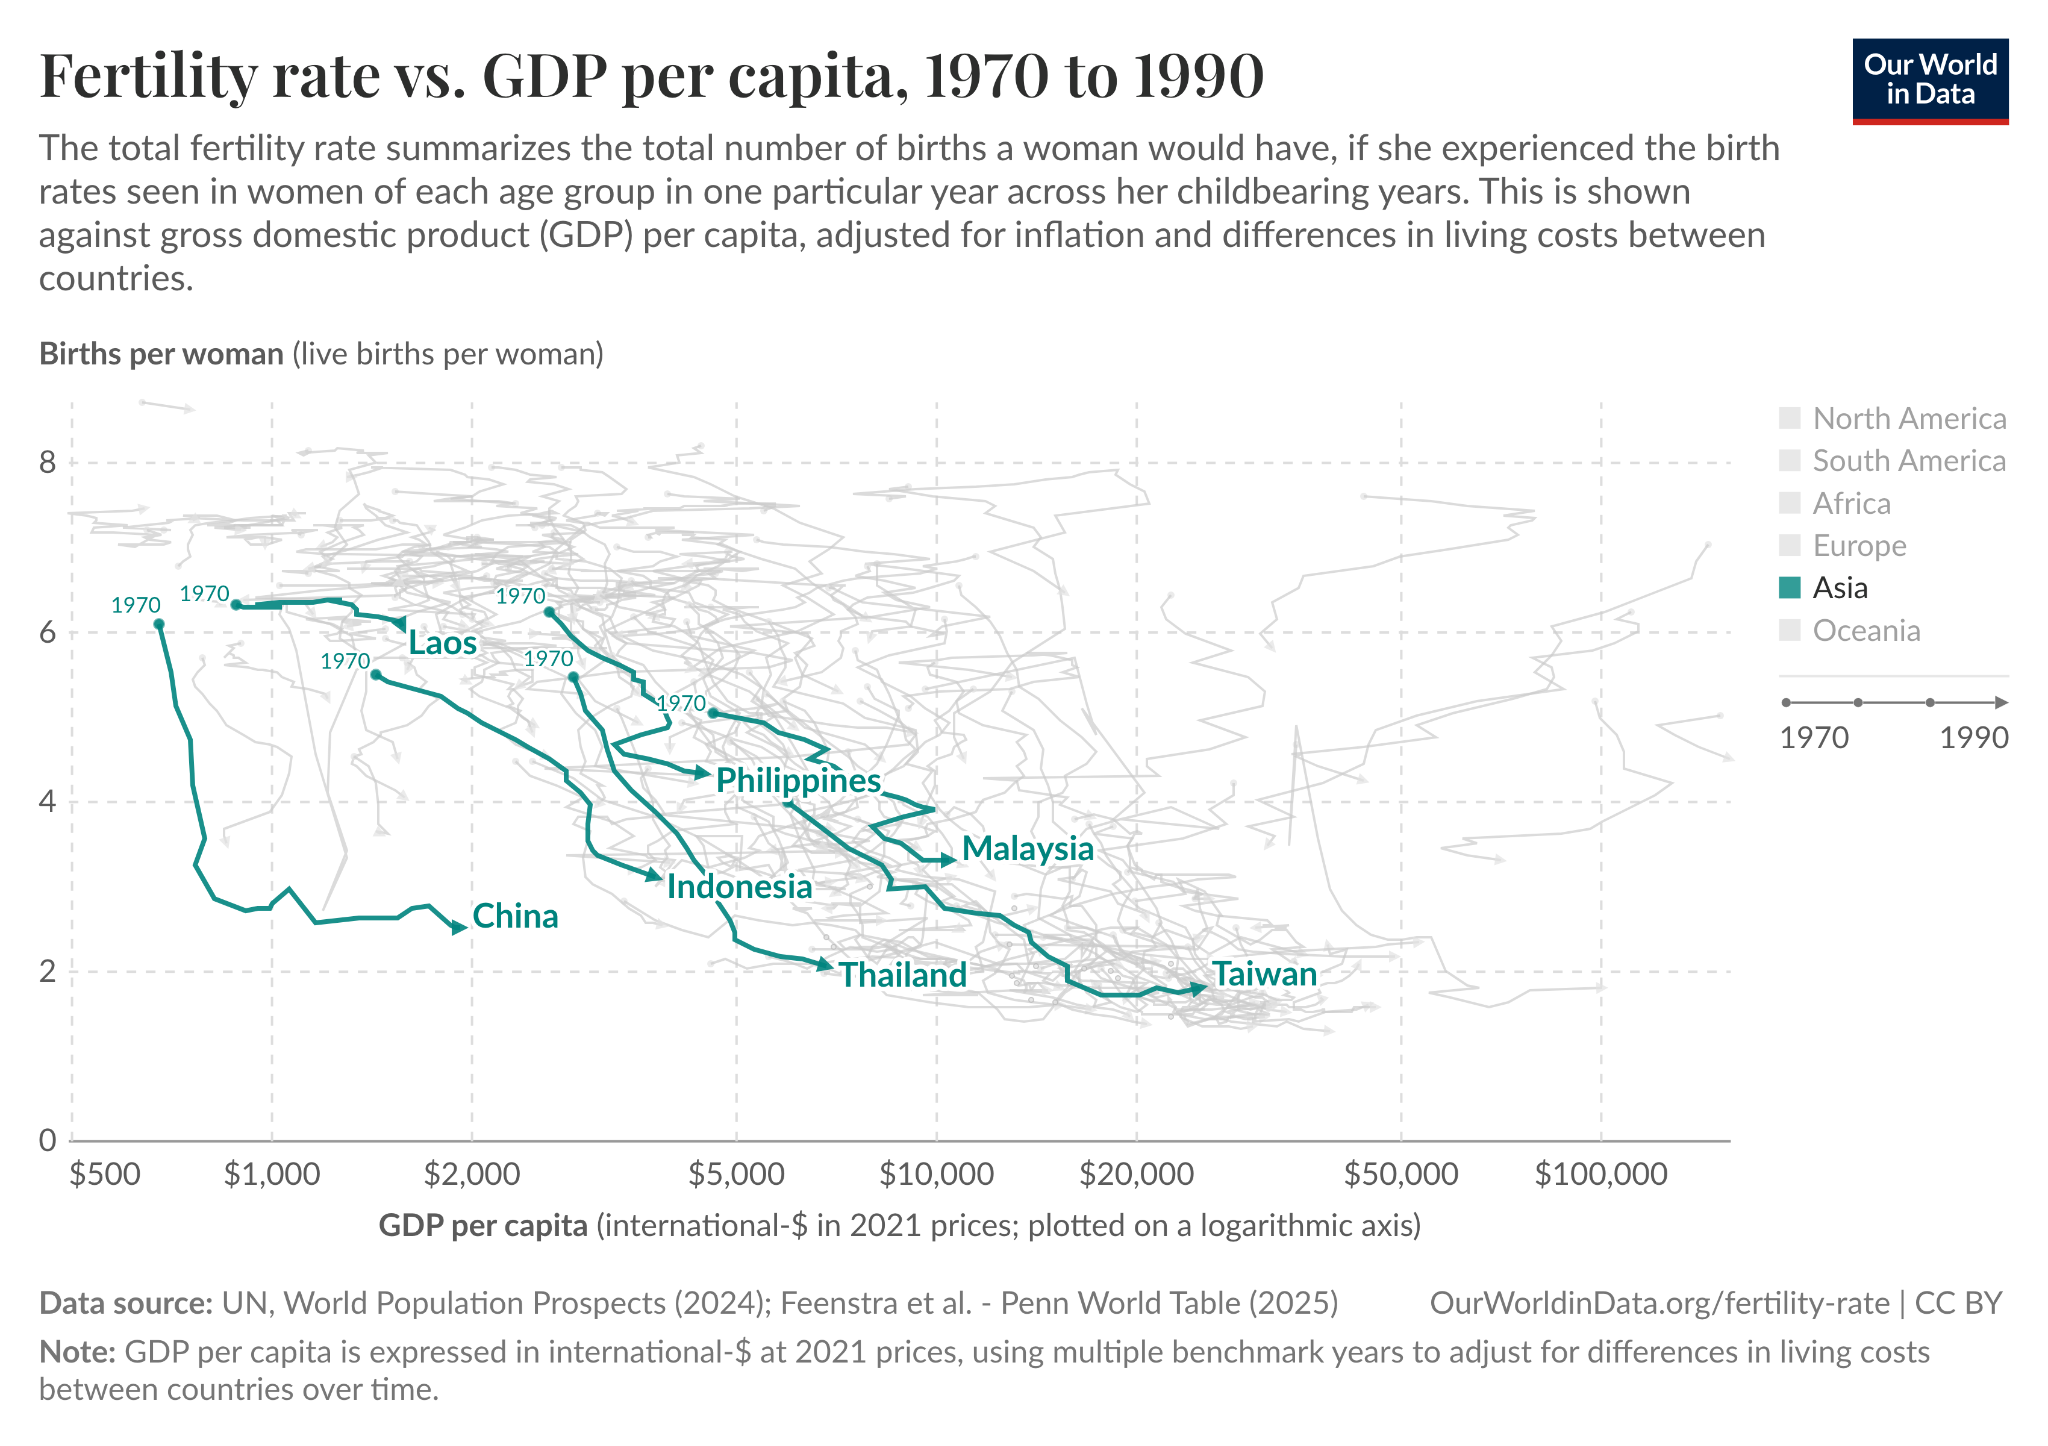
This next chart is a bit of a messy one to interpret. On the y-axis, we have the fertility rate. On the x-axis, we have GDP per capita, on a logarithmic scale.1 It’s a connect scatterplot, joining the dots for these countries between 1970 and 1990. I’ve highlighted Thailand and some regional neighbours to compare them.
You can see that Thailand’s line is much steeper than most others. Its fertility rates dropped at far more modest levels of income. In 1990, Thailand had reached just 2 births per woman, and at a GDP per capita of around $6,800. When Malaysia had this same level of GDP, its fertility rate was 4.5. It only reached replacement-level fertility in 2015, when its GDP per capita was $23,000 — at least three times Thailand’s crossing point.2
Thailand’s fertility-income story is not quite as stark as China’s: it reached 2 births per woman at just $2,000 per person. But it is one of the strongest examples of a country that moved rapidly down the fertility-income curve.
Evidence of this is that, in the 1980s, academics were writing books titled “Thailand’s Reproductive Revolution: Rapid Fertility Decline in a Third World Setting” [emphasis mine]. As it puts it in the abstract:
“The Thai experience is an especially important case study in part because its fertility decline took place while the country was still at only a moderate stage of socioeconomic development [...]”
There are a number of factors that, at least in part, explain Thailand’s rapid demographic transition.
In the 1960s, the country was fairly dismissive of the UN and World Bank panics about overpopulation. But in 1970, it launched its National Family Planning Program, aiming to reduce population growth from 3% to 2.5% (a pretty modest fall).
Compared to China, this program was non-coercive and voluntary. Some of the slogans were explicit: “The more children, the poorer”, but the approach focused on increasing access to contraception, increasing women’s education, and family planning access. The pill became available over-the-counter. Contraceptive use did rise rapidly: from just 15% in 1970 to 57% in 1980, and 75% by the mid-90s.
Education beyond primary school also increased rapidly. In the early 1970s, just one in five girls and one in four boys were enrolled in secondary school. By the early 2000s, this was almost universal.
Religion probably also played an important role. Most of the Thai population followed Theravada Buddhism. This places no obligation on fertility, does not demonise contraception, and leaves family planning to individual choice. This developed a different culture from some of its neighbours, where Islam or Catholicism dominated, placing more emphasis on early marriage and fertility, or rules against the use of contraception.
Of course, like many other countries, Thailand’s messaging has turned pronatal. In the last five years, it has set out a number of programs: “Give Birth, Great World”; “Having Children for the Nation” and “Every Birth Matters“. It has proposed all of the usual incentives: childcare support, tax waivers for families with two or more children, and IVF subsidies.
There is little evidence that these have shifted things in countries like South Korea and Singapore. I’d be surprised if they work in Thailand, either.
So it seems likely that the country has really passed its population peak. It will be several decades before some of its neighbours join it.
This data is adjusted for inflation and differences in costs across countries.
This longer-run GDP data is measured in 2011 prices.
Comments
Nothing yet. Say the first thing.
Sign in to join the conversation.