
This post belongs to a blog series documenting the journey of building a startup from scratch. We’re currently building Roam- a card for international travelers and nomads. Learn about it here.
How can you tell if a business is working?
For startups, it’s tricky. There are no objective conditions that measure the health of a company. At best, we can collect metrics and use them to nudge the business in the direction we think is valuable.
There are three steps to working with metrics:
Define a primary Key Performance Indicator (KPI). The primary KPI is the so-called “North Star” metric for the business, and this generally reflects whether the business makes money or not. This metric doesn’t say 100% about how the business is doing, but it should be an indicator of the company’s overall health. Most importantly, monitor the growth of the primary KPI.
Identify the supporting metrics that help you achieve your primary KPI. While the primary KPI is a broad metric, supporting metrics show the business’s health in more granular terms. Supporting KPIs should either directly or indirectly support the primary KPI.
Decompose each step into digestible, workable tasks. Each task should link to a KPI. If not, the task is probably not worth spending time on.

What are some reasonable KPIs for the Roam Card? Our current core objectives are:
Identify core customer segments (travelers) and nail the value prop
Build MVP product (card)
Roll out MVP to beta users
We can create a set of KPIs to track our success with these goals in mind. But first, let’s start by crossing out the metrics that don’t matter:
Vanity metrics feel good but have no substantive impact on the business. These metrics frequently trick founders into spending their time on the wrong things. Good metrics lead to the growth of the primary KPI; vanity metrics don’t materially affect the business.
Rule of thumb: If there is no link between the metric and the primary KPI, it’s probably a vanity metric.
Landing page signups
Every landing page should have a call to action that asks the users to do something. Landing pages for unreleased products generally include a “Join Beta” signup link. Signup count is easy to nudge, but it’s also a vanity metric. Signups can fool founders into believing they have product/market fit even though customers haven’t committed anything substantial. While signups may eventually influence revenue, it doesn't represent real value. However, signups are still a great way to reach out to customers directly and get pre-commitments— a real metric.
Collecting advisors
Are advisors customers? Do advisors pay you money? Are advisors part of the product? (No, no, and no). Advisors can be helpful for many reasons, but they don’t materially affect your business.
Pitching/Fundraising
Pitching feels like work, but it does not drive the core business. Focus on metrics that make the company worth investing in first. Obviously, funding keeps the company alive, but it’s not a real metric to optimize. Don’t be fooled into thinking startups that raised a ton of money have product/market fit.
An old saying goes, “When the student is ready, the master will arrive.” Raise when the growth metrics justify the need for capital.
Twitter/Networking
Twitter is, at best, a networking tool. But on average, it’s a waste of time. Using social media ≠ building something people want. Unless networking is directly related to getting customers, focus on something else. Don’t waste time playing performative entrepreneur. Just build!

For Roam’s current goals, we chose a set of KPIs that directly relate to customer discovery and early adoption.
There are numerous platforms such as Mixpanel, Segment, or Amplitude for visualizing metrics. However, most tools are too sophisticated or expensive for tracking early-stage startup metrics. (Or, they overemphasize vanity metrics).
To keep things simple, we use Excel and Python.
Primary KPI: Monthly revenue
Monthly revenue is probably the simplest metric for most businesses. It’s easy to calculate, and it’s a no-BS way to tell if things are working. One downside: given the considerable technological effort needed to get an MVP out the door, monthly revenue will remain flat for a while. But at the end of the day, monthly revenue is probably the best primary KPI since the growth rate directly reflects the health and potential of the business.

Supporting KPI: Customer interviews
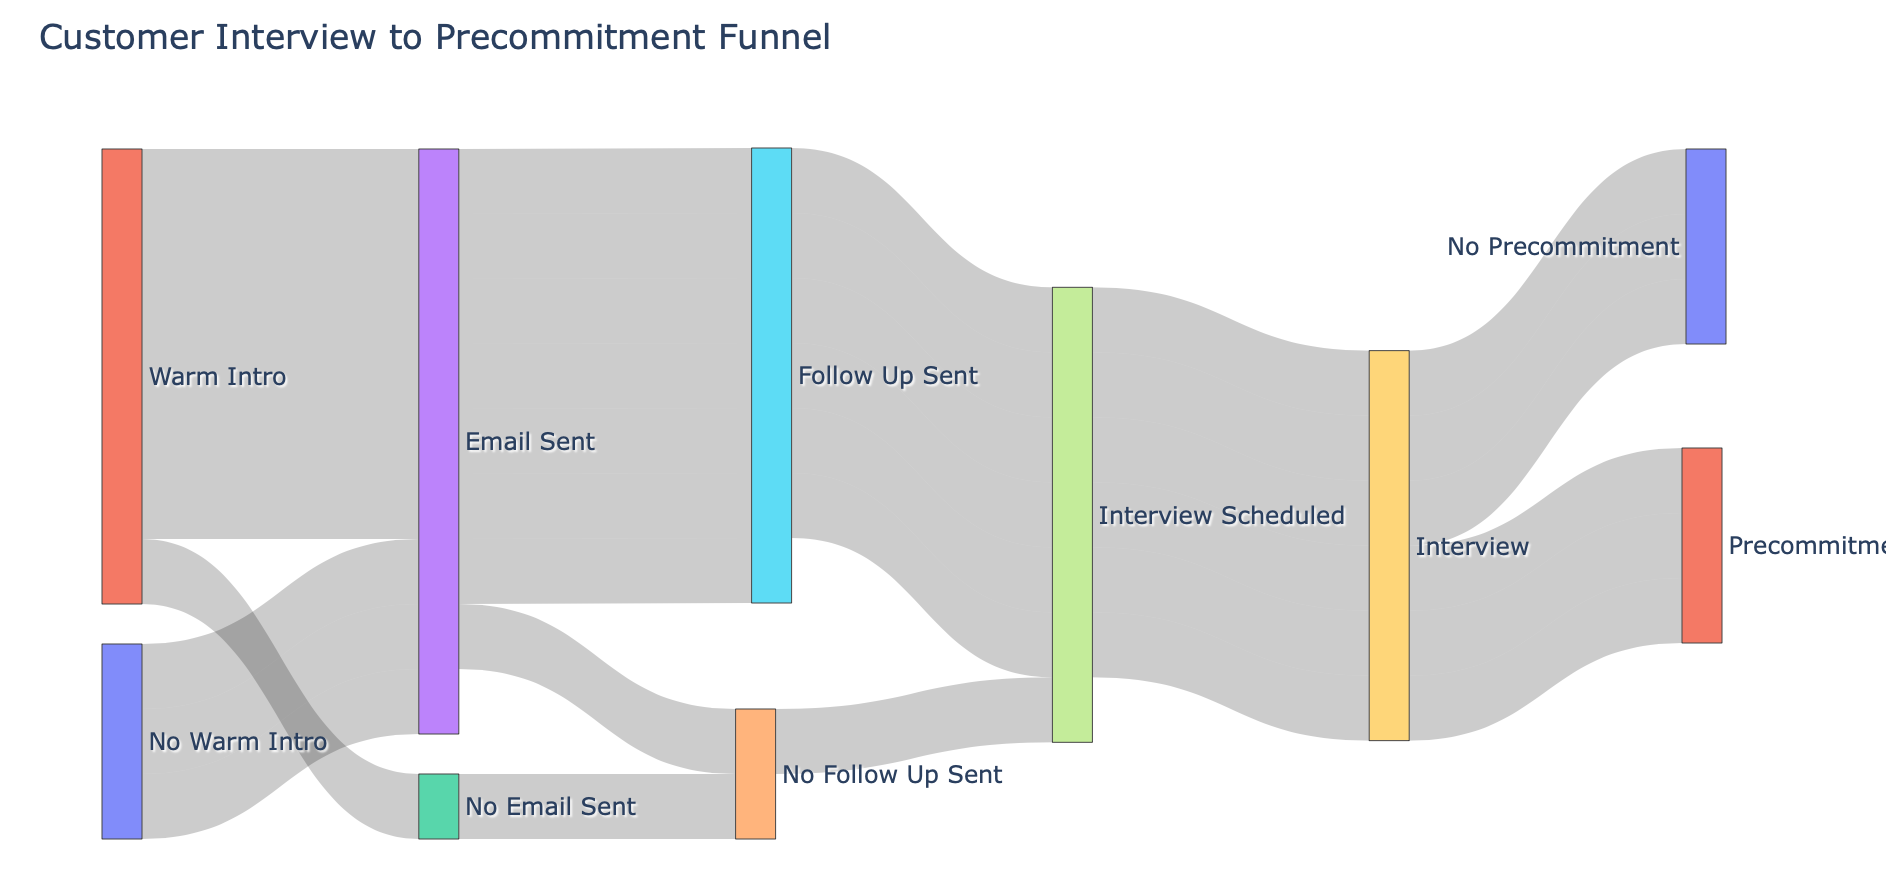
All startups need customer feedback. For pre-product startups, talking with customers is the best way to move product vision in the right direction. (The best way to do this is by running the Mom Test). Customer conversations are often from people who signed up for the landing page, but they can also be friends or friends of friends. Unfortunately, just talking to customers is a deceptive KPI; discussions must convert into learnings and commitments. Every discussion should result in:
3 key learnings summarized
A lightweight set of notes about the interview with exact quotes (and corresponding emotional expressions)
Asking for a pre-commitment and referrals to at least 2 other potential customers
A great way to visualize your interviews is with a Sankey or funnel diagram.
Supporting KPI: Pre-commitments
A pre-commitment is any substantial trade by the customer in exchange for a product that is not immediately delivered. The funny thing about users is that they will lie to you. In customer interviews, nobody wants to hurt the founder’s feelings. But if you ask for a commitment, they show their true colors. If they throw cash at you, then you’re onto something. Otherwise, it’s fluff. For example, Kickstarter asks backers to pre-purchase products with no guarantee that they will ever be delivered. If users don’t want the product, then they won’t stake anything.
Pre-commitments usually include direct payments such as pre-orders, but they could also include receiving PII (i.e., address/phone number, not just email) or effort that shows intent to pay (i.e., a fake pre-payment form that doesn’t charge the user). These are usually strong indicators that the user is in pain and wants the product. A pre-commitment is a convincing statement that the customer will swap their existing card for a Roam card.
Supporting KPI: Runway
Startups run on money, not magic. Runway is a valuable metric because there are two things you can easily manage: the cash going in and the cash going out. Every startup should seek to be default alive.

Supporting KPI: Daily Transactions
Many social apps measure their success by daily/monthly active users, but this usually only matters when a large userbase is a prerequisite to monetization. However, the story is different for cards since transactions are directly monetizable. So, daily transactions are a good metric to track. This metric will come into play after we launch our closed beta.

Not every metric is immediately valuable. Some metrics are better worth tracking after the business picks momentum.
Features shipped
It’s tempting to start building immediately and count the number of new features as a success metric. Eventually, getting to a stage where the product can stand on its own becomes an absolute requirement. However, in the earliest stages, getting customer validation is much, much more important than code. When enough customers are interested, then it’s time to build a functioning MVP.
LTV:CAC (Lifetime Value to Customer Acquisition Cost)
LTV:CAC is an excellent metric to optimize decisions concerning existing customers, and it’s also a great way to forecast the success of your business. For pre-product companies with a landing page, replace CAC with ad CPC (cost per click) and LTV with your best guess of how much you expect users to pay before churning. Any LTV:CAC > 3 means you’re onto something. Once customers are on board, this should be a KPI to monitor. Andreessen Horowitz offers an excellent breakdown of other LTV and CAC considerations.
NPS (Net promoter score)
NPS measures how likely a customer is to promote your product to others. NPS is the difference between the percentage of promoters minus detractors (i.e., answer on a survey “I would recommend this product to a friend). Although NPS metric suffers from selection bias, it’s a good way to understand customer satisfaction.
Organic vs. Paid users
Understanding where users come from can make or break a business. Many businesses make the mistake of thinking you can buy customers. This isn’t entirely false, but if users are joining of their own volition, then this is a powerful engine of growth.

Example user signup breakdown chart

Every piece of work should be linked to a KPI. It’s usually the case that if a task doesn’t improve a KPI, then it’s probably not worth spending time on. Additionally, every piece of work should be ranked by highest impact and lowest difficulty.
Every work item should be tagged by:
The KPI(s) it affects
The impact of completing this item on the KPI(s)
The difficulty of the item
Here’s a snippet of some example tasks from our Kanban board:

Text within this block will maintain its original spacing when published
Plans are useless, but planning is indispensable. — Dwight D. Eisenhower
It’s easy to get lost and boost the wrong numbers. But it’s also tempting to let metrics take control of the business. Remember: service the business, not the metrics. Chart the direction of the business and pick the metrics that matter most, but also consider that we can always swap metrics if the business changes directions.
Absolute metrics reflect the business’s health, but above all else, growth is the top priority. Timebox absolute goals, but focus on exponential goals.
Want to join the Roam Card closed beta? Sign up here
No posts
Comments
Nothing yet. Say the first thing.
Sign in to join the conversation.