
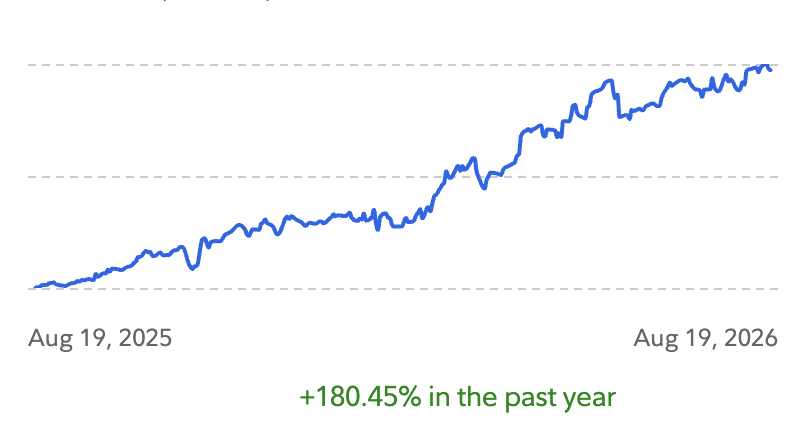
Guardian portfolio, August 19, 2025 to August 19, 2026.
The Guardian portfolio is up 180.45% over the trailing year, against roughly 13% for the S&P 500 and 22% for the Russell 2000 over calendar 2026 to date. That gap did not come from leverage or a single lottery ticket. It came from owning small and mid cap businesses that most funds are structurally unable to buy, sizing them unevenly on purpose, and refusing to sell the ones that worked.
Below the paywall you get the whole book. Every ticker, every weight, every average cost, and a write up on each of the twenty positions covering the moat, the catalyst calendar into 2027, the insider buying I can verify from Form 4 filings, and which management teams only get paid if the stock price actually goes up. You also get the sector map, what this portfolio shape did during the March drawdown when the S&P fell about 8%, and what I plan to do from here with a fully invested book and zero cash.
If you ever read one thing from me, it should be this.
Three things did the work. The first is position sizing that would get me fired at most shops. My largest holding is 18.22% of the book. My smallest is 1.13%. I do not equal weight.
The second is where I fish. Most names in here are businesses a $40 billion fund cannot own in size without becoming the shareholder register. That constraint is my edge, and it is the only edge in this business that does not decay when other people find out about it. Capacity constraint is one of retails best edges.
The third is that I bought things while they were being thrown away. You’ll see this in the table. Several of my cost bases sit within a few percent of today’s price, because I rebuilt those positions inside the last few months, in names that were down 30% to 55% from their highs while the business was getting better. The unrealized gain on the current book is only 5.87%. The 180% is what came before it.
Know what you’re walking into. The Shiller CAPE ratio closed at 42.15 on August 19, within about 5% of the December 1999 record. Forward twelve month P/E on the S&P is 20.0x, above both the five and ten year averages. The top ten names are roughly 37% of the index, the highest concentration in the history of the modern index. The ten year Treasury is at 4.71% and the thirty year at 5.28%, near a nineteen year high. The Fed has not moved all year and three voters dissented in July because they wanted to hike.
That is a market where the index is expensive, crowded, and rate sensitive all at once. It’s also a market where the Russell 2000 has beaten the Nasdaq 100 year to date and small caps entered 2026 at a 33 year relative valuation low against large caps. Both things are true. I own the second one. STOCK PICKERS MARKET!
One thing to set expectations. There’s less hand holding in this group than you’ll find elsewhere, because I spend my hours on research rather than walking every subscriber through every decision I make. I post the trades, I post the reasoning, and I answer real questions in the chat. What I don’t do is tutor.
Join the chat and come argue with me about any of these twenty names. It’s free to join, and it’s where I post trades as I make them.
Go paid for the full research archive, every position update, and my trades in real time inside the chat. Everything below this line is for paid subscribers.
Comments
Nothing yet. Say the first thing.
Sign in to join the conversation.