

📣 If this helped make sense of why markets are moving the way they are… share it.
Commodity markets are often thought of as a function of supply and demand. This week showed that government policy and geopolitics can be just as important.
Across three very different markets… diesel, silver, and global shipping…political decisions reshaped the outlook.
In Europe, analysts warned that diesel inventories could fall to multi-year lows as refining bottlenecks, export restrictions, and geopolitical tensions tighten supplies.
In India, silver imports plunged more than 90% after changes to the country’s import tax regime. While the headline appears bearish, the decline reflects government policy more than a collapse in physical demand.
Meanwhile, Yemen’s Iran-backed Houthis announced a maritime blockade targeting Saudi Arabia, adding another layer of uncertainty to an already fragile global energy supply chain.
Taken together, these developments highlight a broader trend: governments are playing an increasingly important role in commodity markets. Whether through taxes, export controls, or military conflict, political decisions are becoming just as influential as traditional supply and demand fundamentals.
For investors, understanding these structural shifts is becoming essential. In an increasingly fragmented world, policy decisions can reshape capital flows, commodity markets, and inflation long before those changes appear in the economic data.
Crude oil prices often dominate energy headlines, but the more important story this week may be unfolding further down the supply chain.
According to Morgan Stanley, Europe’s diesel market is becoming increasingly constrained as multiple supply disruptions converge at the same time. Analysts expect inventories to fall toward multi-year lows by the end of the year, while refining margins have climbed to record levels, signaling growing stress in the market.
Unlike gasoline, diesel is the fuel that keeps much of the global economy moving. It powers freight trucks, construction equipment, agricultural machinery, mining operations, rail transport, and much of Europe’s industrial base. Because of its central role in transporting goods and supporting heavy industry, changes in diesel prices often ripple through the broader economy.
Several developments are contributing to the tightening market.
Recent disruptions to shipping through the Strait of Hormuz have increased uncertainty around global fuel flows, while Ukrainian strikes on Russian refineries have reduced refining capacity available to the international market. At the same time, Russia’s restrictions on diesel exports have removed another source of supply from an already tight market.
Morgan Stanley argues that the primary constraint is no longer crude oil production itself, but rather the ability to refine crude into usable fuels.
“The real bottleneck in the oil system right now is refining, more so than crude.”
That distinction is important.
While crude oil supplies remain relatively available, the infrastructure required to convert crude into diesel has become increasingly constrained. Europe’s diesel crack spreads—the premium refiners earn by producing diesel instead of crude—have risen to record highs, reflecting strong demand for refined products relative to available supply.
The bank expects European diesel inventories to decline steadily through the second half of the year, reaching approximately 299 million barrels in November, the lowest seasonal level since at least 2015.
The tightening market is also being influenced by developments far beyond Europe.
Although China exports little diesel directly to Europe, slower refinery activity there has reduced the overall volume of refined petroleum products entering global markets. With less surplus fuel available internationally, fewer cargoes are available to offset shortages elsewhere, further tightening supply.
Taken together, these developments highlight how interconnected today’s energy markets have become. A disruption in Middle Eastern shipping, refinery outages in Russia, and weaker processing rates in China are all contributing to tighter diesel markets thousands of miles away.
While Morgan Stanley highlights the current tightening, the bigger question for investors is where European fuel markets could be heading over the next several months.
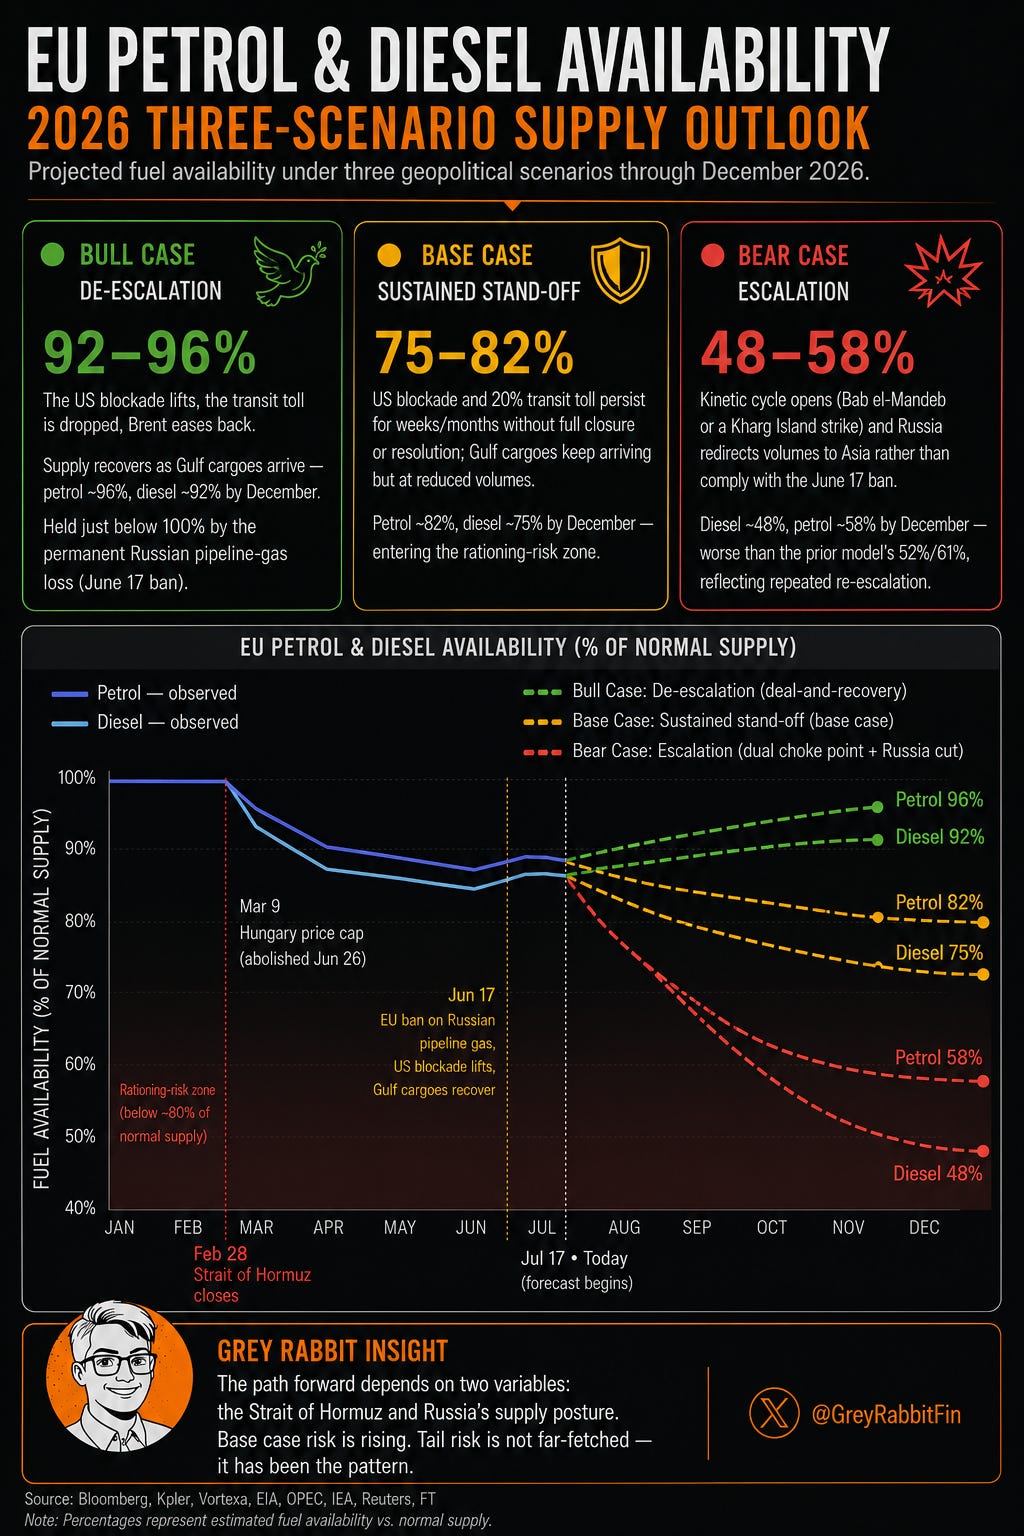
A de-escalation in Middle East tensions allows shipping through the Strait of Hormuz to normalize. Additional Gulf exports return to market, transportation costs ease, and refining bottlenecks gradually improve.
The conflict remains contained but unresolved. Shipping disruptions persist, freight costs remain elevated, and Europe continues competing for limited refined fuel imports. Under this scenario, diesel availability gradually enters levels where localized shortages become increasingly possible.
The conflict broadens further, disrupting additional shipping routes or energy infrastructure. Europe faces significantly tighter fuel markets, increasing the risk of rationing and renewed inflationary pressures.
Diesel is often viewed as a leading indicator of industrial activity because it fuels transportation, manufacturing, agriculture, and construction.
Persistently tight diesel markets increase freight costs, raise business input prices, and can place renewed upward pressure on inflation—even if crude oil prices remain relatively stable.
While Morgan Stanley cautions against chasing the recent rally, the broader story is no longer simply about crude oil. It is about refining capacity, shipping security, and the resilience of global energy supply chains.
India’s silver imports fell sharply in May, dropping to just 46.8 metric tonnes, down from 534.3 tonnes during the same month last year—a decline of more than 91%.
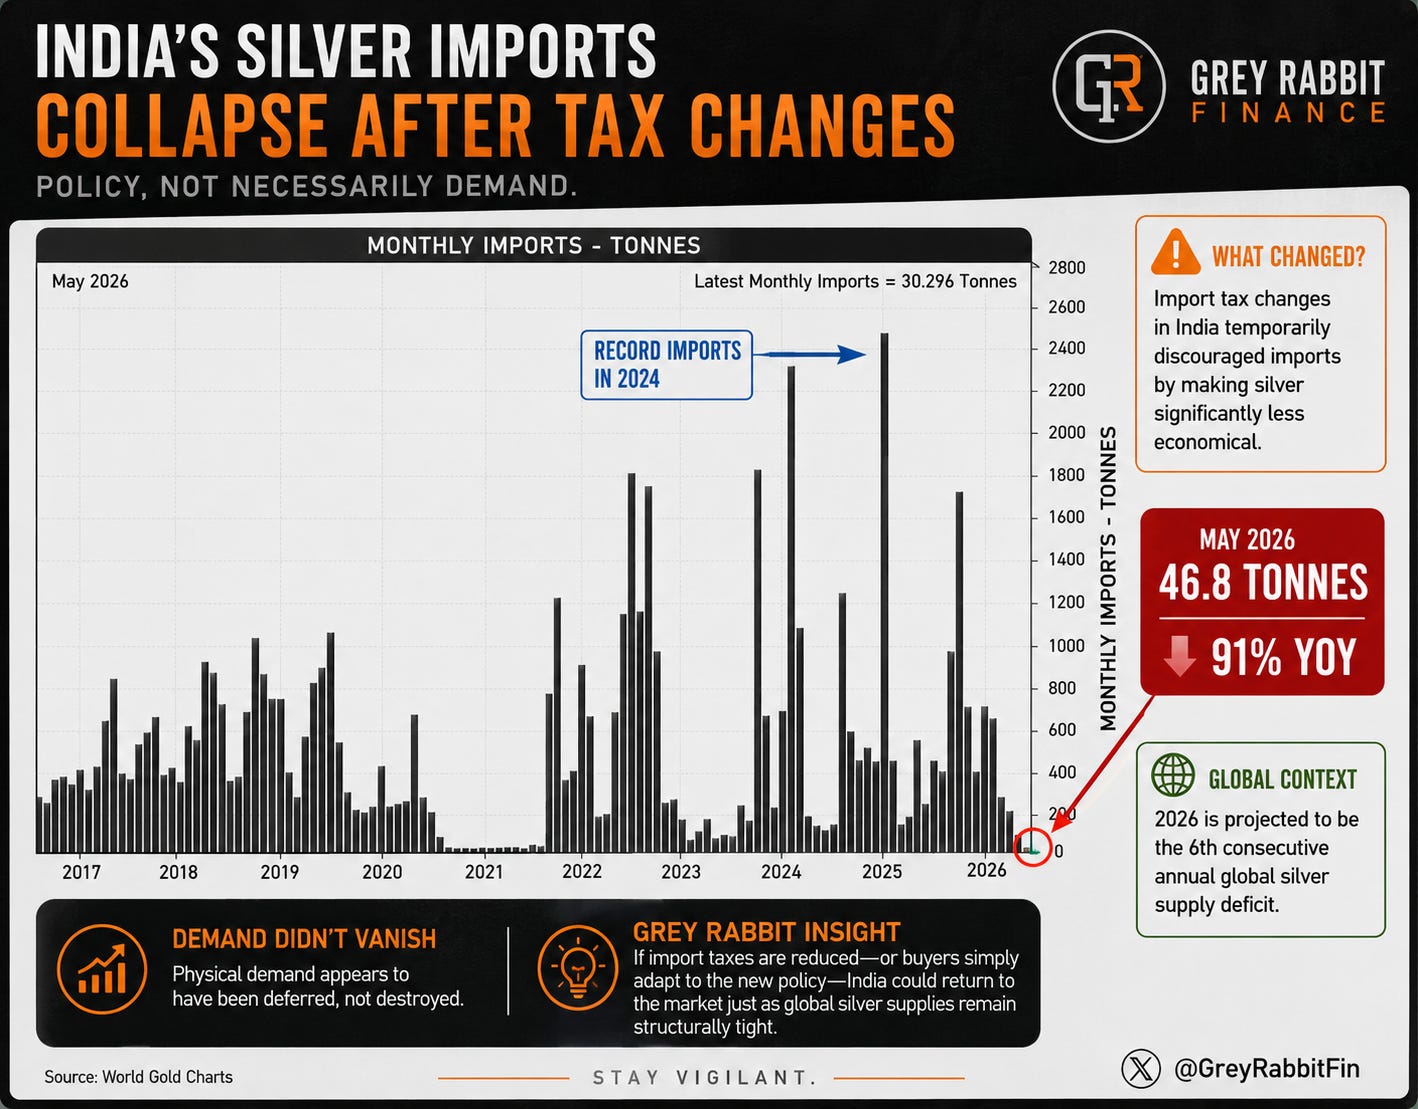
At first glance, the figures appear alarming. India has become one of the world’s largest sources of physical silver demand in recent years, and such a dramatic slowdown could easily be interpreted as weakening investor appetite.
The underlying story, however, appears to be far more nuanced.
The collapse follows changes to India’s import tax structure that significantly altered the economics of bringing silver into the country. Rather than reflecting a sudden loss of demand, the decline is widely viewed as a policy-driven disruption that has temporarily discouraged imports while market participants adjust to the new tax environment.
That distinction matters because India’s appetite for silver has been one of the defining features of the physical market over the past several years.
Demand has been supported by investment buying, jewelry fabrication, industrial consumption, and growing use in solar manufacturing. At the same time, the global silver market is expected to remain in its sixth consecutive annual supply deficit, with forecasts calling for another 46.3 million-ounce shortfall in 2026.
In other words, one of the world’s largest physical buyers has temporarily stepped back from the market just as global supplies remain structurally tight.
Whether this slowdown proves temporary will largely depend on future government policy.
If import duties are reduced or market participants adapt to the new tax regime, import volumes could recover rapidly as deferred purchases return to the market. Rather than eliminating demand, higher taxes may simply postpone it.
History has shown that when governments distort commodity markets, buying often shifts in time rather than disappearing altogether.
Headline import data can sometimes paint a misleading picture.
India’s sharp decline in silver imports appears to be driven more by government policy than by deteriorating physical demand. If tax policies are eventually relaxed—or if buyers simply adjust to the higher costs—India could re-enter the market at a time when global silver supplies remain constrained.
With the Silver Institute projecting a sixth consecutive annual supply deficit, the return of one of the world’s largest physical buyers could tighten an already undersupplied market. For long-term investors, the recent collapse in imports may prove less a sign of weakening demand than a temporary pause in purchasing.
Just as markets were beginning to assess the impact of disruptions in the Strait of Hormuz, another geopolitical risk emerged elsewhere in the region.
On Monday, Yemen’s Iran-backed Houthi movement announced a maritime blockade targeting Saudi Arabia, declaring that vessels linked to the kingdom would be targeted under what it described as an “eye for an eye” policy following the recent escalation in hostilities.
The announcement raises fresh concerns about the security of global energy supply chains.
While the Strait of Hormuz remains the world’s most important oil transit route, the Red Sea and the Bab el-Mandeb Strait form another critical corridor connecting Middle Eastern energy exports with Europe. Together, these waterways carry a substantial share of global crude oil, refined petroleum products, and containerized trade.
Although it remains unclear how effectively the Houthis can enforce the blockade, previous attacks on commercial shipping have demonstrated their ability to disrupt maritime traffic and increase transportation costs. Even the perception of elevated risk can raise insurance premiums, lengthen shipping routes, and increase freight costs.
The latest announcement comes as Europe’s diesel market is already tightening and global refining capacity remains under pressure. Any additional disruption to regional shipping could further constrain fuel supplies, particularly if vessels are forced to reroute around southern Africa.
Modern supply chains depend not only on production, but also on the uninterrupted movement of goods.
Commodity markets often react long before physical shortages emerge. Higher insurance costs, longer shipping times, and increased geopolitical uncertainty can tighten markets well before supply is materially affected.
For investors, this serves as another reminder that geopolitical risk is no longer confined to oil fields or refineries. Increasingly, the security of global shipping lanes has become just as important as the commodities moving through them.
(Opening Price as of July 20, 2026)
S&P 500: 7,489
Gold: $4,017/oz
Silver: $55.62/oz
GDX: $71.14
SLVP: $28.84
Crude Oil (WTI): $82.91/bbl
DXY: 100.48
Bitcoin: $63,587
The week begins with Canada’s latest inflation report. Investors will be watching whether price pressures continue to ease or prove more persistent than expected, as the data could influence expectations for the Bank of Canada’s next interest rate decision and generate volatility in the Canadian dollar.
Inflation remains the dominant macro theme this week as New Zealand releases its second-quarter Consumer Price Index on Tuesday, followed by the United Kingdom’s June CPI report on Wednesday.
While neither release is likely to move global markets on its own, both provide important insight into how quickly inflation is moderating across developed economies and could shape expectations for future central bank policy.
The European Central Bank announces its latest monetary policy decision on Thursday, followed by President Christine Lagarde’s press conference.
Markets largely expect interest rates to remain unchanged, placing greater emphasis on the ECB’s forward guidance. Investors will be looking for any signals regarding the timing of future rate cuts, the inflation outlook, and policymakers’ assessment of the Eurozone economy.
Australia also releases its latest employment report on Thursday.
Employment growth and the unemployment rate remain key indicators for the Reserve Bank of Australia’s policy outlook. Any significant deviation from expectations could lead to increased volatility in the Australian dollar and regional markets.
The week concludes with preliminary Purchasing Managers’ Index (PMI) data from Europe, the United Kingdom, and the United States.
Because PMIs provide one of the earliest monthly snapshots of manufacturing and services activity, they are closely watched as leading indicators of economic momentum. Stronger-than-expected readings would suggest continued resilience in global growth, while weaker data could reinforce concerns about slowing economic activity during the second half of the year.

Trend: Corrective Structure → Recovery Attempt
Major Resistance: 121.64 (Wave 5 High)
Intermediate Resistance: 92.90 → 95.24 → 105.09
Current Resistance: 63.16 → 80.72 (Ichimoku Cloud)
Major Structural Support: 54.78
Current Pivot Zone: 55–63
Timing Watch: July 31 Henka-Bi Window
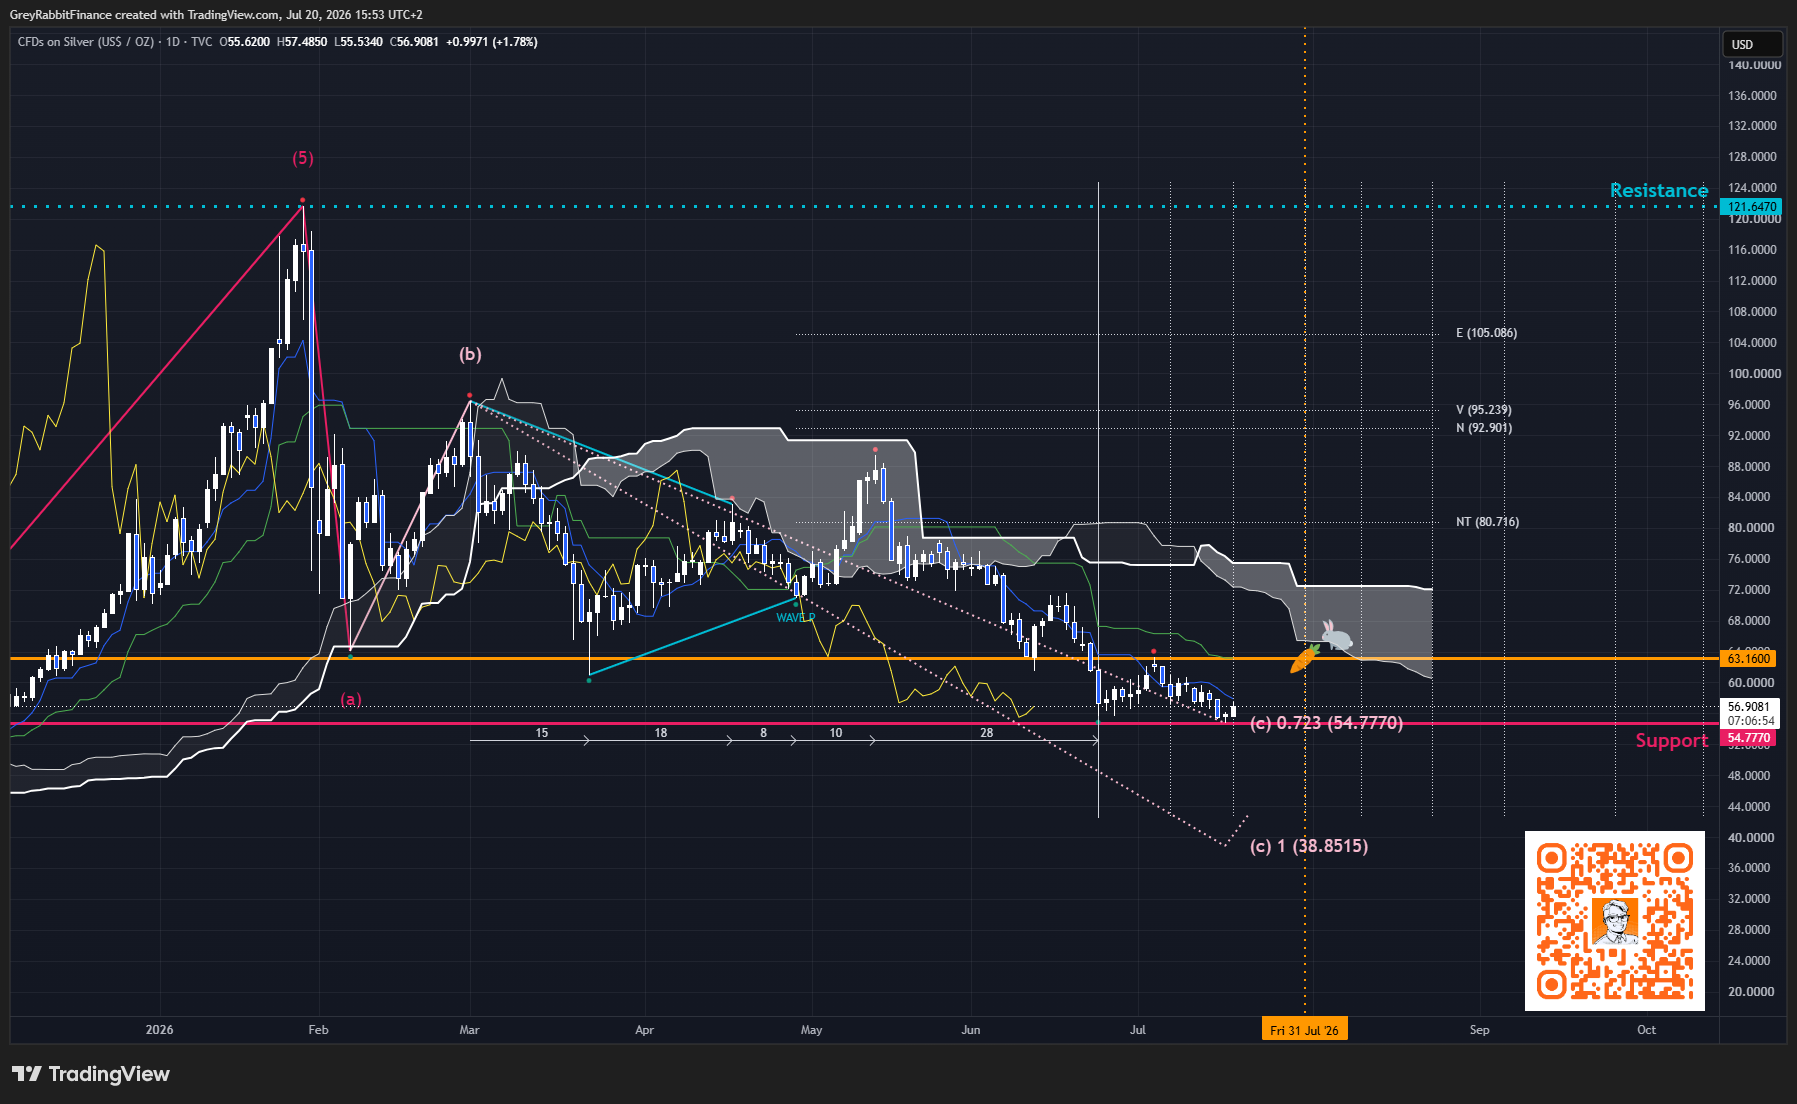
Silver has stabilized after successfully defending the 54.78 structural support, with buyers beginning to challenge the first layer of overhead resistance.
The sharp selling pressure that dominated June has eased, but the broader technical picture remains corrective. Price continues to trade below the Ichimoku cloud and has yet to break the sequence of lower highs that has defined the decline from February’s peak.
The first technical hurdle now sits at 63.16, where previous support has turned into resistance. A decisive break above this level would represent the first meaningful improvement in market structure and shift attention toward the larger technical barrier presented by the Ichimoku cloud near 80.72.
The Ichimoku structure continues to favor caution.
Price remains below the Kumo (cloud).
The cloud continues to define the primary resistance zone near 80.72.
Tenkan-Sen has begun to flatten, reflecting improving short-term momentum.
Kijun-Sen remains above price, indicating the longer-term trend has not yet turned bullish.
Chikou Span remains below historical price action, meaning additional confirmation is still required before declaring the correction complete.
For now, the current advance should be viewed as a recovery attempt within a broader corrective structure rather than confirmation that a new uptrend has begun.
A sustained breakout above the cloud would represent a significant improvement in market structure and substantially strengthen the bullish case. If achieved, the next upside objectives remain:
92.90
95.24
105.09
Support remains well defined.
54.78 continues to represent the key structural support that preserves the long-term bullish thesis.
A sustained break below this level would invalidate the current recovery attempt and reopen downside risk.
The July 31 Henka-Bi timing window remains an important date to monitor. Whether silver can build enough momentum to reclaim nearby resistance—or instead stalls beneath it—may help determine the next significant directional move.
Silver has stabilized after successfully defending the 54.78 structural support and is now testing the first meaningful resistance near 63.16. While downside momentum has eased, the broader corrective structure remains intact as price continues to trade below the Ichimoku cloud. A decisive move above 63.16 would strengthen the recovery attempt, while a confirmed breakout through the 80.72 cloud would signal a much more meaningful shift in the long-term technical outlook and open the door toward the 92–95 resistance cluster.
📈 For full context, see my Silver 2026: Full Steam Ahead, which outlines the annual macro thesis, key Ichimoku levels, and trading framework behind this move.
💡 New to Ichimoku?
Grab my audio & eBook “At One Glance: Master the Ichimoku…” — it breaks down my charting method with real examples and setup logic.

👇 What’s behind the paywall:
✅ Full Ichimoku chartbook: BTC, SP500, Gold, Silver, Oil, GDX, SLVP, DXY
✅ Key support/resistance zones + Henka-Bi Time Cycle Windows
✅ Actionable trade plans and targets
✅ Weekly macro catalyst watch
Comments
Nothing yet. Say the first thing.
Sign in to join the conversation.