

📣 If this helped make sense of why markets are moving the way they are… share it.
One of the most important developments in global markets right now isn’t happening in stocks, gold or commodities.
It’s happening in the bond market.
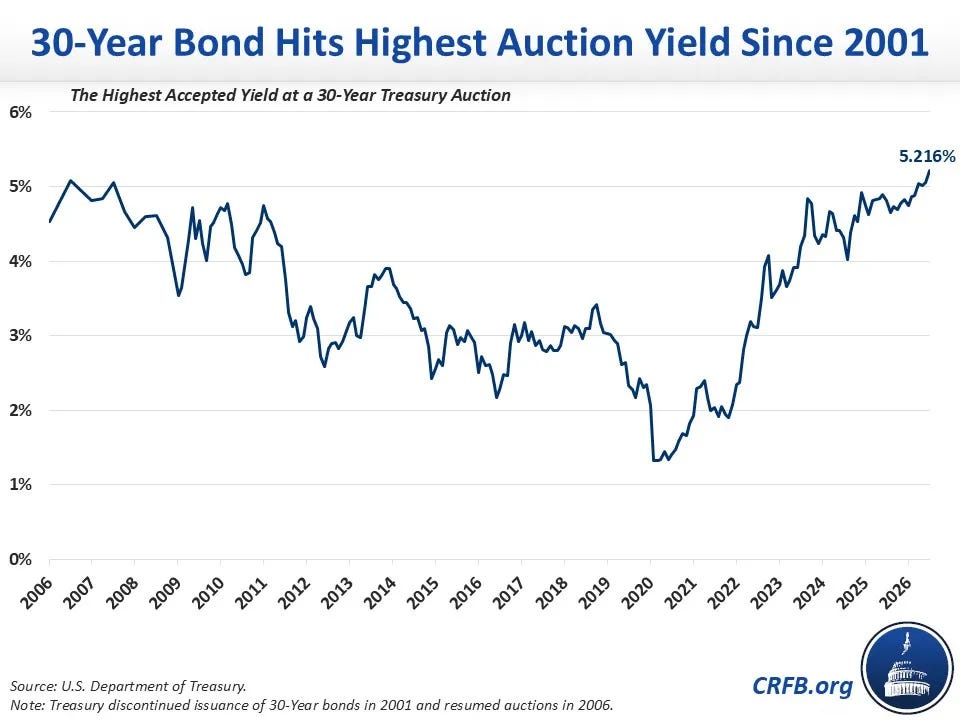
Last week, the U.S. Treasury’s 30-year auction cleared at 5.216%, the highest auction yield since 2001. The 10-year auction also cleared at 4.683%, its highest since 2007.
CHART: U.S. 30-Year Treasury Yield / Auction Yield
That doesn’t necessarily mean investors are refusing to buy Treasuries.
It means they’re demanding more compensation to lend the U.S. government money for longer periods of time.
And this isn’t exclusively an American phenomenon.
Long-term borrowing costs have been moving higher across much of the developed world as governments contend with persistent inflation, enormous fiscal spending requirements and increasingly large debt burdens.
This distinction is important.
Central banks can directly control short-term policy rates.
They cannot indefinitely dictate the price investors demand to finance governments for 10, 20 or 30 years.
If long-term yields continue climbing, financial conditions can tighten regardless of what the Federal Reserve does next.
Mortgage rates remain elevated. Corporate refinancing becomes more expensive. Equity valuations face pressure.
And, perhaps most importantly, the government’s own interest expense continues climbing as existing debt is refinanced at higher rates.
For precious metals, there are two sides to this story.
In the short term, rising real yields can create headwinds for gold.
But over the longer term, the fiscal conditions driving sovereign borrowing costs higher strengthen the monetary argument for owning it.
The longer governments are forced to refinance enormous debt loads at elevated interest rates, the greater the pressure eventually becomes for some combination of lower rates, higher inflation, financial repression or renewed balance-sheet expansion.
The bond market may therefore be telling us something much bigger than where the Federal Reserve moves rates next.
The cost of maintaining the existing debt structure is rising and becoming unsustainable.
While governments are paying more for capital, they’re simultaneously becoming more aggressive about securing physical resources.
South Korea has agreed to provide $1 billion in financing to Glencore in exchange for reliable access to copper supplies for Korean companies.
Think about what that means.
A sovereign-backed institution is effectively saying:
We provide the capital. You help guarantee access to the metal.
Copper has become increasingly strategic to artificial intelligence, data centers, electrical grids, electrification and manufacturing.
Instead of simply assuming sufficient copper will be available when needed, governments are beginning to secure future supply today.
And the physical copper market is simultaneously sending its own warning.
Copper for immediate delivery on the London Metal Exchange recently traded at a premium of as much as $478 per tonne over metal delivered three months later, the widest spread since the major copper squeeze of 2021.
That’s extreme backwardation.
In simple terms, buyers are saying:
“I’ll pay you substantially more if you can give me the copper today.”
That’s very different from speculators simply bidding up futures prices.
LME-tracked inventories have fallen to just above 200,000 tonnes, their lowest level since February, while earlier this year Trafigura was linked to major withdrawals of copper from LME warehouses.
CHART: LME Copper Inventories
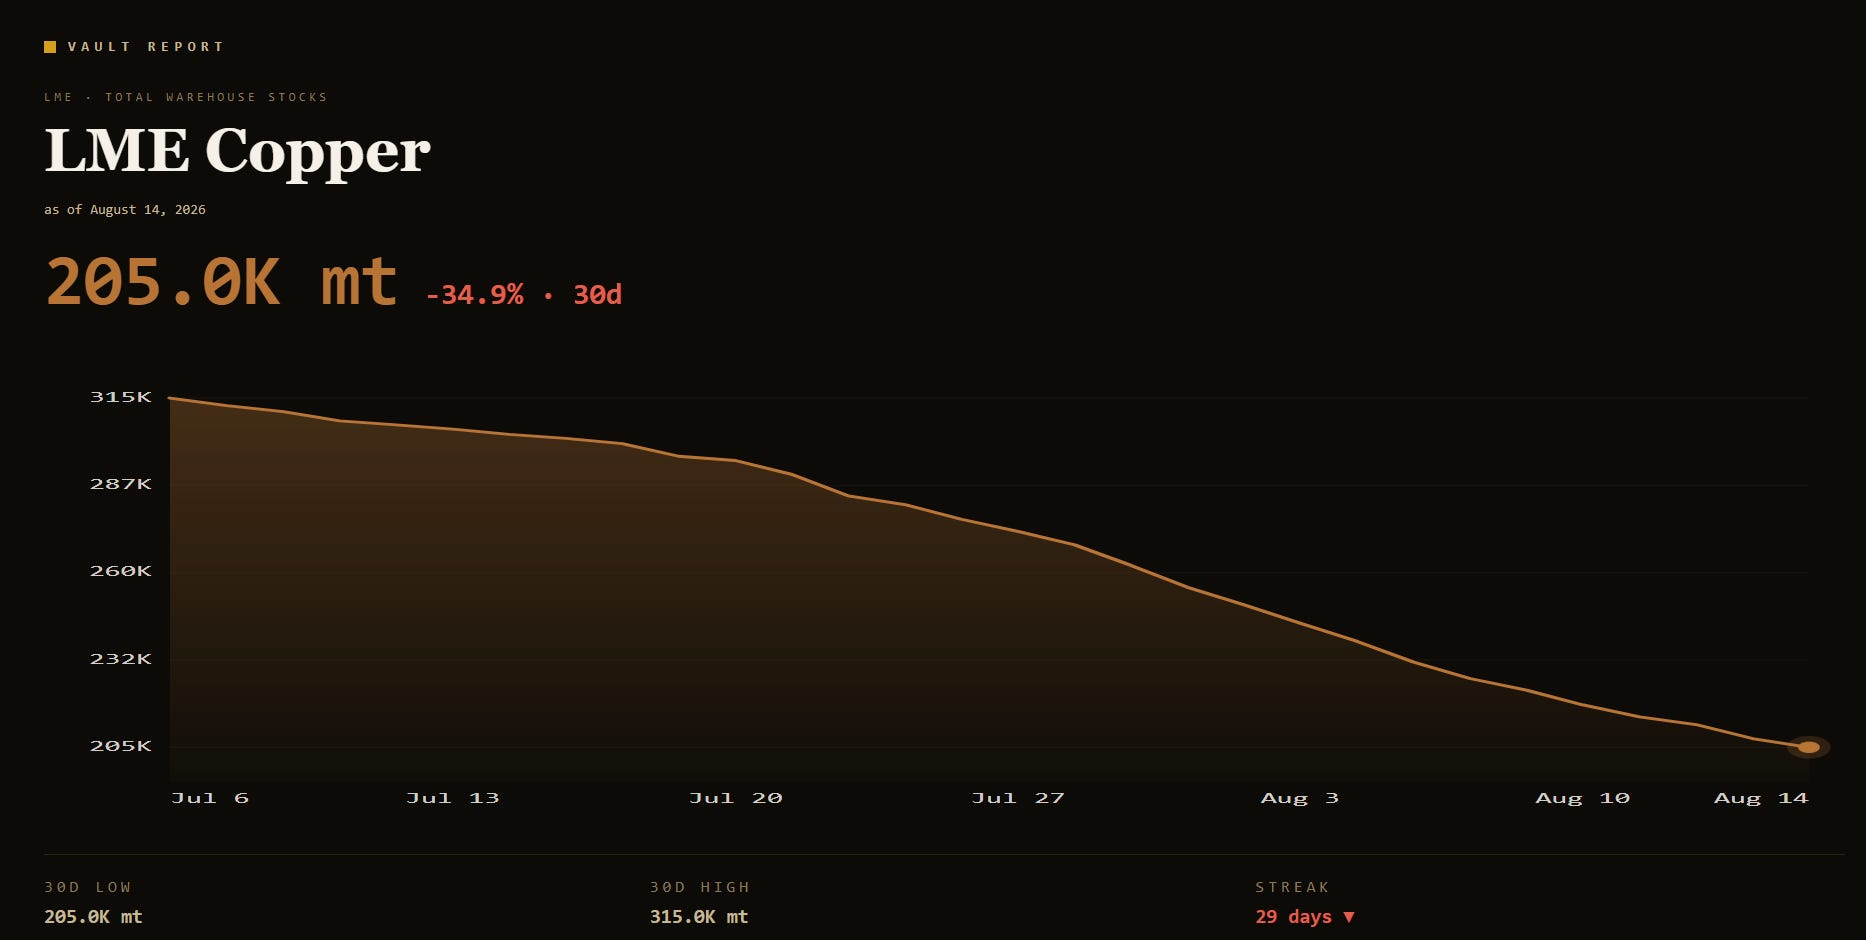
This doesn’t mean the world has literally run out of copper.
Some of today’s tightness reflects the geographical fragmentation of inventories, particularly after enormous quantities of metal moved toward the United States.
But that distinction may actually strengthen the broader argument.
A commodity doesn’t need to disappear globally to become scarce locally.
Once governments, manufacturers and commodity traders begin competing to secure inventories in specific jurisdictions, the amount of copper theoretically sitting somewhere in the world matters much less than the amount actually available for purchase and delivery where it’s needed.
And we’re beginning to see the progression.
First, buyers compete on price.
Then they compete on contracts.
Then governments begin financing supply.
Eventually, they compete simply for access.
South Korea’s agreement with Glencore is the strategic response.
The LME backwardation is the market signal.
Together, they’re telling us the same thing:
Access to physical copper itself is becoming more valuable.
Copper isn’t the only metal showing signs of increasingly aggressive competition for physical supply.
For months, I’ve continued to highlight the growing disconnect between Western silver benchmark prices and what physical buyers are actually willing to pay elsewhere in the world.
India provides a perfect example.
New import restrictions severely disrupted silver flows into the country earlier this year, contributing to physical premiums that reached roughly $6.50 per ounce in July, more than 10% above international benchmark prices.
Those premiums created an obvious incentive:
Find cheaper silver elsewhere and move it to India.
And that’s exactly what we’re beginning to see.
After six months without imports through the India International Bullion Exchange, approximately 89.81 tonnes of silver have already entered through the exchange in August, while roughly 400 tonnes of import licenses have reportedly been approved.
Yet India’s 30-day average physical premium recently remained around $4 per ounce.
That’s the important part.
When one market consistently pays significantly more for physical silver than another, traders have an incentive to purchase against the cheaper benchmark, source the physical metal and deliver it into the higher-priced market.
In other words:
The metal moves toward the highest bidder.
The question then becomes where all of that metal ultimately comes from.
It could come from refiners, producers, existing commercial inventories or stocks located in other trading hubs. We shouldn’t assume every ounce flowing into India is coming directly out of London.
But the underlying mechanism remains the same.
Persistent physical premiums create a financial incentive to reallocate the world’s available silver inventories.
Eventually, one of two things has to happen.
Physical demand weakens enough to eliminate the premium...
or international silver prices rise enough to close the arbitrage.
That’s why I’ve continued to pay so much attention to physical premiums.
They aren’t simply interesting discrepancies on a screen.
They create a direct financial incentive to move physical metal around the world.
And traders can continue exploiting those differences only for as long as sufficient deliverable metal remains available at the lower price.
The paper market may determine the reference price.
Physical flows reveal where the metal is actually valued.
(Opening Price as of August 17th, 2026)
S&P 500: 7,785
Gold: $4,394/oz
Silver: $65.77/oz
GDX: $91.25
SLVP: $37.05
Crude Oil (WTI): $81.83/bbl
DXY: 99.16
Bitcoin: $63,462
The week begins with fresh economic data from China, including Industrial Production and Retail Sales, providing another look at the health of the world’s second-largest economy.
Canada also releases its latest CPI inflation data, which could influence expectations for the Bank of Canada’s next policy move.
For commodity markets, China’s data will be particularly important given the country’s enormous influence on global demand for industrial metals.
Tuesday shifts attention to the UK with the release of Claimant Count Change, Employment Change and the ILO Unemployment Rate.
The data will provide an updated look at the British labor market ahead of Wednesday’s inflation numbers, helping markets assess how much pressure remains on the Bank of England.
Wednesday is the most important day of the week.
The UK releases CPI and Core CPI, providing another major test of whether inflation pressures are continuing to ease.
Later in the day, attention shifts firmly to the United States with the release of the FOMC Minutes at 2:00 PM ET.
Markets will scrutinize the minutes for clues about the Fed’s assessment of inflation, economic growth and the path of interest rates.
Any indication that officials are becoming more concerned about persistent inflation could push Treasury yields and the dollar higher. A more dovish tone could strengthen expectations for easier monetary policy.
For Treasuries, the U.S. dollar, equities, gold and silver, this is likely the week’s biggest scheduled catalyst.
Australia releases its latest Employment Change and Unemployment Rate on Thursday.
The report will provide another indication of the strength of the Australian economy and could influence expectations surrounding the Reserve Bank of Australia’s next move.
Given Australia’s importance to global commodity markets, the data is also worth watching for broader signals on the Asia-Pacific economy.
Friday brings the week’s broadest snapshot of global economic activity.
Fresh manufacturing and services PMI readings arrive from Europe, the UK and the United States, giving investors an early indication of how economic momentum is developing in August.
The UK also releases Retail Sales, providing another look at consumer demand following Tuesday’s labor data and Wednesday’s inflation report.
PMIs will be particularly important for determining whether global growth is accelerating or slowing as borrowing costs remain elevated.
The FOMC Minutes are the main event this week.
Wednesday’s release could reshape expectations for the Fed’s next move, particularly after the recent rise in long-term Treasury yields.
But Friday may be equally important for the broader macro picture.
With Flash PMIs across Europe, the UK and the United States, investors will get a synchronized look at global growth momentum.
For markets, the key question this week is straightforward:
Can economic growth remain resilient while borrowing costs continue to rise?

Trend: Recovery Attempt / Cloud Resistance Test
Major Resistance: 121.65
Immediate Resistance: 66.79 → 67.29
Current Pivot: 65.48
Major Structural Support: 54.78
Current Price: 65.48
Timing Watch: August 24 Henka-Bi
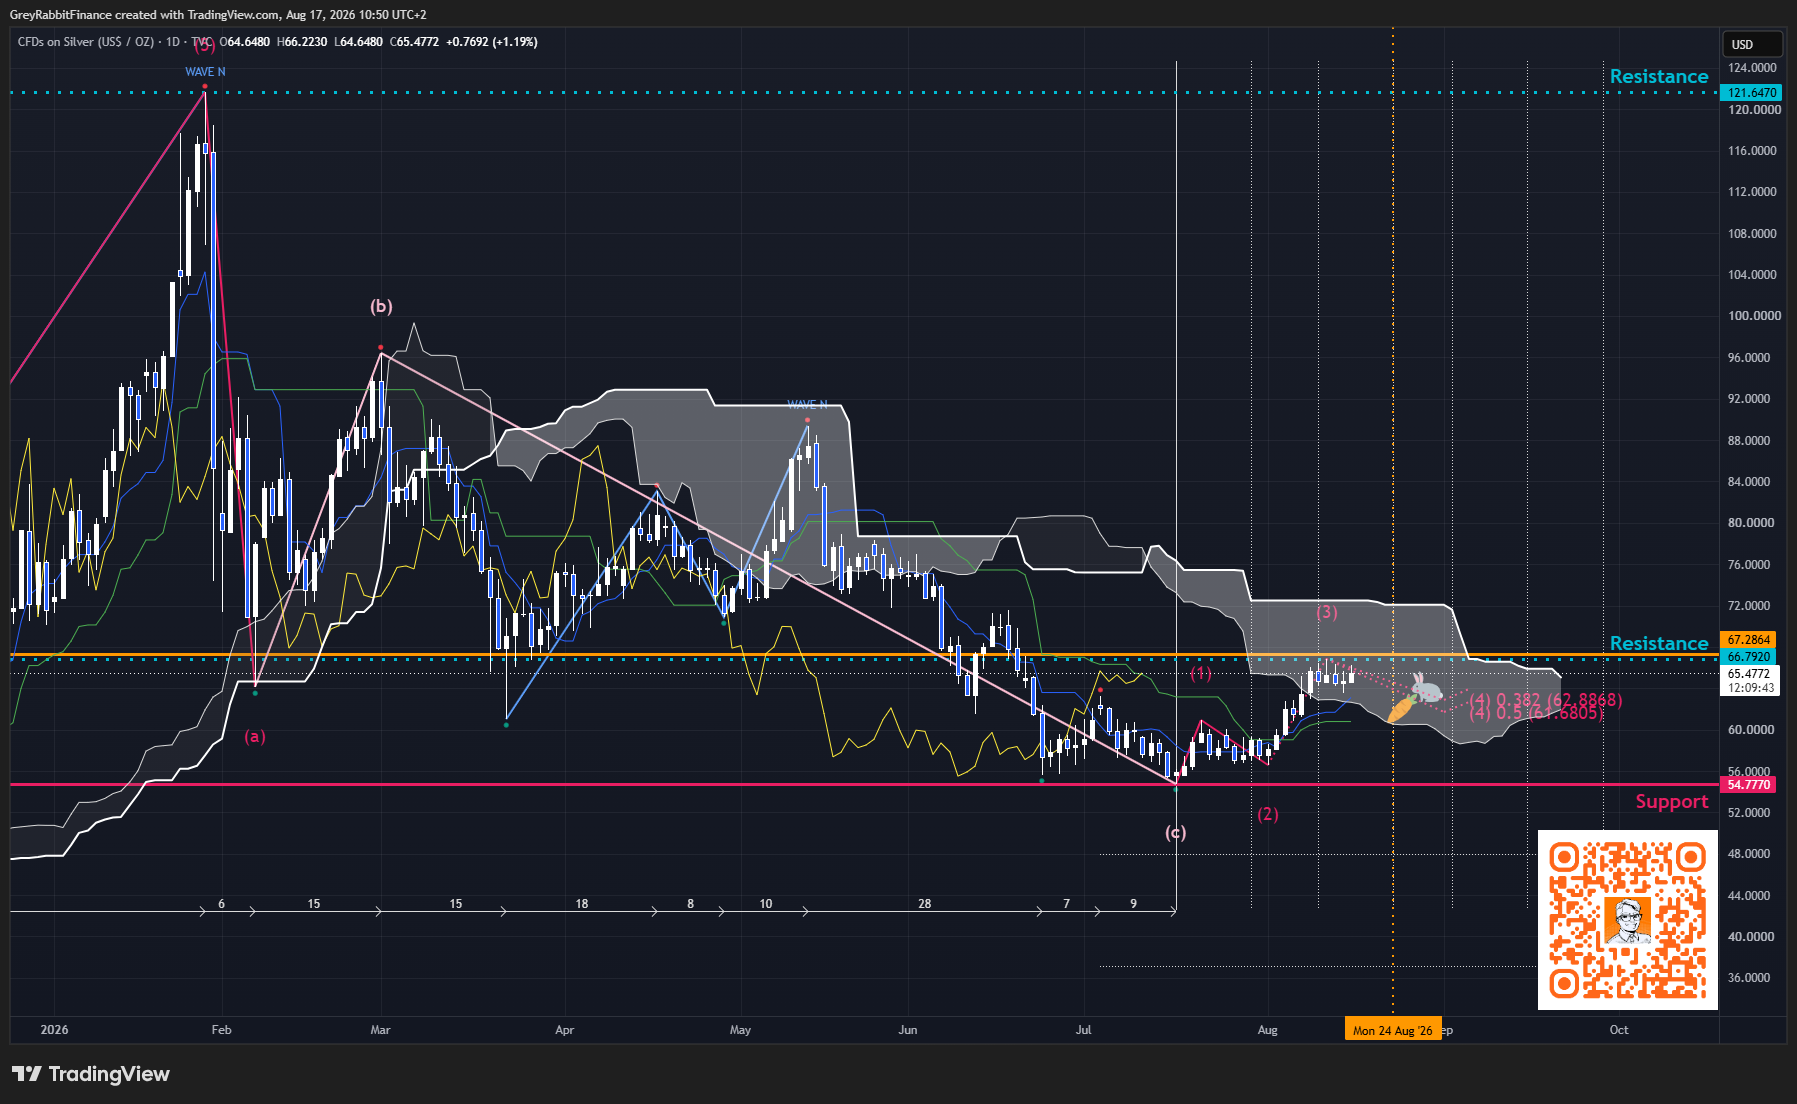
Silver continued to strengthen this week, extending its recovery from the 54.78 structural support and pushing deeper into the Ichimoku cloud.
The most important development is that price has now reached the 66.79 to 67.29 resistance zone. This represents the immediate technical barrier and places silver at an important decision point.
A decisive breakout above 67.29 would be a meaningful technical improvement. It would push price through nearby resistance and strengthen the case that the correction from the February peak is transitioning into a renewed bullish phase.
For now, however, silver remains inside the cloud.
That means the recovery is constructive, but full bullish confirmation has not yet arrived.
The Ichimoku structure continues to improve. Price is trading above the rising Tenkan and Kijun lines, while the forward cloud continues to narrow. This reduces some of the overhead resistance that has constrained silver throughout the correction.
The projected wave structure also suggests the current advance may still have room to develop, although the 66.79 to 67.29 area must be cleared first.
If silver is rejected here, the short-term moving averages and lower portion of the cloud become the first areas to watch for support. Below that, 54.78 remains the major structural level protecting the broader recovery thesis.
Timing is also becoming increasingly important.
The chart’s next major Henka-Bi arrives around August 24, just as silver approaches this resistance zone. That creates another potential inflection window as the market decides whether to break through the cloud or consolidate the recent advance.
Silver’s technical picture continues to improve after successfully defending 54.78 and extending its recovery into the Ichimoku cloud.
The immediate battle has shifted higher to 66.79 to 67.29.
A sustained breakout above this zone would provide the strongest technical evidence yet that silver’s broader correction is ending and could clear the way for another leg higher.
Until then, the recovery remains constructive but not fully confirmed.
For now, 66.79 to 67.29 is the key resistance zone, 54.78 remains major structural support, and August 24 is the next important timing window.
💡 New to Ichimoku?
Grab my audio & eBook “At One Glance: Master the Ichimoku…” — it breaks down my charting method with real examples and setup logic.

👇 What’s behind the paywall:
✅ Full Ichimoku chartbook: BTC, SP500, Gold, Silver, Oil, GDX, SLVP, DXY
✅ Key support/resistance zones + Henka-Bi Time Cycle Windows
✅ Actionable trade plans and targets
✅ Weekly macro catalyst watch
Comments
Nothing yet. Say the first thing.
Sign in to join the conversation.