
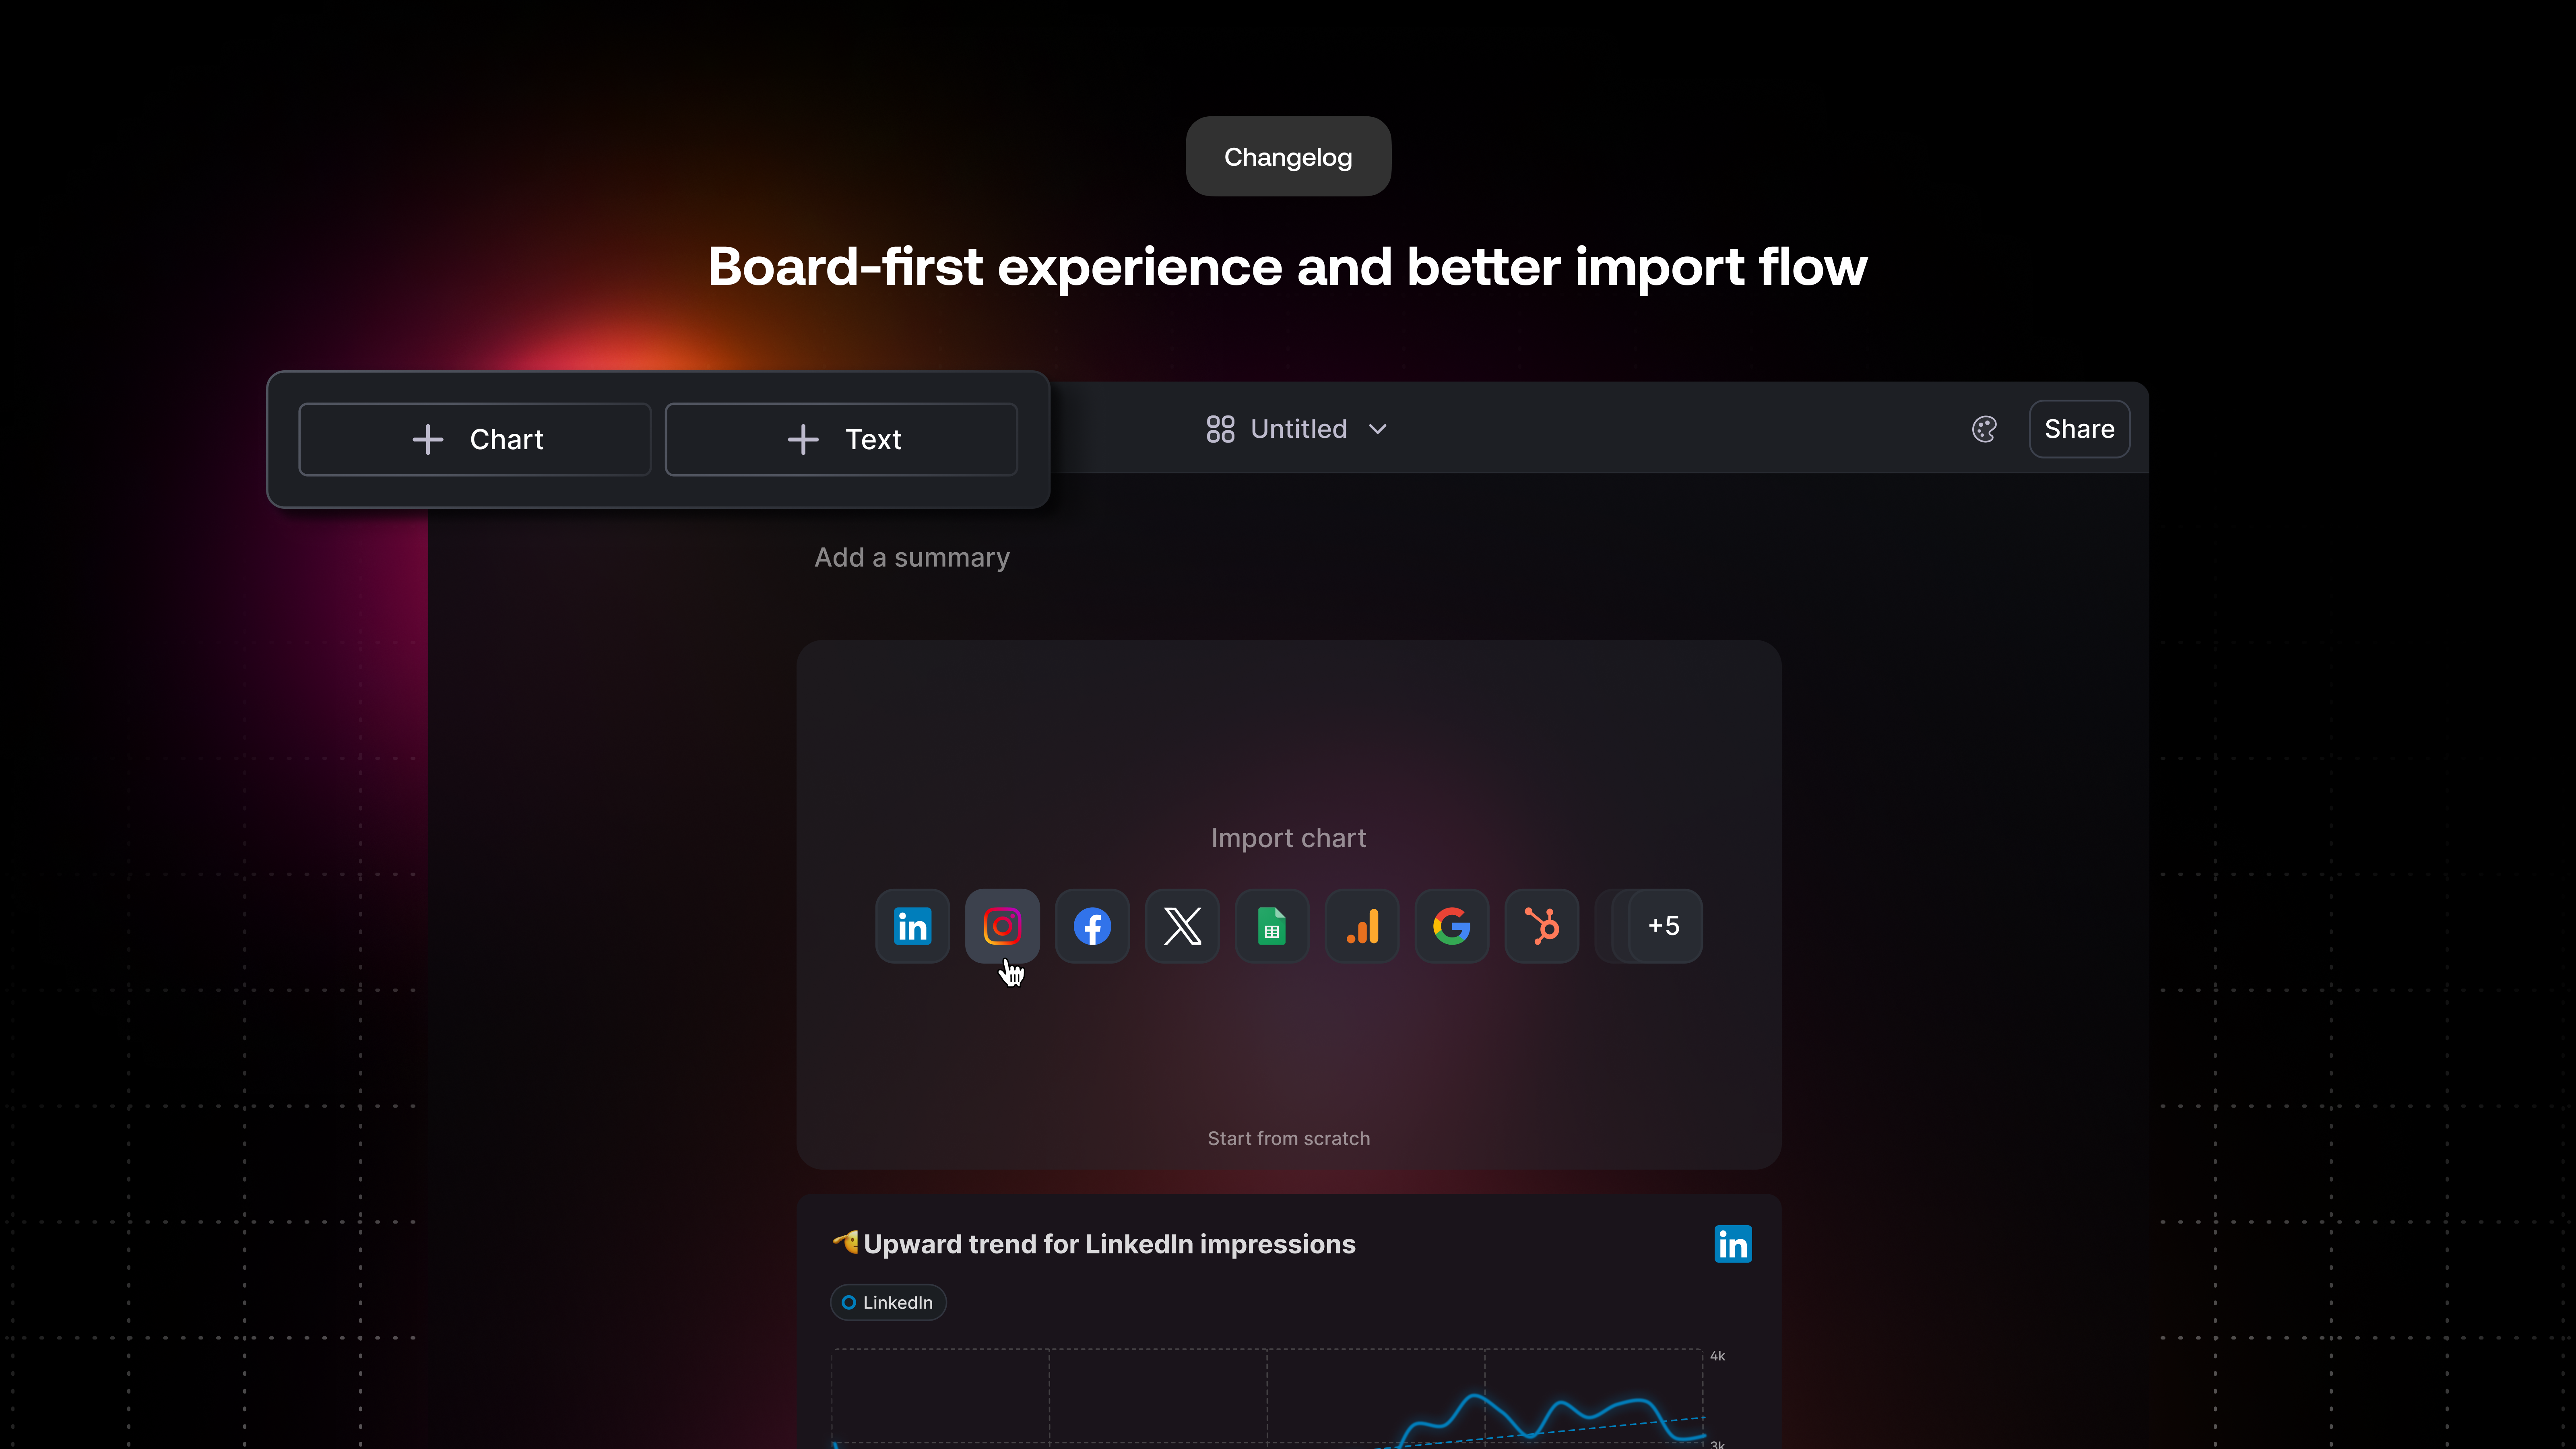
This is a bit of a special changelog for us 🙌
Over the past few weeks, we have been heads down turning Graphy from a simple charting tool to a fully-fledged data-reporting product.
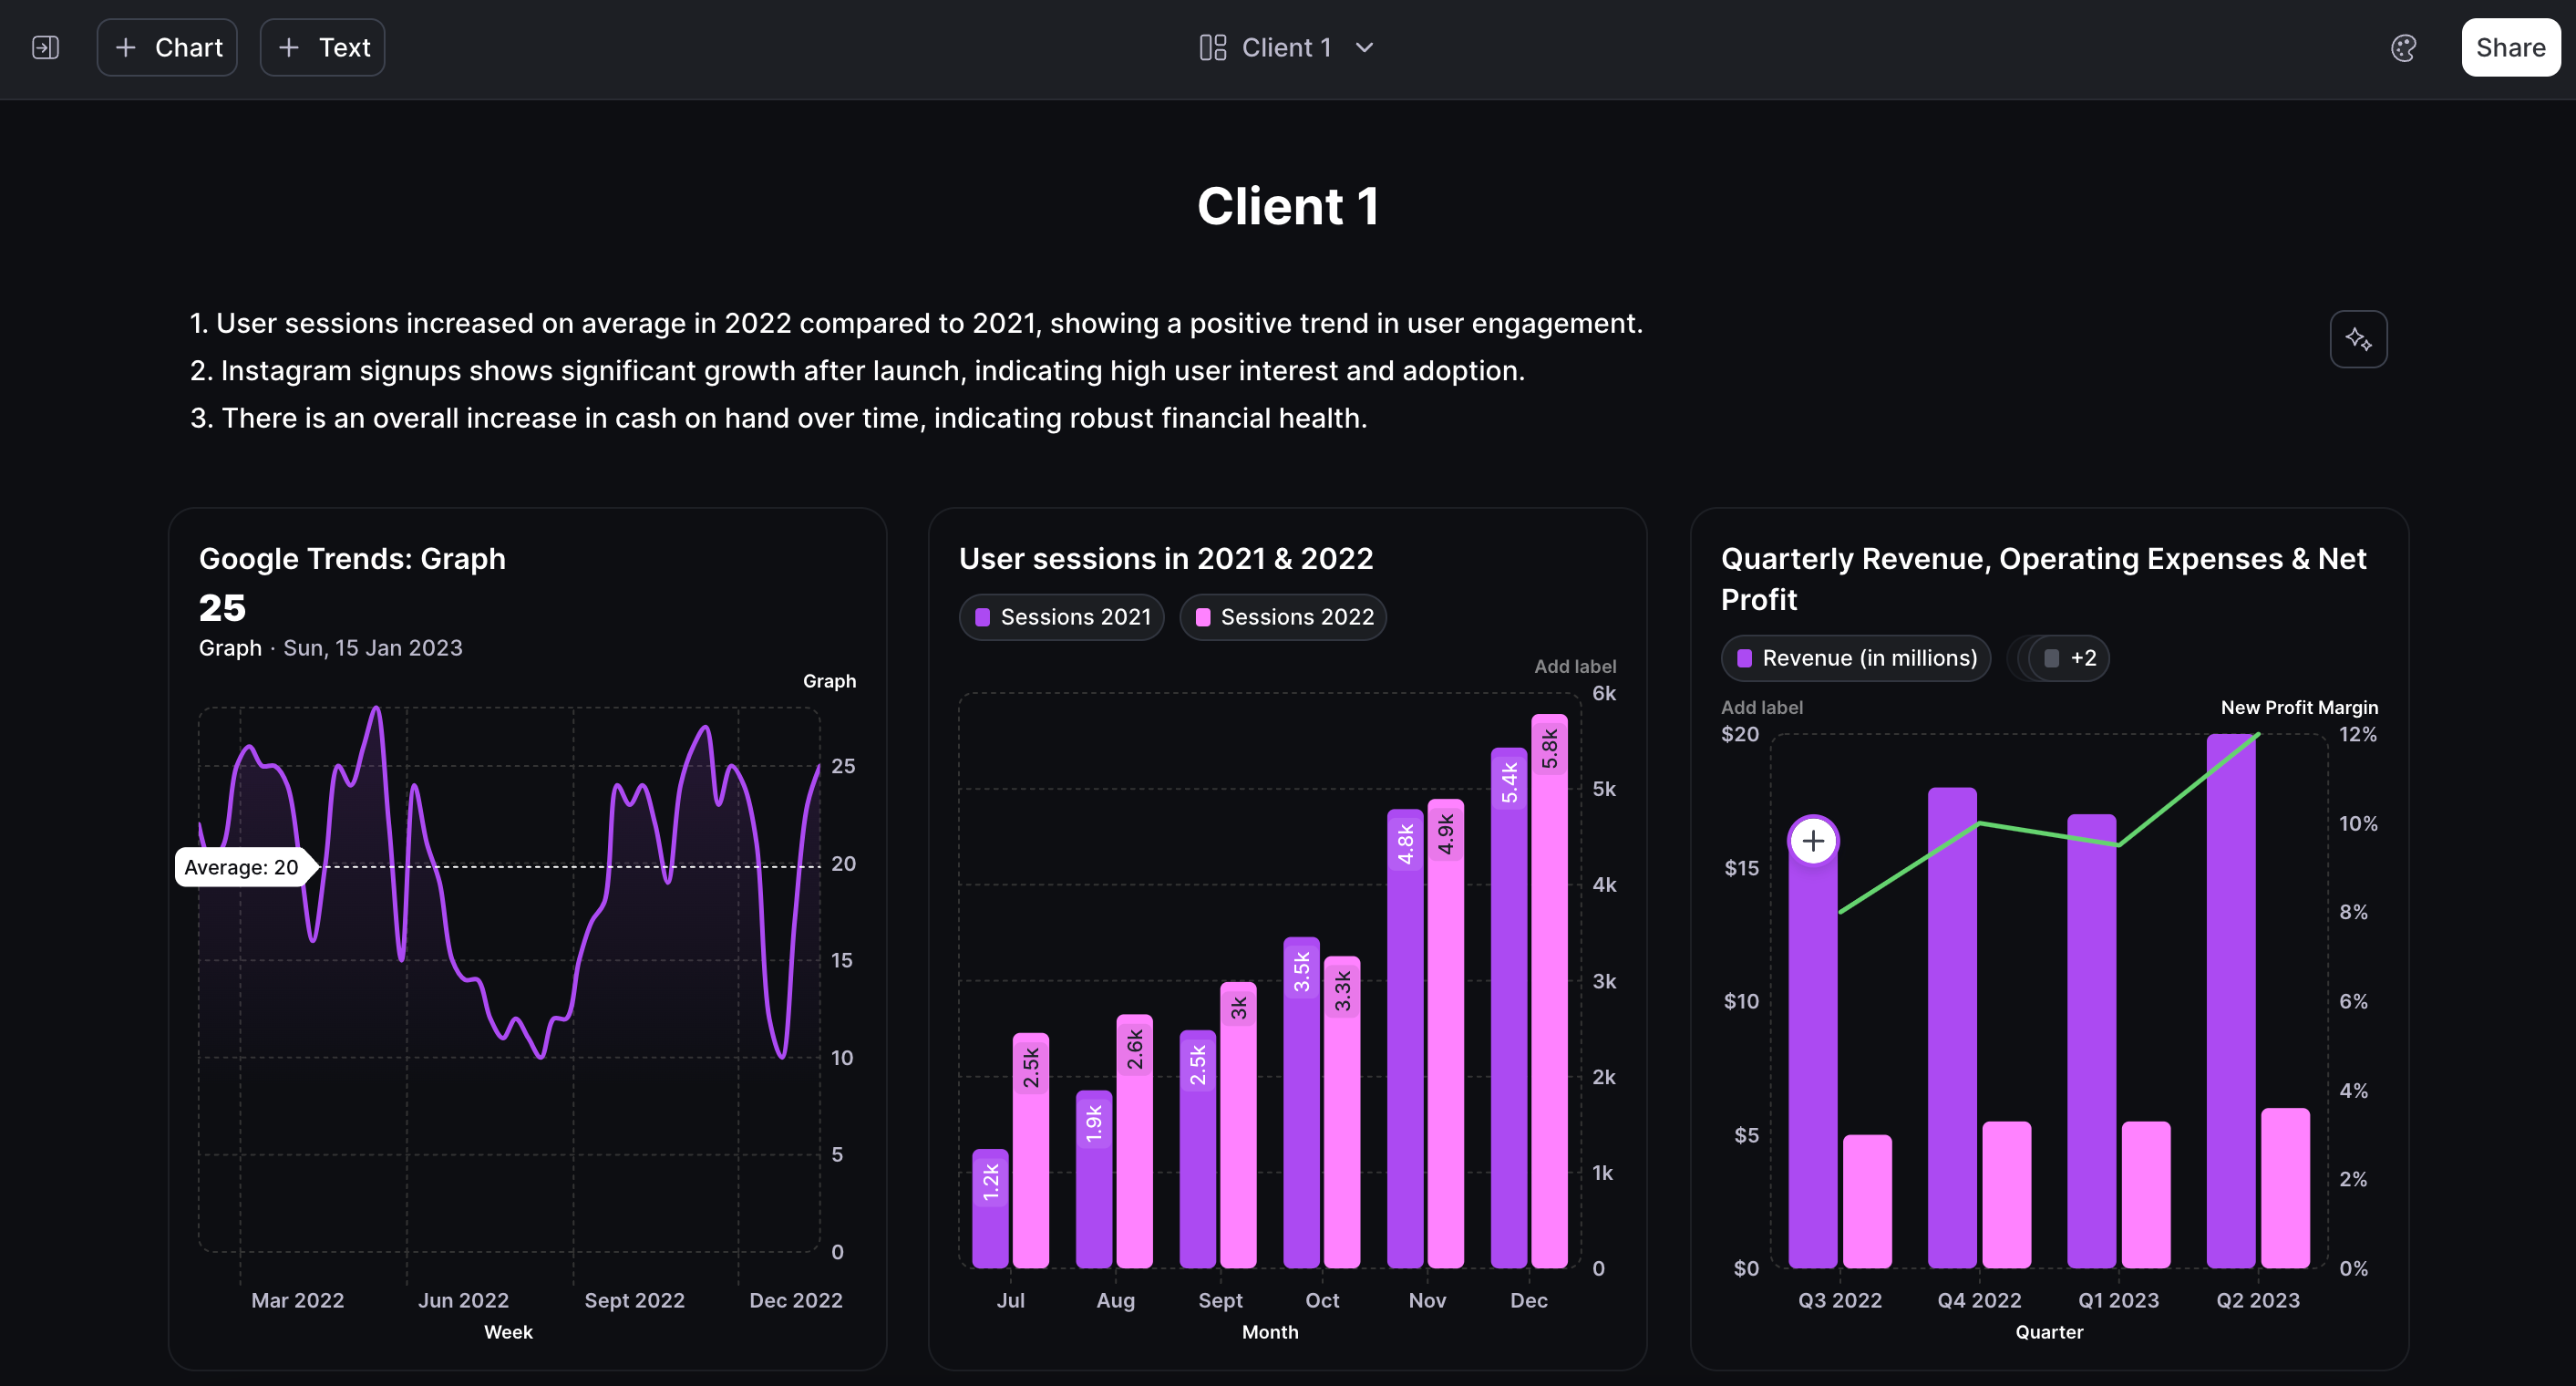
Effective communication with data involves more than just standalone charts; the real magic unfolds when these charts are combined with explanatory text. This synergy brings clarity and depth to the information presented. Enter Graphy boards 📋🎊
There is still a space for those standalone charts you want to email or share on social media. The ‘unsorted charts’ section, at the top of the left sidebar, is your perfect place for this
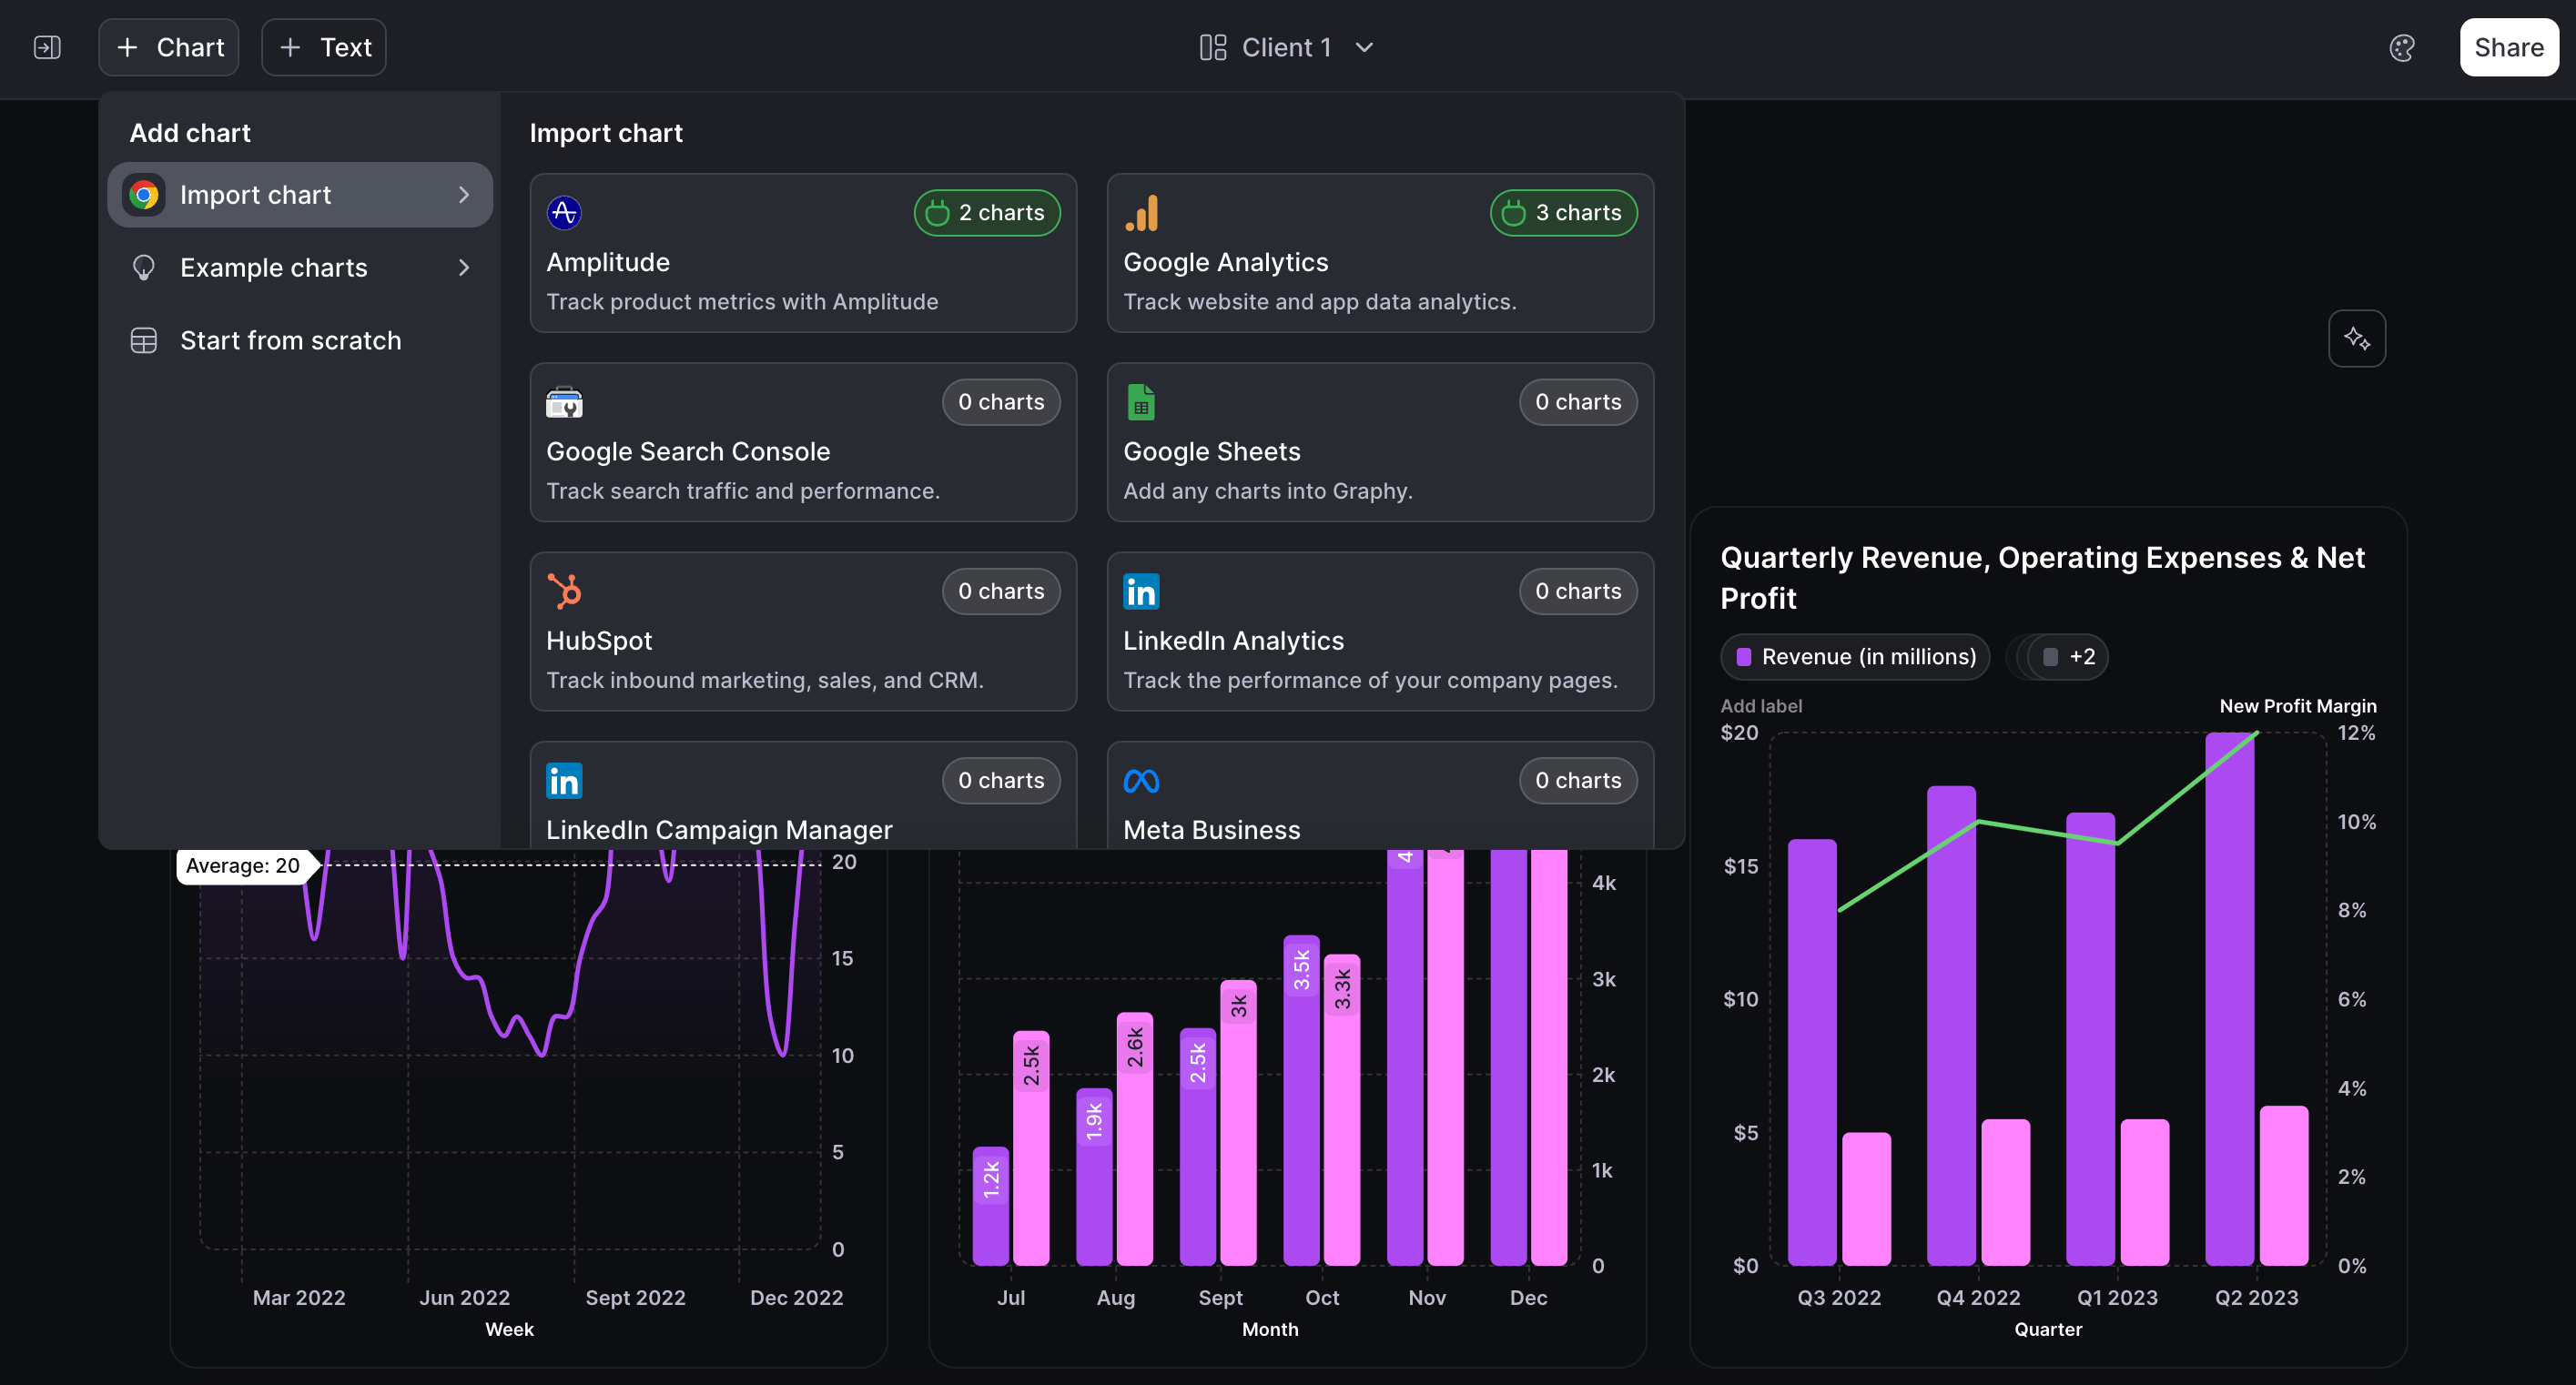
We got feedback that the experience for inserting blocks (charts & text) didn’t feel quite right, so we went back to the drawing board & made some much-needed tweaks.
You can now head over to the top left of the board to find the best ways to add charts to your board. Better yet, click on the source icons in the middle of your new board to get started with our Chrome extension.
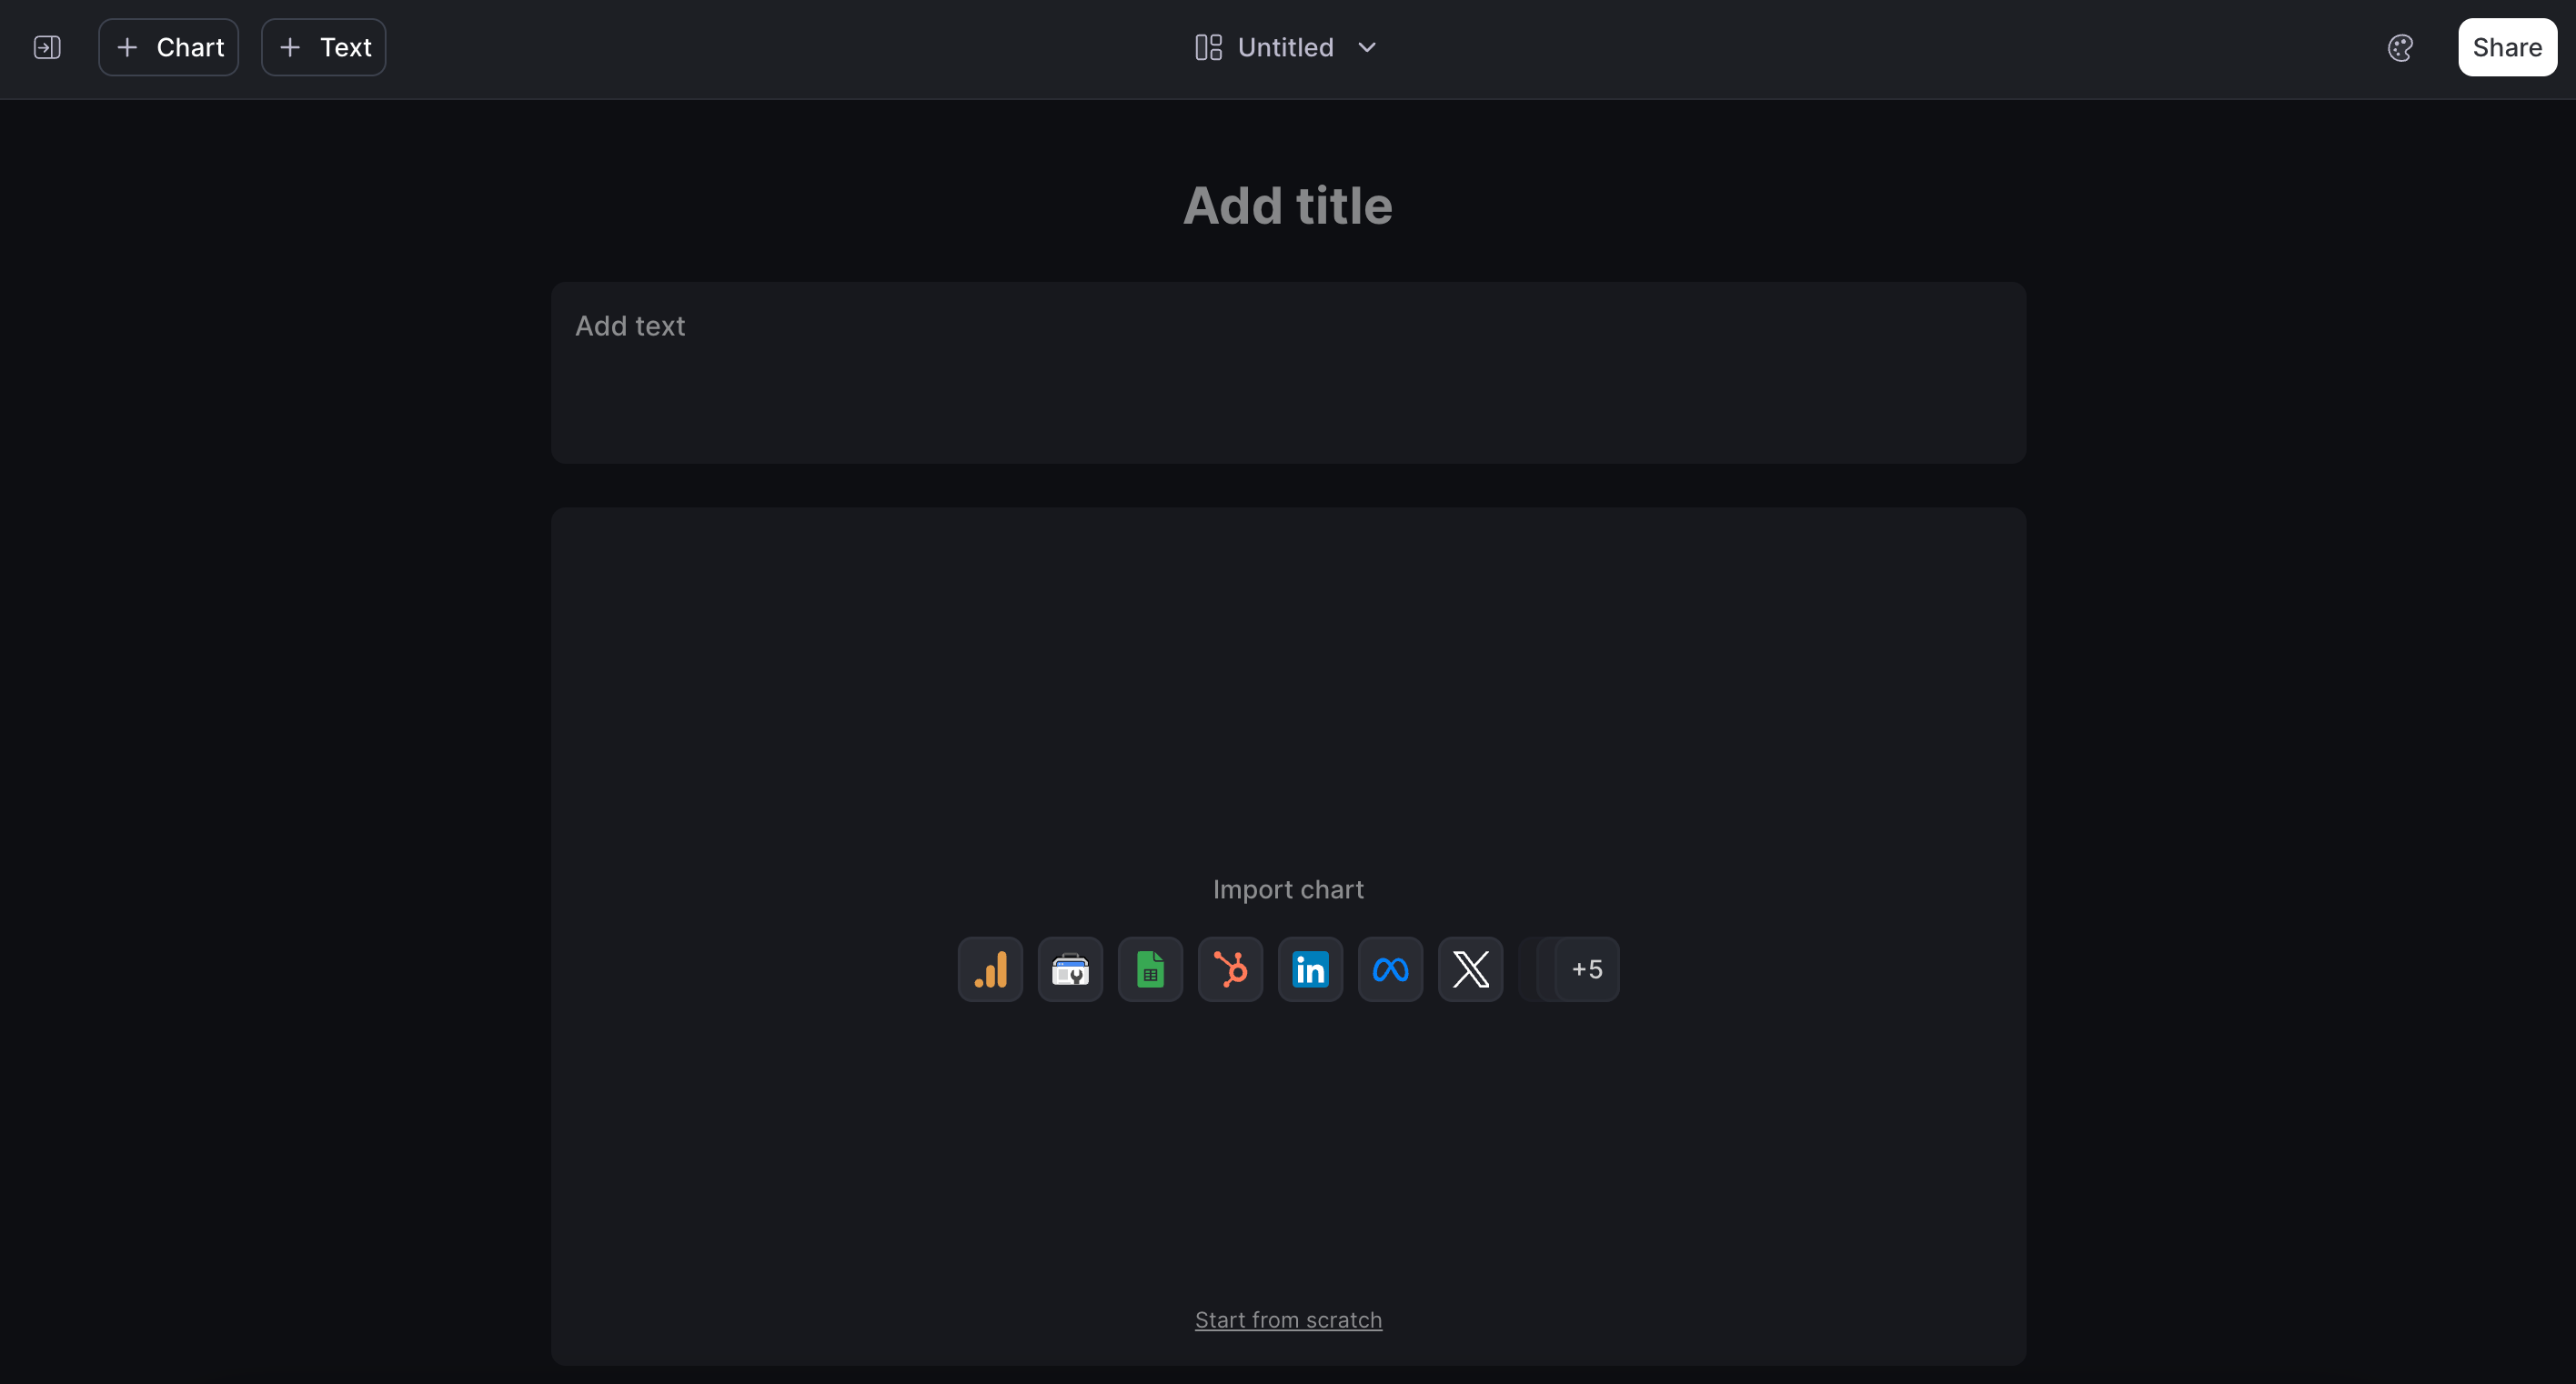
When starting with a new board, it should feel like you know exactly what to do next. We have removed unnecessary buttons & popups, & focused on what’s most important; crafting your board.
No posts
Comments
Nothing yet. Say the first thing.
Sign in to join the conversation.