
Note: These are my personal views only and do not constitute investment advice. See full disclaimer below.
Audio embedded below.
0:00
-26:17
The World Cup is on again. Two weeks ago that prompted a piece about the 2002 tournament (Capital punishment, 24 years on); it turns out 2006 has a story too.

That summer I was in European insurance research at JPMorgan, and the convention on the sell side was long notes; 40 to 50 pages was the norm. The problem, which I had slowly come to accept, was that clients were not reading them. So in May 2006 I did the opposite. I compressed everything I thought about the UK life sector onto a single laminated page: themes down the rows, stocks across the columns, green where the news was good, yellow where it was not. On the reverse I printed the World Cup match schedule. In the email to clients I told them to keep it on their desk, that they could eat their breakfast off it, and that was only half a joke; markets were on the way back up, everyone worked hard, and plenty of us ate three meals a day at our desks.
JPMorgan had just installed software that told us how many recipients actually opened an attachment, cutting-edge then, commonplace now. The average across the whole equity research department was 4%. The reckoner was opened by 52%, a record at the time, and it won me JPMorgan’s equities product of the month. The prize was a certificate and a bottle of champagne.
I still have the page, and the photographs below are of the original. The source line reads “Prices as at COB 22 May 2006”, 18 days before the tournament kicked off in Munich. Rather than write yet another note on where the sector sits today, I want to do something more useful: quote what I actually wrote, cell by cell, and ask how each line reads 20 years on. My words from May 2006 appear in quotation blocks; everything else is my view now. At the end of each section I have marked the line the way the page itself would have: green where things are better today, yellow where they are not, and no colour where the question has stopped mattering.
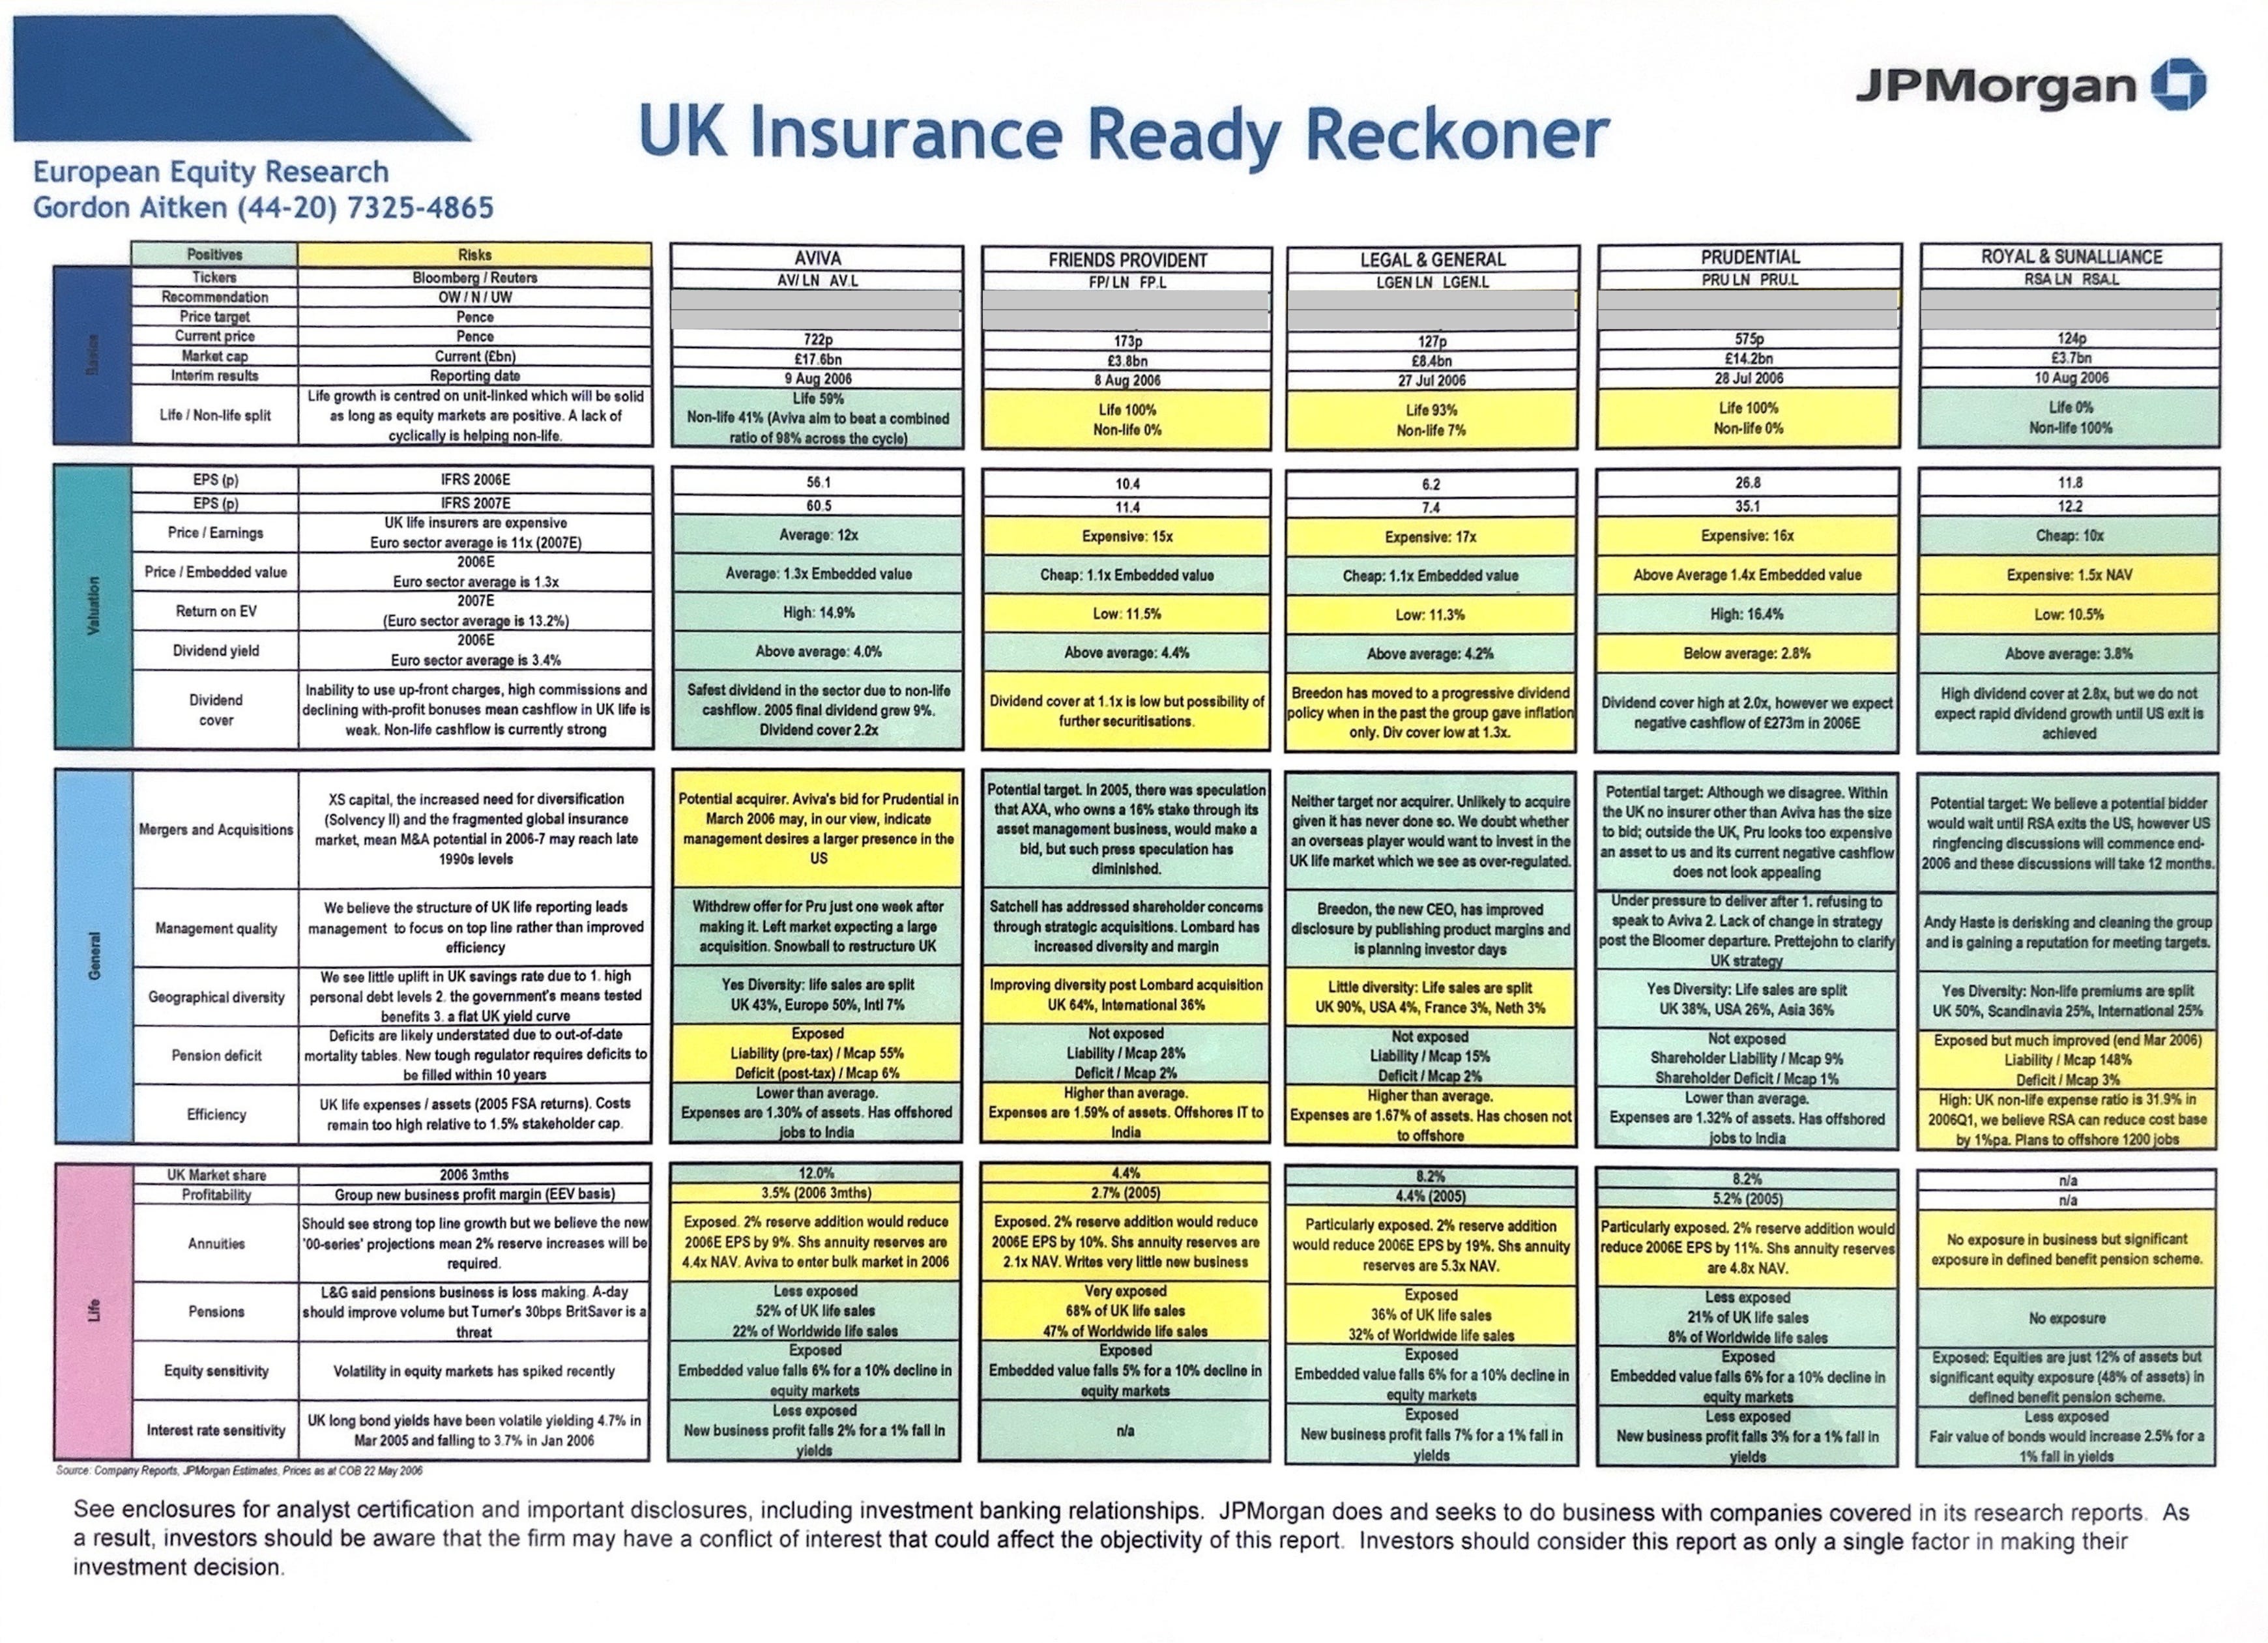
The back of the one-pager.
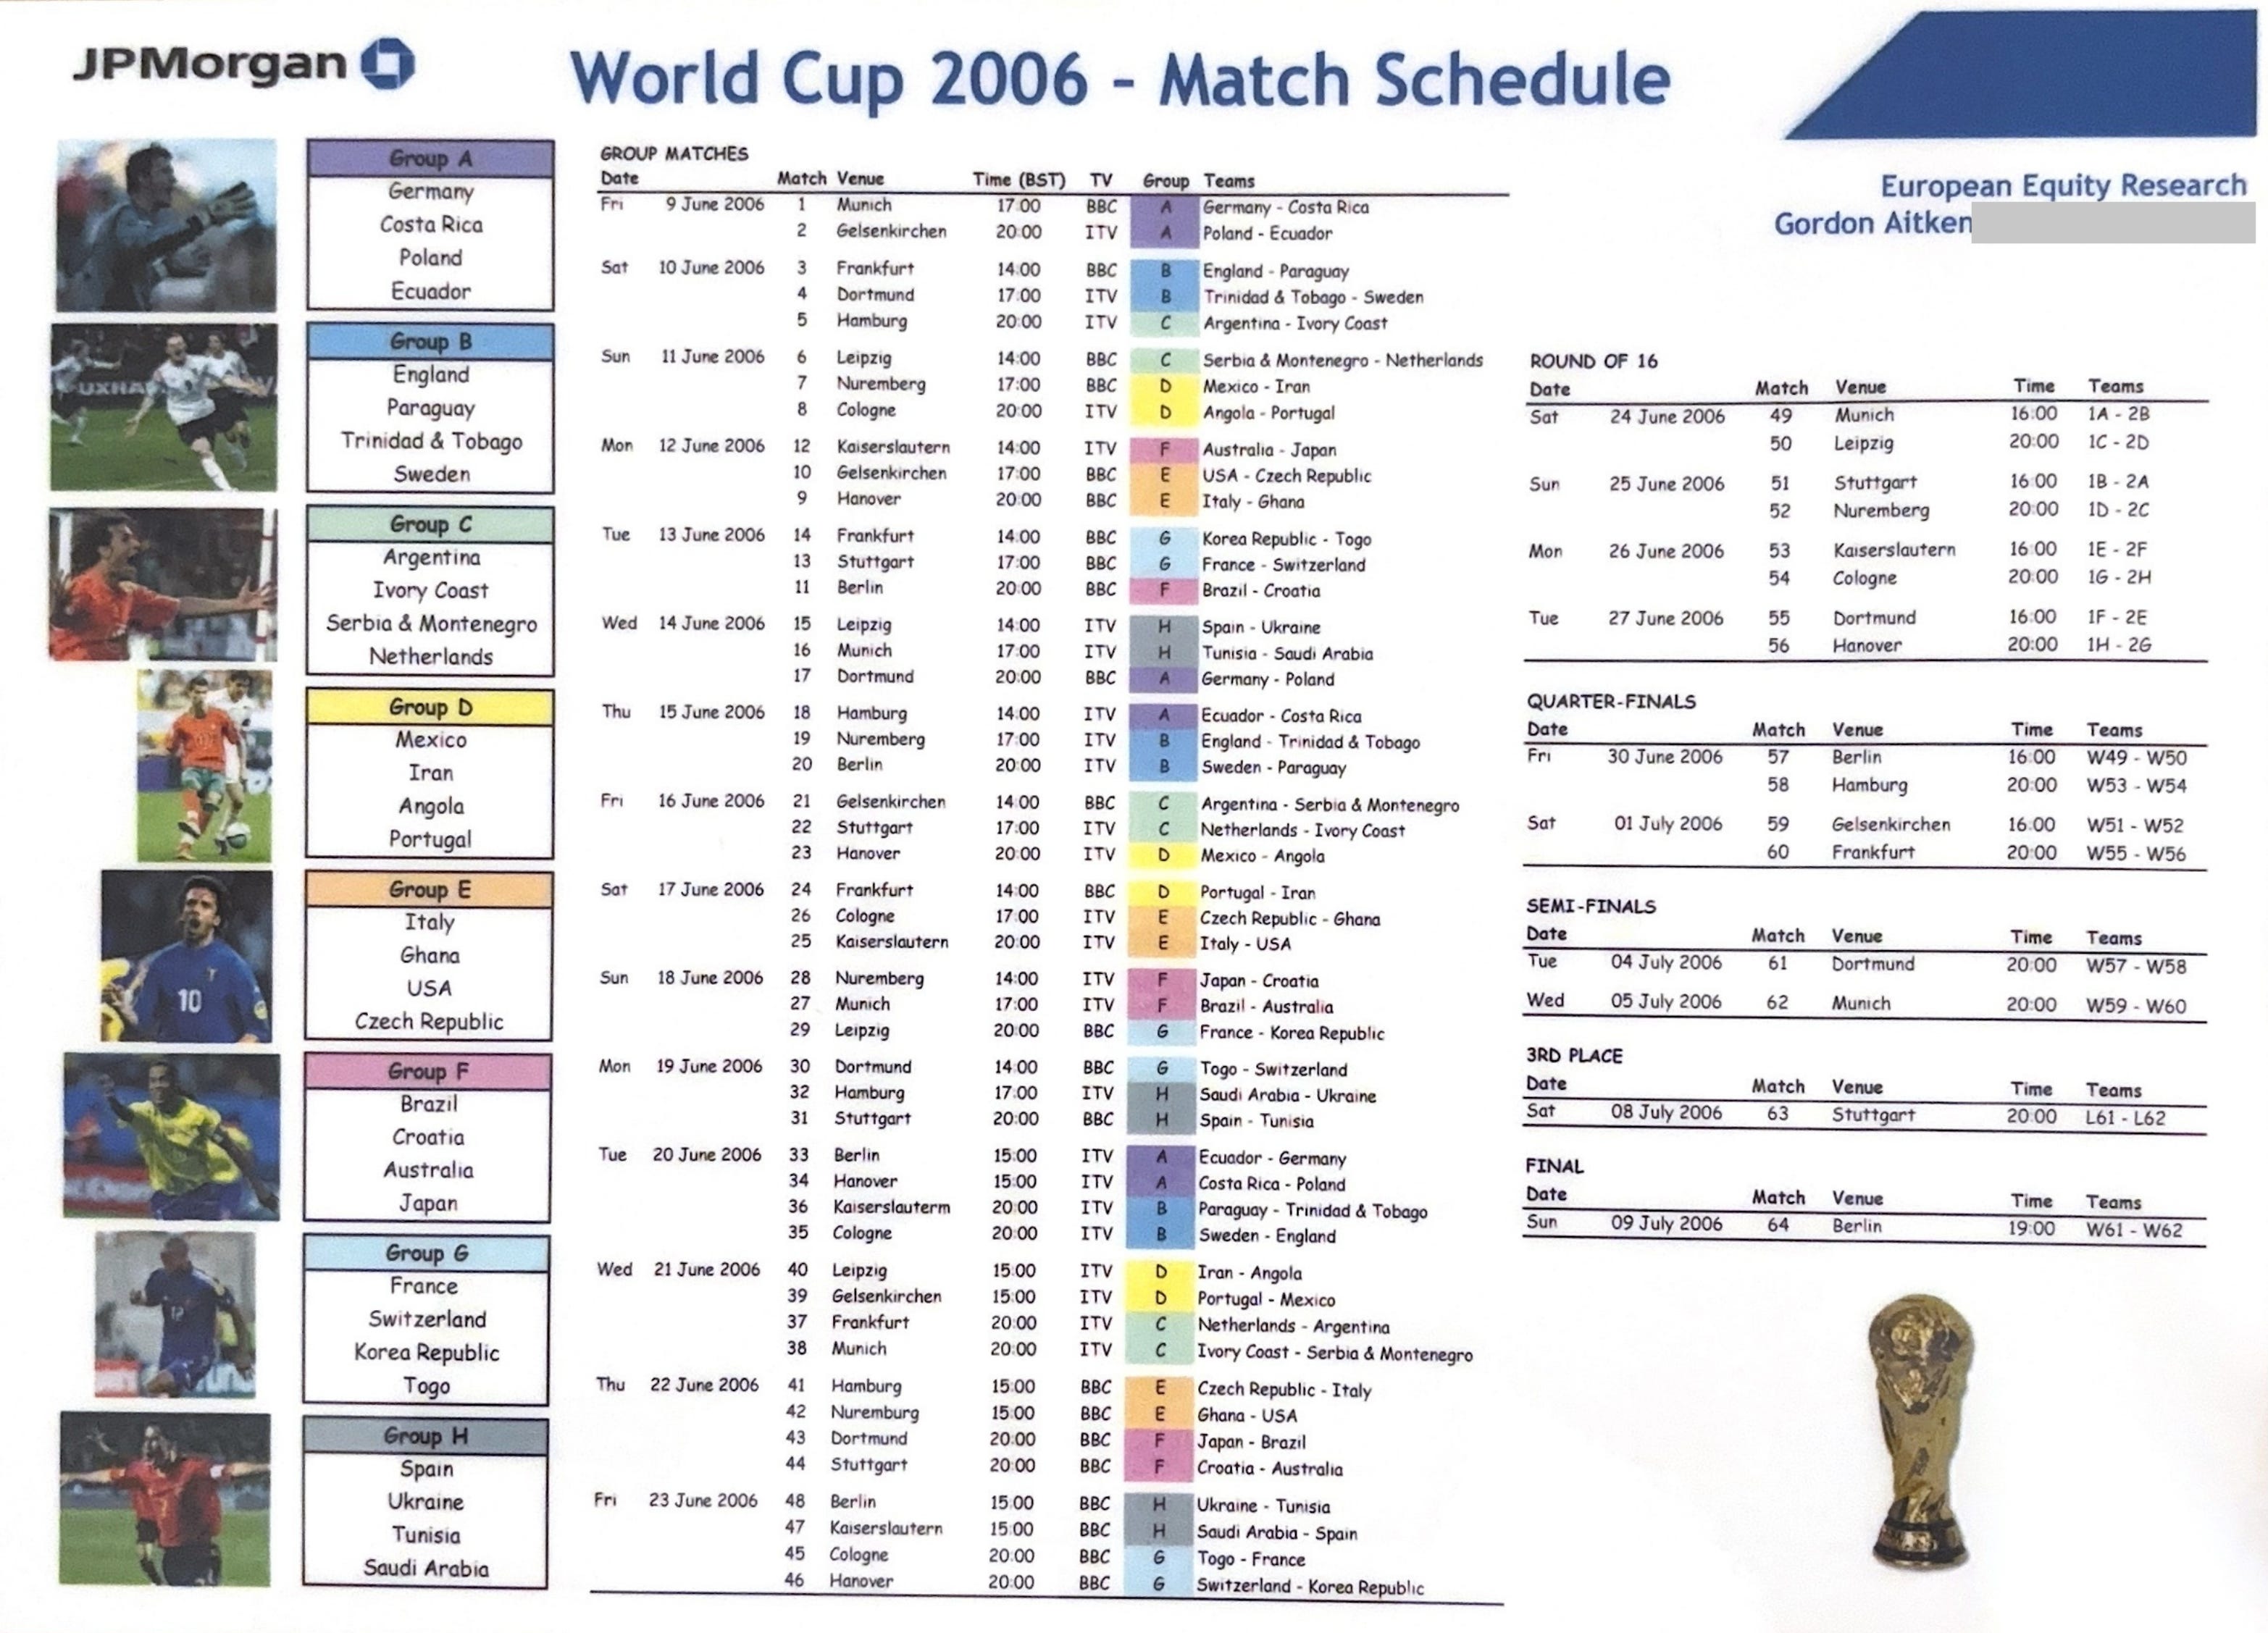
2006: “Life growth is centred on unit-linked which will be solid as long as equity markets are positive.”
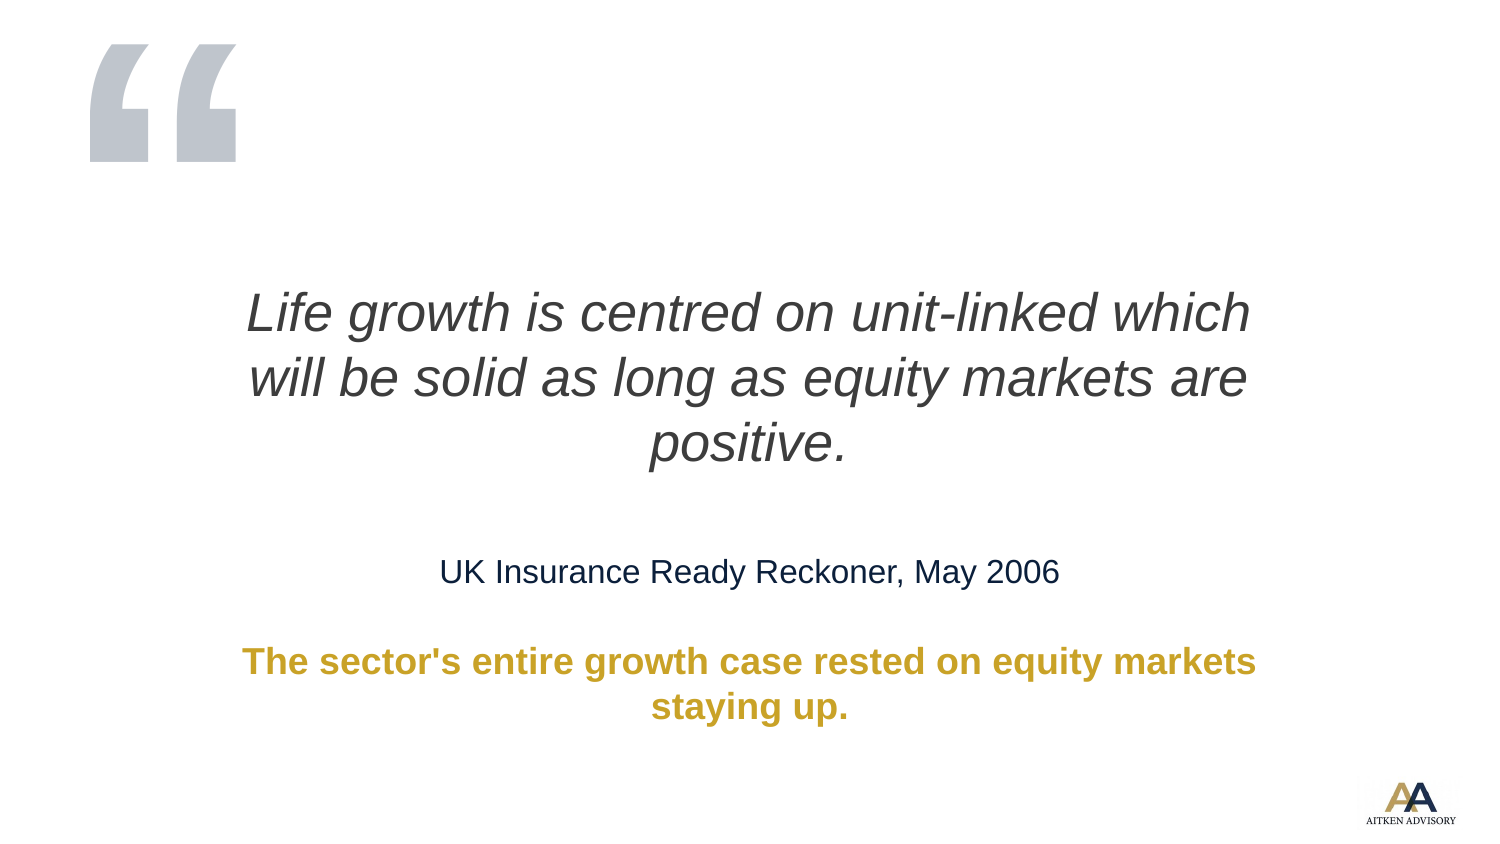
The 2000-03 bear market had finished off with-profits, the smoothed savings product that had dominated British long-term saving, so unit-linked policies (savings products where the customer bears the market risk) were the only growth game left. The bulk annuity market, deals in which a company pension scheme pays an insurer to take over its promises to pensioners, barely existed: roughly £2bn a year, written entirely by Legal & General and Prudential, because nobody else was in it. The sector’s entire growth case rested on equity markets staying up, and I set that down as though it were a reasonable foundation for an industry. Today the growth comes from defined-benefit (DB) pension schemes, the ones that promise a set pension for life, transferring decades of accumulated liabilities to insurers, a pipeline that does not much care what the FTSE did last quarter. The dependency I described in 2006 has been written out of the script entirely.
BETTER TODAY
2006: “UK life insurers are expensive. Euro sector average is 11x (2007E).”
The per-stock cells filled in the detail: Legal & General “Expensive: 17x”, Prudential 16x, Friends Provident 15x, with only Aviva at 12x close to the European average of 11x. The market was paying a premium for UK life, and at the time that was understandable; this was where the growth was supposed to be.
On the same measure today the gap looks closed, with the UK names around 11x 2027E earnings against roughly 12x for the European majors. The accounting has changed underneath the ratio, though. IFRS 17, the reporting standard that arrived in 2023, defers profit on new business over the life of the contract rather than recognising it upfront, and reported earnings for UK life insurers fell materially on transition. An 11x multiple on IFRS 17 earnings is not comparable with 12-17x on the 2006 basis; like-for-like, the sector is cheaper than the headline convergence suggests.
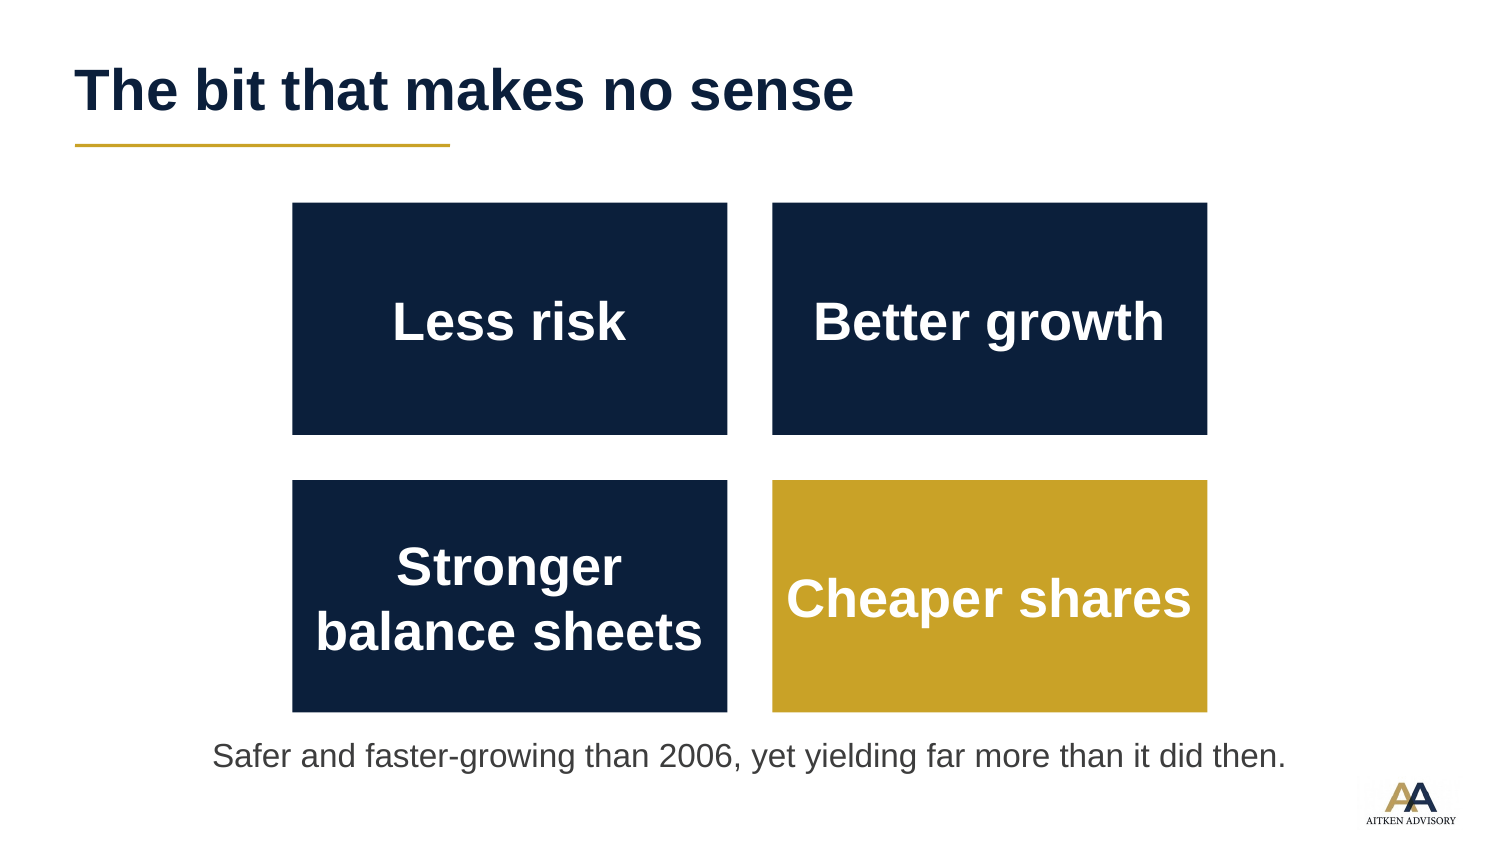
In any case, nobody manages a life balance sheet on IFRS. The hedging runs on an economic and solvency basis, so earnings multiples flatter to deceive, and dividend yield is the honest metric. In May 2006 the page showed Aviva yielding 4.0%, Friends Provident 4.4% and Legal & General 4.2% against a European average of 3.4%, and the UK was still labelled expensive. On 2027E the European average is around 5.5% while the UK sector offers roughly 7.1%. The 2006 premium I can explain; today’s discount I cannot. The sector now carries less risk, holds a stronger and better-regulated balance sheet, and owns a better growth engine with a better pipeline than anything it had in 2006, yet the shares are cheaper. Safer, faster-growing and yielding far more relative to Europe than it did then: the combination makes no sense to me, except as a measure of how unloved the sector is.

Embedded value, the present value of the profits in the existing book plus net worth, completes the picture. The page had Aviva at 1.3x EV, Prudential at 1.4x, and marked Friends Provident and Legal & General “Cheap” at 1.1x. Today Prudential is the only company still publishing an embedded value, and it trades on around 0.9x, which is remarkable for a business that is now pure Asia; Asia was the growth engine of the 2006 group, and it has grown dramatically since, even allowing for June’s Chinese regulatory scare, which I covered in A £21bn overreaction to a rule that isn’t about insurance. In my view, if the others still reported the metric, they would all be below 1x too. The de-rating shows up in the page’s own price column as well: Aviva traded at 722p in May 2006; adjust today’s price for the 2022 share consolidation and the like-for-like figure is around 515p, roughly 29% lower 20 years on.
BETTER TODAY
2006: “Inability to use up-front charges, high commissions and declining with-profit bonuses mean cashflow in UK life is weak.”
Read that quote slowly, because each of its moving parts has since left the stage. With-profits has stopped being sold rather than stopped existing: most of the companies still have with-profits funds on their books, but of the large listed insurers only M&G still writes the business, through PruFund. Commissions went away too, banned on investment products by the Retail Distribution Review in 2013. The weakness they combined to produce has inverted into the whole investment case: bulk annuities throw off long, predictable streams of surplus, management teams talk in operating capital generation because that is what funds the dividend and the buyback, and Phoenix, now renamed Standard Life, was built explicitly as a cash machine. The line that was amber in 2006, and dragged dividend cover with it, is the greenest on the page.
BETTER TODAY
2006: “XS capital, the increased need for diversification (Solvency II) and the fragmented global insurance market, mean M&A potential in 2006-7 may reach late 1990s levels.”
Solvency II, the European capital regime for insurers, was already on the page in 2006, a full decade before it finally arrived in 2016. The drama sat in the stock columns around that cell: Aviva had bid for Prudential in March 2006 and withdrawn within a week, Prudential was “under pressure to deliver after refusing to speak to Aviva”, and the 16% stake in Friends Provident held by AXA’s asset management arm was feeding bid speculation. All of it was insurers circling insurers, and Resolution duly came for Friends Provident in 2007.
The deal flow that matters now is different in kind. Private capital has worked out that long-dated annuity liabilities are exactly the asset it wants, and it has bought its way in: Brookfield has bought Just Group, and Athora has bought Pension Insurance Corporation for £5.7bn. Legal & General chose the partnership route, tying up with Blackstone on private-credit origination to feed its annuity book. Among the listed names the roles have reversed too; Aviva, the frustrated bidder of 2006, swallowed Direct Line for £3.7bn. As for who private capital approaches next, I set out the case in 26 years on, L&G is back in play that Legal & General is the name to watch.
BETTER TODAY
2006: “We believe the structure of UK life reporting leads management to focus on top line rather than improved efficiency.”
The reporting regime made chasing sales rational even when it destroyed value, because new business volume and margin were the headline numbers. That incentive has gone. Operating capital generation is the metric that matters now, and a management team that wrote a record volume of bulk annuities at thin margins would be marked down rather than up, rightly. The job has shifted from growing the top line to allocating capital: choosing when to write business, when to reinsure, and when to hand surplus back. I judge the teams on that, not on a sales table.
BETTER TODAY
2006: “We see little uplift in UK savings rate due to 1. high personal debt levels 2. the government’s means tested benefits 3. a flat UK yield curve.”
All three reasons were sound, and 20 years later the household savings rate has indeed never produced the growth the sector once needed from it. What I could not see was that it would stop mattering. The listed names now grow on corporate pension schemes moving decades of liabilities in single transactions, not on persuading individuals to save an extra 1% of salary. The demand side moved from millions of small voluntary decisions to a small number of very large institutional ones, which is a far more reliable place to stand.
The same row carried the diversity scores, and the assumption underneath them has aged hardest of all. Investors wanted conglomerates 20 years ago. The page approved of Aviva’s spread (life sales split UK 43%, Europe 50%, International 7%) and marked Legal & General down: “Little diversity: life sales are split UK 90%, USA 4%, France 3%, Neth 3%”. The preference has flipped completely; investors now pay for focus, and Aviva has spent recent years slimming down to concentrate on fewer markets, a shift I traced in The Conglomerate Discount That Never Went Away. L&G’s yellow cell turned out to be the winning hand, because the UK liability-side franchise became so attractive that concentration in it is a feature, not a flaw.
STOPPED MATTERING
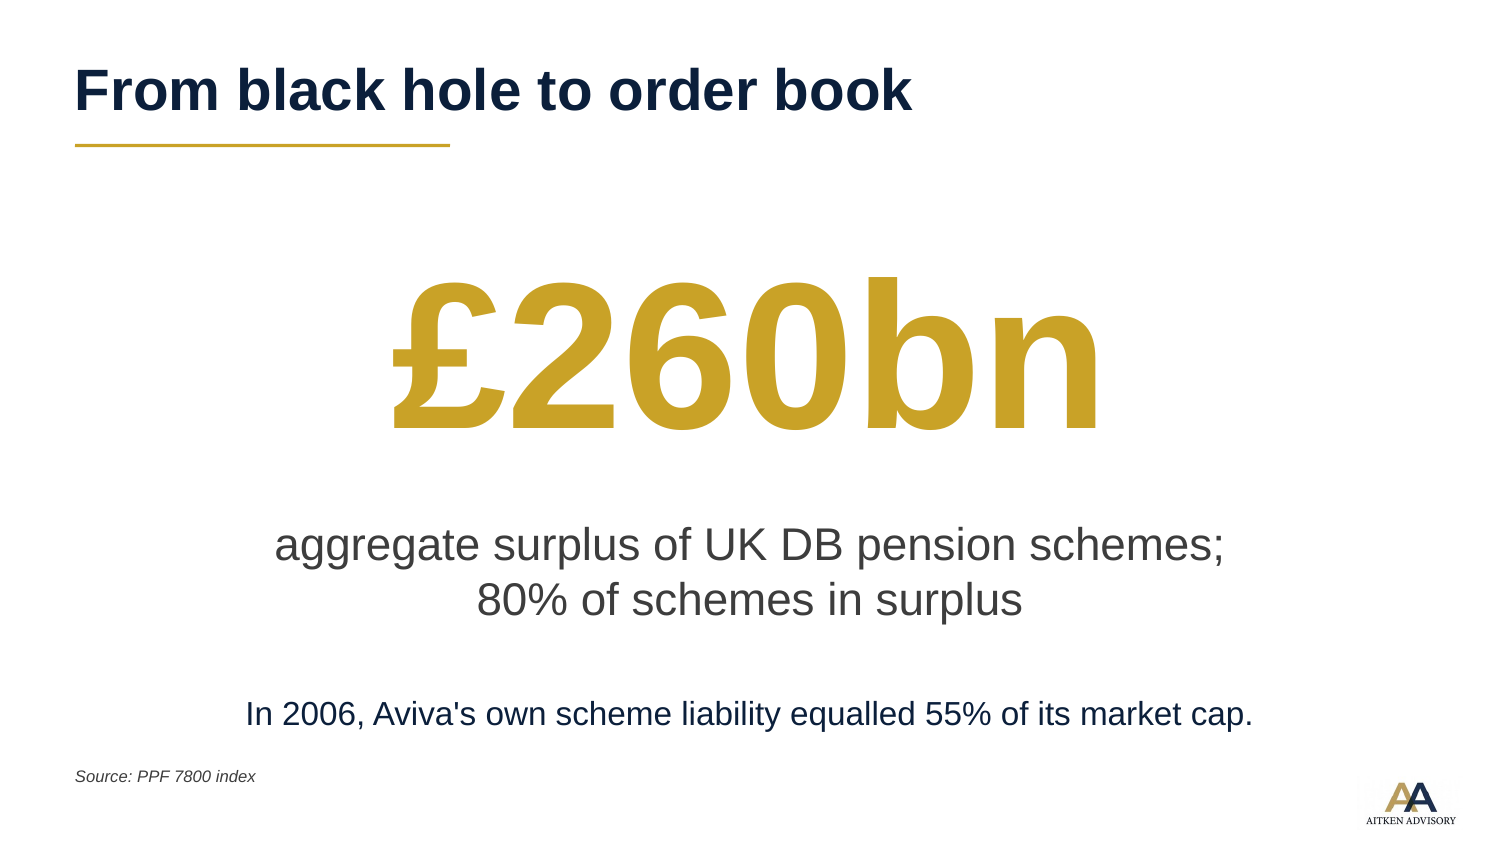
2006: “Deficits are likely understated due to out-of-date mortality tables. New tough regulator requires deficits to be filled within 10 years.”
This row was about the insurers’ own staff schemes, and the numbers were serious: Aviva’s cell showed a pension liability equal to 55% of its market cap. The whole DB world has since swung from deficit to surplus. The aggregate surplus of UK schemes runs at around £260bn, with roughly 80% of schemes in surplus and an aggregate funding ratio above 130%, and the policy debate has moved on to how trustees and sponsors share the excess. The liabilities I flagged as a drain on capital became the sector’s order book: every well-funded scheme is a prospective bulk annuity client, a strange afterlife for the scariest line on the 2006 page.
BETTER TODAY
2006: “UK life expenses / assets (2005 FSA returns). Costs remain too high relative to 1.5% stakeholder cap.”
This was my favourite piece of analysis on the page, and the one whose disappearance I most resent. The old FSA returns, the regulatory filings that preceded today’s reporting, let you compute exactly what each insurer spent as a proportion of assets: Aviva 1.30%, Prudential 1.32%, Friends Provident 1.59%, Legal & General 1.67%. The reason the ratio mattered is that the world then looked like a defined-contribution (DC) world, pensions where the customer builds a pot rather than being promised an income, and in a DC world revenue is capped by what you can charge on assets: 1.5% on stakeholder products, heading, as we then believed, towards 1% as the market repriced. Expenses at or above the revenue cap meant the industry looked structurally unable to make money on the business it was being pushed to write.
Expense ratios still matter inside DC products today. What changed is that DC is no longer where the sector’s value sits; bulk annuities run at very low expense ratios, so the squeeze that looked fatal never played out. I will add the complaint here: this metric is no longer reported in any usable form, because the disclosure died with the FSA returns, and expense efficiency deserves better than that.
BETTER TODAY
2006: “Should see strong top line growth but we believe the new ‘00-series’ projections mean 2% reserve increases will be required.”
The ‘00-series’ were the actuarial profession’s updated projections of life expectancy, which was then improving dramatically. Between 2000 and 2010 the gains ran well ahead of what insurers had reserved for, and every update pushed reserves higher, because people living longer means paying pensions for longer. Then in 2011 the trend turned. Mortality improvements have been far weaker ever since, and a persistent headwind reversed into reserve releases for the annuity writers. The direction of my worry was right, and the rescue came from a trend almost nobody forecast.
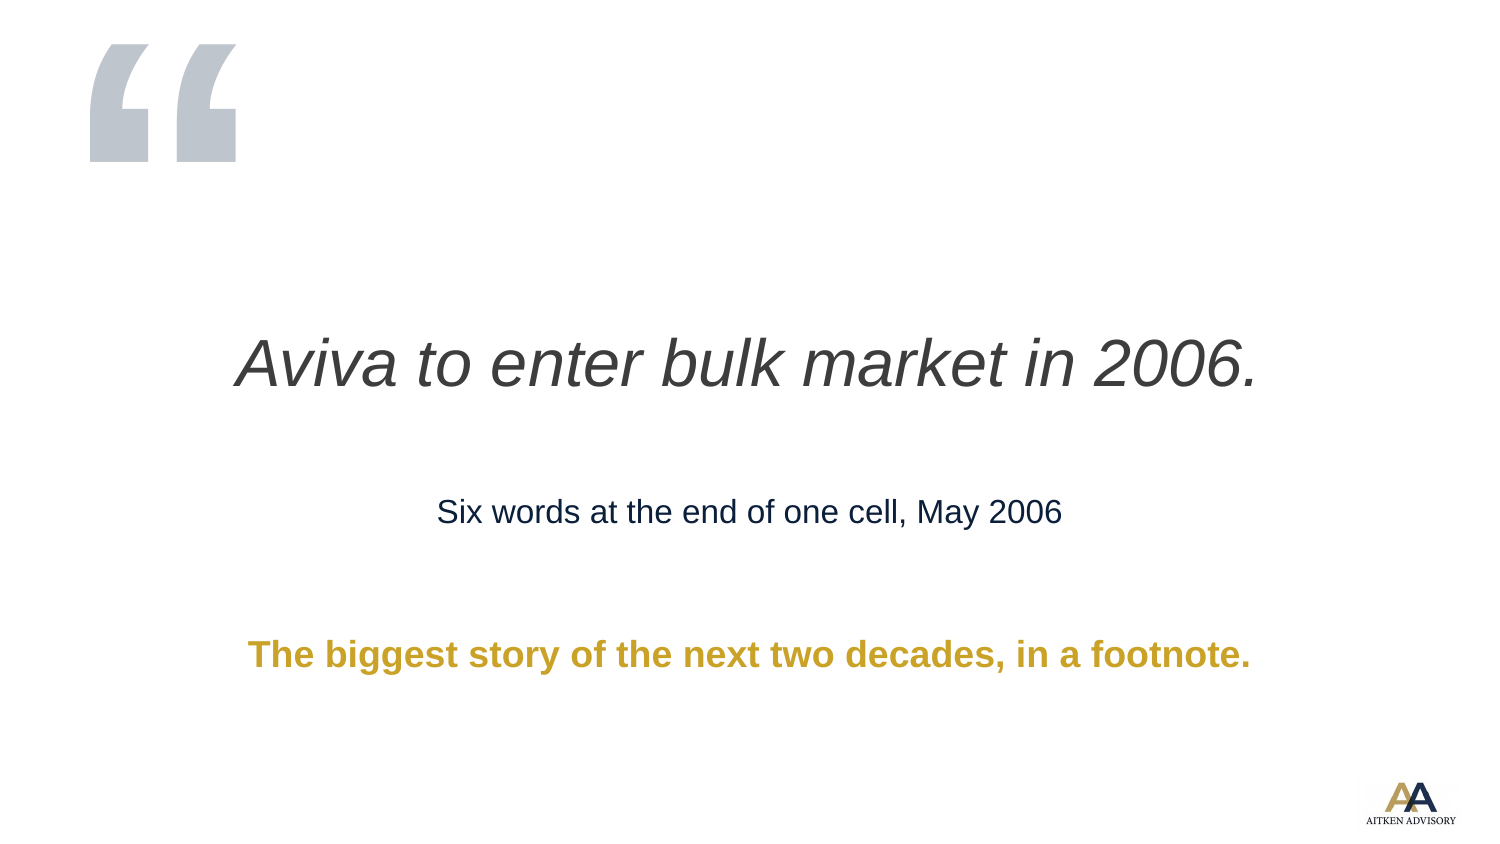
The bigger story on this row was hiding in plain sight. Tucked at the end of Aviva’s annuities cell were six words I nearly read past: “Aviva to enter bulk market in 2006.” The bulk annuity market was then around £2bn a year and belonged entirely to Legal & General and Prudential; Aviva was the next one in, and the opportunity looked so good that a stream of others followed, including companies set up specifically for the purpose, Paternoster and Pension Insurance Corporation among them. The biggest story of the next two decades appeared on the page as six words at the end of a cell.
The retail side went the other way. In the 2014 Budget George Osborne announced that nobody would have to buy an annuity again, and the individual market collapsed. An individual annuity and a bulk annuity are essentially the same product, bulk being a collection of retail promises priced and managed together, so as the retail market faded it made sense that the expertise moved across. The bulk purchase annuity (BPA) market reached around £40bn in 2025, its third consecutive year above that level according to LCP, which forecasts £40bn to £55bn for 2026, a potential record; in my view it will dominate the economics of the listed sector for the next 30 to 40 years, because the DB schemes feeding it are only part-way through transferring to insurers.
BETTER TODAY
2006: “L&G said pensions business is loss making. A-day should improve volume but Turner’s 30bps BritSaver is a threat.”
A translation for younger readers: A-day was the April 2006 pensions simplification, and “Turner’s 30bps BritSaver” was Lord Turner’s proposed national low-cost savings scheme, which became NEST and auto-enrolment. The threat was real and it arrived. Workplace pensions became a basis-points business, the competition is intense, and the technology spend never stops. Defined contribution is the long-run future of UK savings, I have no doubt about that, but as a place to make money I would still mark this cell yellow. I would much rather own the bulk annuity story, which I think remains underappreciated in valuations, than the scramble for DC flows. Of all the lines on the page, this is the one where my 2006 caution has barely softened.
NO BETTER TODAY
2006: “Volatility in equity markets has spiked recently.”
The page is priced 12 days into the May 2006 market correction, so this line was current affairs rather than prophecy, and the cell beneath it carried the number that mattered: for Aviva, Legal & General and Prudential alike, embedded value fell 6% for a 10% decline in equity markets, enough to hurt in any wobble. Today there is really no equity risk in the sector to speak of. Bulk annuity books are backed by bonds rather than equities, and a 10% market fall that would have knocked 6% off value in 2006 barely moves a modern solvency ratio. The scars of that era still shape how investors see these companies, a gap I wrote about in UK Life Insurers: Haunted by the Dot-Com Crash, Built for Today.
BETTER TODAY
2006: “UK long bond yields have been volatile yielding 4.7% in Mar 2005 and falling to 3.7% in Jan 2006.”
The sensitivities behind this line were real; Legal & General’s cell showed new business profit falling 7% for a 1% fall in yields, which is why a 100bps round trip in ten months earned a row on the page. Today annuities are priced off gilt yields, which means a move in rates largely washes through the solvency ratio, and there is little genuine economic exposure left. What has survived is the direction: falls in yields were the bad news then and remain the bad news now. Higher yields, if anything, help, by making buyouts affordable for pension schemes and improving solvency ratios, which is why the sector has often outperformed when gilt yields rise, the subject of a piece I wrote in March when the market was trading it the other way.
BETTER TODAY
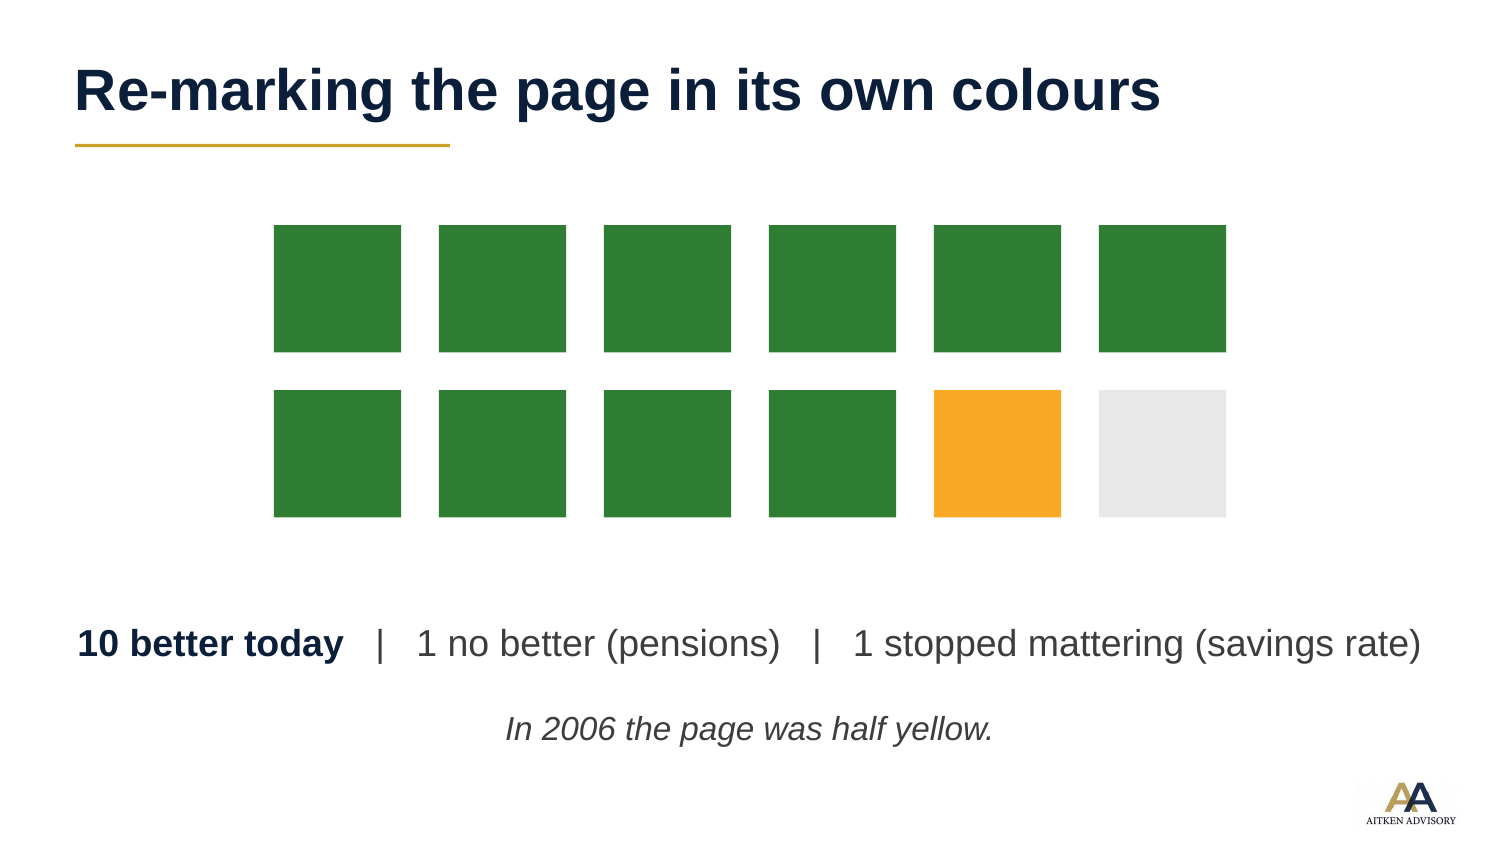
Marked in the page’s own colours, the 2006 exhibit was half yellow; run the same rows today and ten of twelve come back better. The market spent 20 years watching the wrong cells: the risks that earned whole rows, equity sensitivity, the savings rate, geographical spread, have either reversed or faded, while the biggest story of the era sat in six words at the end of a cell. Judging by where the sector trades against the cash those annuity books will produce, it is still watching the wrong ones.
As for the author, the page turned out to be exactly that, a parting shot. Within weeks I had left JPMorgan for Standard Life, which floated on 10 July 2006 at 230p, a £4.7bn IPO and the largest UK flotation since 2000, and I went straight from laminating fixtures lists into building the investment case and flying a global roadshow to find cornerstone investors. The life business I joined, which was most of the group, has since come full circle: it ended up inside Phoenix, and Phoenix has now taken the Standard Life name. The reckoner was built to last one summer. The market it described is still working through its answers.
Gordon Aitken runs Aitken Advisory, providing strategic advice on life insurers and pension funds. I work with investors, insurers and advisers on transactions, capital strategy and market positioning. As I did throughout my sell-side career, I meet fund managers and investors for one-to-one briefings on the sector. If you would like to arrange a briefing or discuss a potential engagement, click the button below to email me.
For a deeper look at what solvency ratios really mean in probability terms, and why high capital strength can coexist with weak valuations, see my book, Breaking Down the Insurance Black Box.
Disclaimer
The content of this publication reflects my personal views only and is provided for information purposes. It does not constitute investment advice or investment research, and I am not acting in the capacity of an investment adviser. I own shares in some of the companies mentioned. Readers should carry out their own analysis or seek professional advice before making any financial decisions.
Thanks for reading The Insurance Black Box! This post is public so feel free to share it.
No posts
Comments
Nothing yet. Say the first thing.
Sign in to join the conversation.