
Note: These are my personal views only and do not constitute investment advice. See full disclaimer below.
Audio embedded below.
0:00
-16:49

The easiest note to write in this business is the scary one. A trainee can do it: pick an exposure, point at the uncertainty, and let the reader’s imagination do the rest. It will get read, it will get shared, and it will get traction, none of which makes it right. I watched this pattern for 30 years on the sell side, from newspapers and analysts alike, and returns in this sector have belonged to investors who saw through it.
This week produced a textbook example. On Monday the FT ran the headline “UK pension insurers raise exposure to opaque private credit”. The S&P Global Ratings report behind it, published the day before, is titled “U.K. Bulk Annuity Insurers’ Private Credit Exposure Set To Remain Manageable”. Same research, same numbers, same analysts. The FT title flags a growing risk; S&P’s own title states its finding, that the exposure is manageable. The finding is the version almost nobody will read. The comments under the FT article, 57 of them by breakfast, tell you which version landed: “what could possibly go wrong” appears twice, word for word, from different readers, and another declares the regulator asleep at the wheel.
I have written twice before on private credit in UK annuity portfolios. Part 1 set out why insurers hold these assets in the first place: annuity liabilities are long dated, cannot be traded or redeemed, and are naturally matched with long dated illiquid assets. Part 2 moved from narrative to numbers, using company disclosures and the Prudential Regulation Authority’s (PRA’s) Life Insurance Stress Test to show what actually sits inside these portfolios. I’ve added links at the bottom of this article. This third piece writes itself, because a rating agency has now done precisely the exercise I argued the market needed, and the market has been handed the opposite conclusion to the one the agency reached.
S&P built a hypothetical portfolio modelled on the average UK bulk purchase annuity (BPA) insurer’s Matching Adjustment (MA) portfolio and put it through a set of historical credit catastrophes. The MA sits at the centre of UK annuity regulation: insurers ring-fence a pool of long-dated assets whose cash flows match their annuity payments, and in return may recognise the extra yield on those assets upfront in their solvency position, provided the assets pass the PRA’s eligibility tests. In S&P’s exercise, the property-secured assets took the 2001-02 corporate credit shock. Equity release mortgages (ERMs) took a 20% fall in property values. The remaining private credit took the 2007-09 global financial crisis, including its implications for structured finance. These are not gentle assumptions; in the financial crisis leg, S&P assumes 12% of A rated assets, 32% of BBB and 38% of BB default outright.
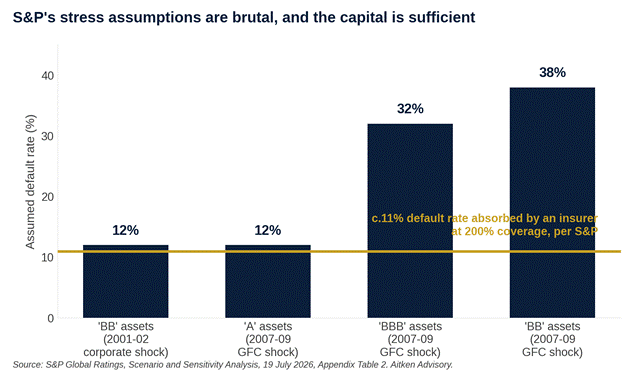
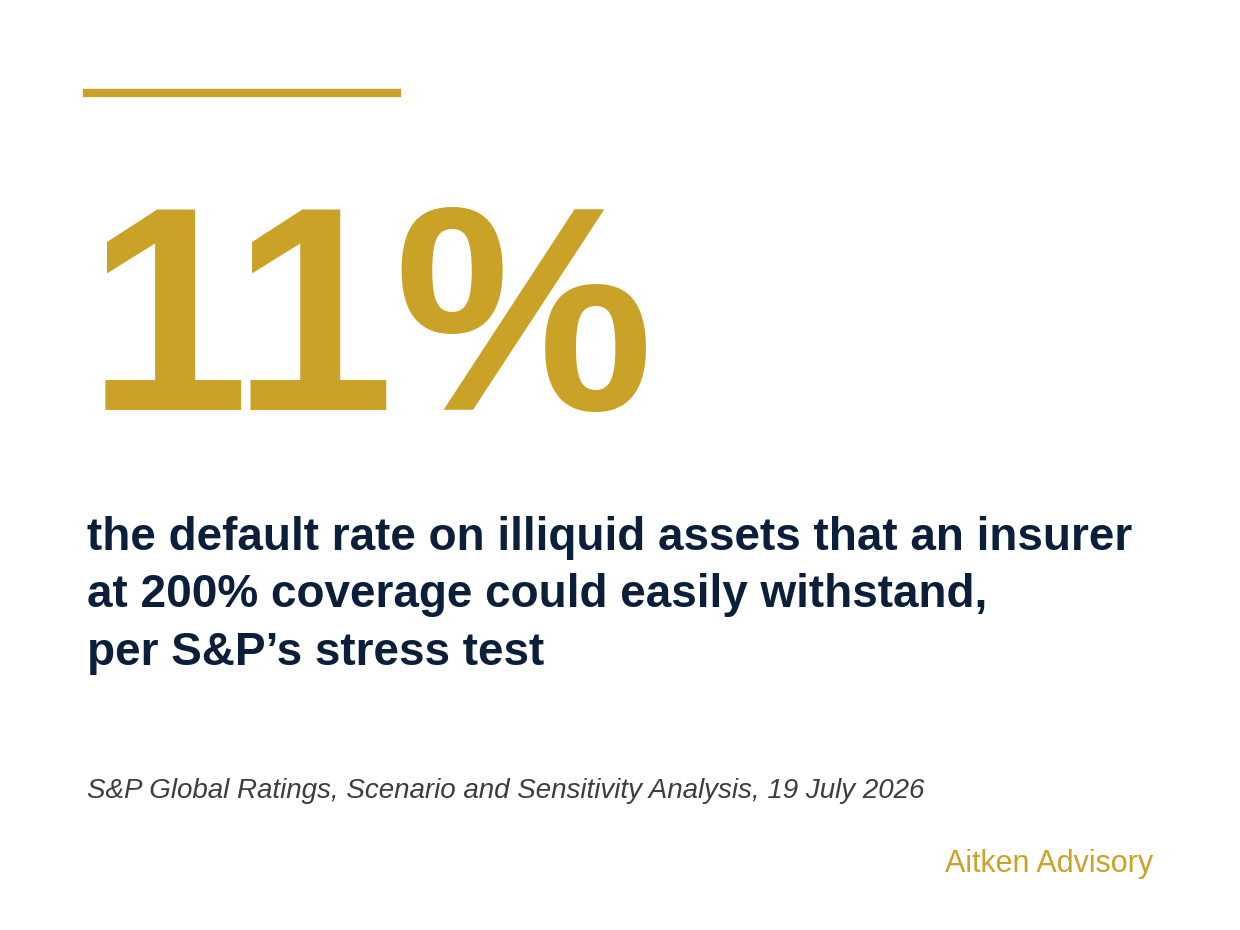
The result is stated plainly in the report. A UK life insurer with a coverage ratio of 200% under S&P’s capital model “could easily withstand an extreme scenario that assumes a default rate of about 11% in the illiquid portion of the portfolio”, while remaining above the 99.5% confidence level, the 1-in-200 standard on which solvency requirements are built. To push further, S&P then assumed the entire internally rated book was BBB, and in a second run entirely BB, materially below the credit quality insurers actually report. In both runs, coverage stayed above S&P’s threshold.

This is consistent with what the regulator found. The PRA’s Life Insurance Stress Test (LIST) 2025, which I covered in November, applied a severe market and credit shock to the 11 largest BPA writers and saw aggregate solvency coverage fall from 185% to 154%, with every firm remaining above its capital requirements. Two independent referees have now run severe credit scenarios through these balance sheets and reached the same answer: the sector holds enough capital to absorb a repeat of 2008.
The FT's core exhibit is the one I reproduce below. The full bars, everything IFRS classes as Level 3 debt and loans, run from about 10% of invested assets at PIC to 42% at Just Group. The gold segments are the cleaner proxy for private credit itself, and they exceed 10% at just three firms: L&G, Standard Life and Just Group. The navy and blue segments, infrastructure and secured residential lending plus ERMs, make up the rest. The chart is accurate, but it needs two qualifications that sat inside the report and did not make the article's framing.
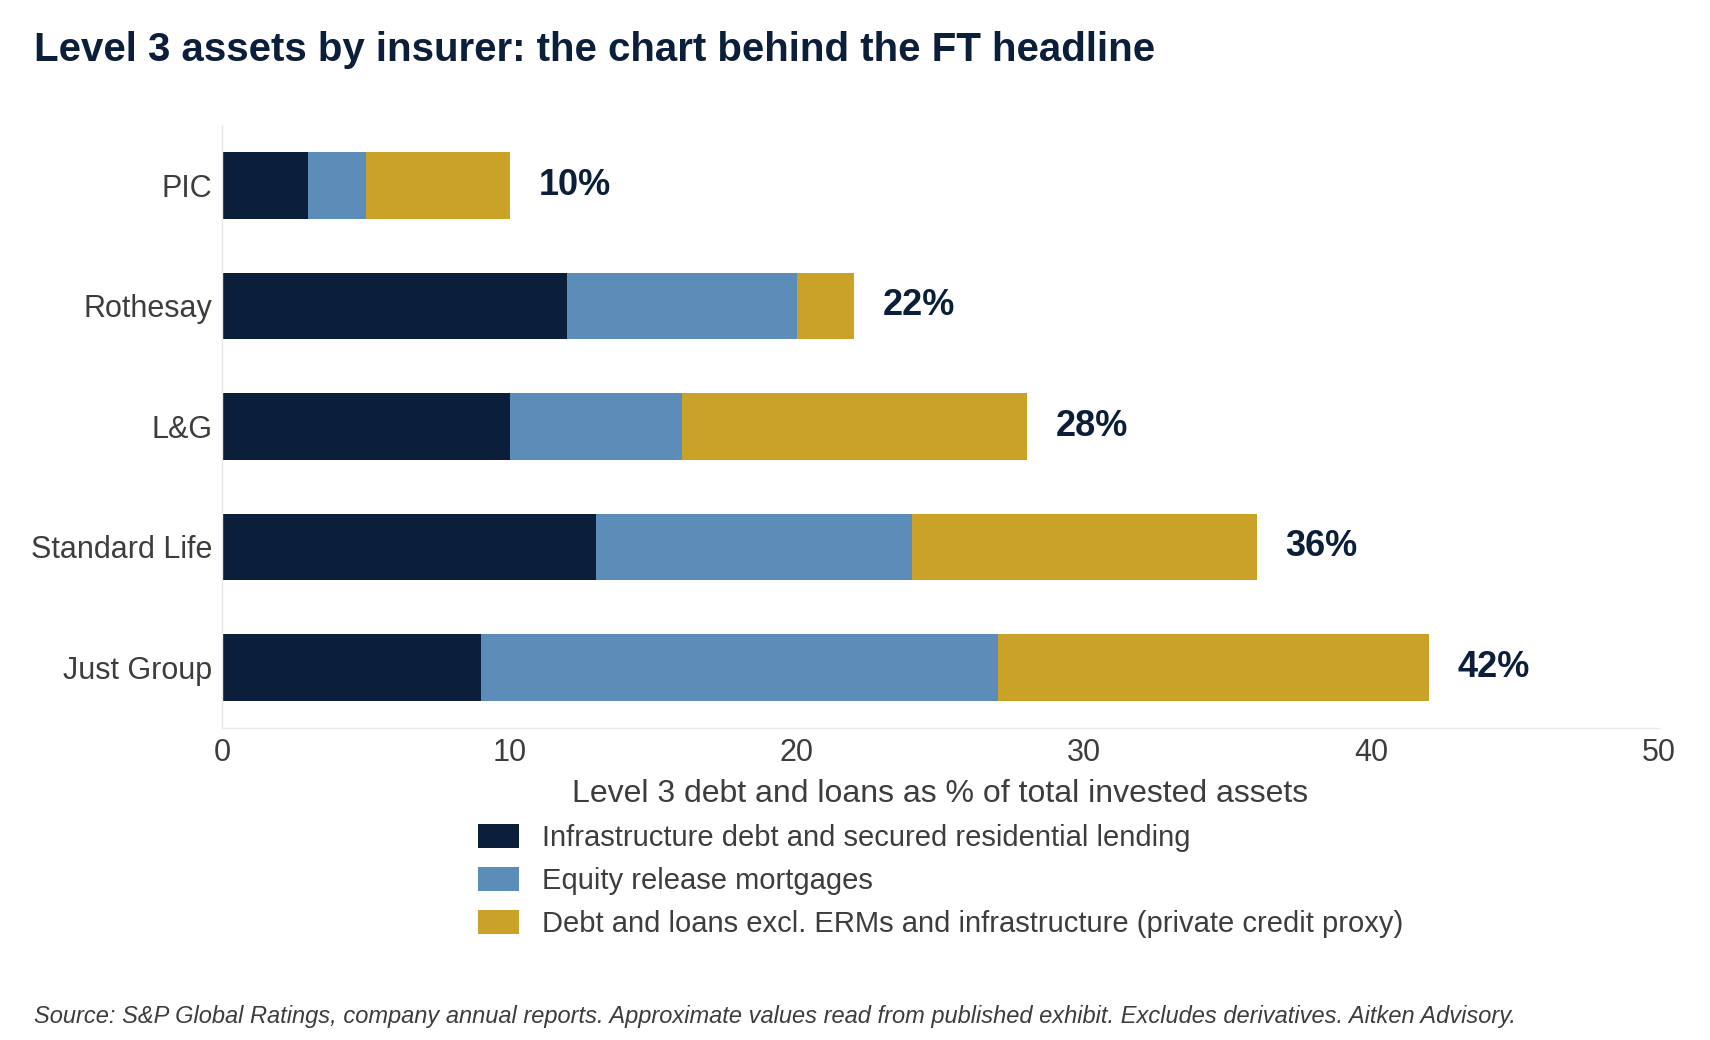
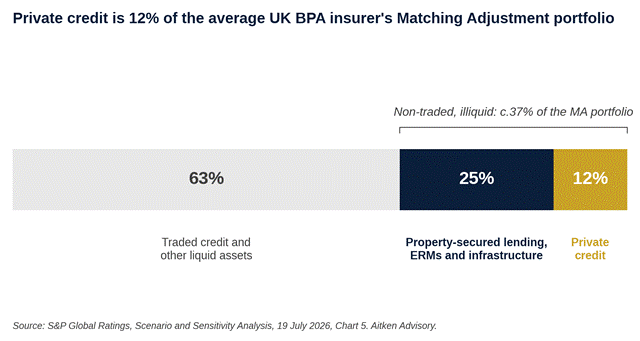
First, Level 3 is a proxy, not a measurement. IFRS sorts assets into three levels by how their fair value is established: Level 1 assets are priced from quoted prices in active markets, Level 2 from observable inputs such as prices of similar instruments, and Level 3 from models with unobservable inputs. Level 3 does not mean low quality; it means nobody publishes a daily price. The bucket therefore sweeps up ground rent, student accommodation, social housing and other secured residential lending, assets with property security and decades of benign performance that no credit investor would describe as frightening. S&P’s cleaner estimate is that private credit proper is about 9% of UK BPA insurers’ total portfolios, and about 12% of the MA portfolio once ERMs, infrastructure and secured residential lending are stripped out.
Second, the proxy misfires on the largest book. S&P notes that PIC classifies a larger portion of its private credit as Level 2 than the other firms analysed. A Level 3 proxy misses whatever sits in Level 2, so PIC's bar captures less of its private credit than the other bars capture of theirs, in my view. Anyone ranking the insurers off that exhibit is ranking an accounting classification, not an asset allocation.
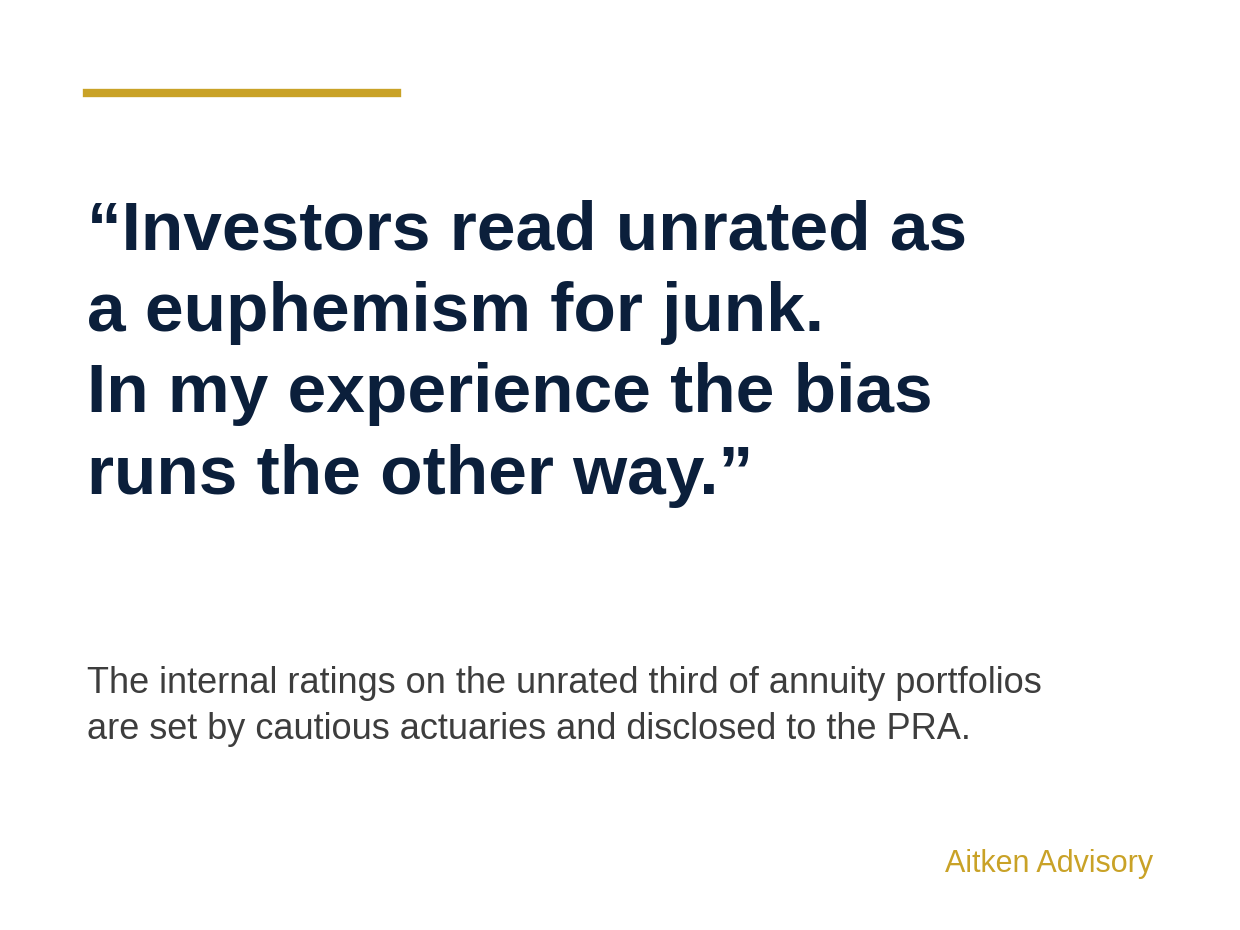
About one-third of MA portfolio assets carry no external rating, which sounds alarming until you look at who sets the internal ratings and who checks them. My own experience of these people, having met plenty of them over the years, is that they are usually actuaries, and cautious ones. The consequences of the PRA finding an internal rating too generous are severe enough that they almost always sit a notch below where an external agency would land. Investors read unrated as a euphemism for junk; in my experience the bias runs the other way, and too little of that reaches investors.
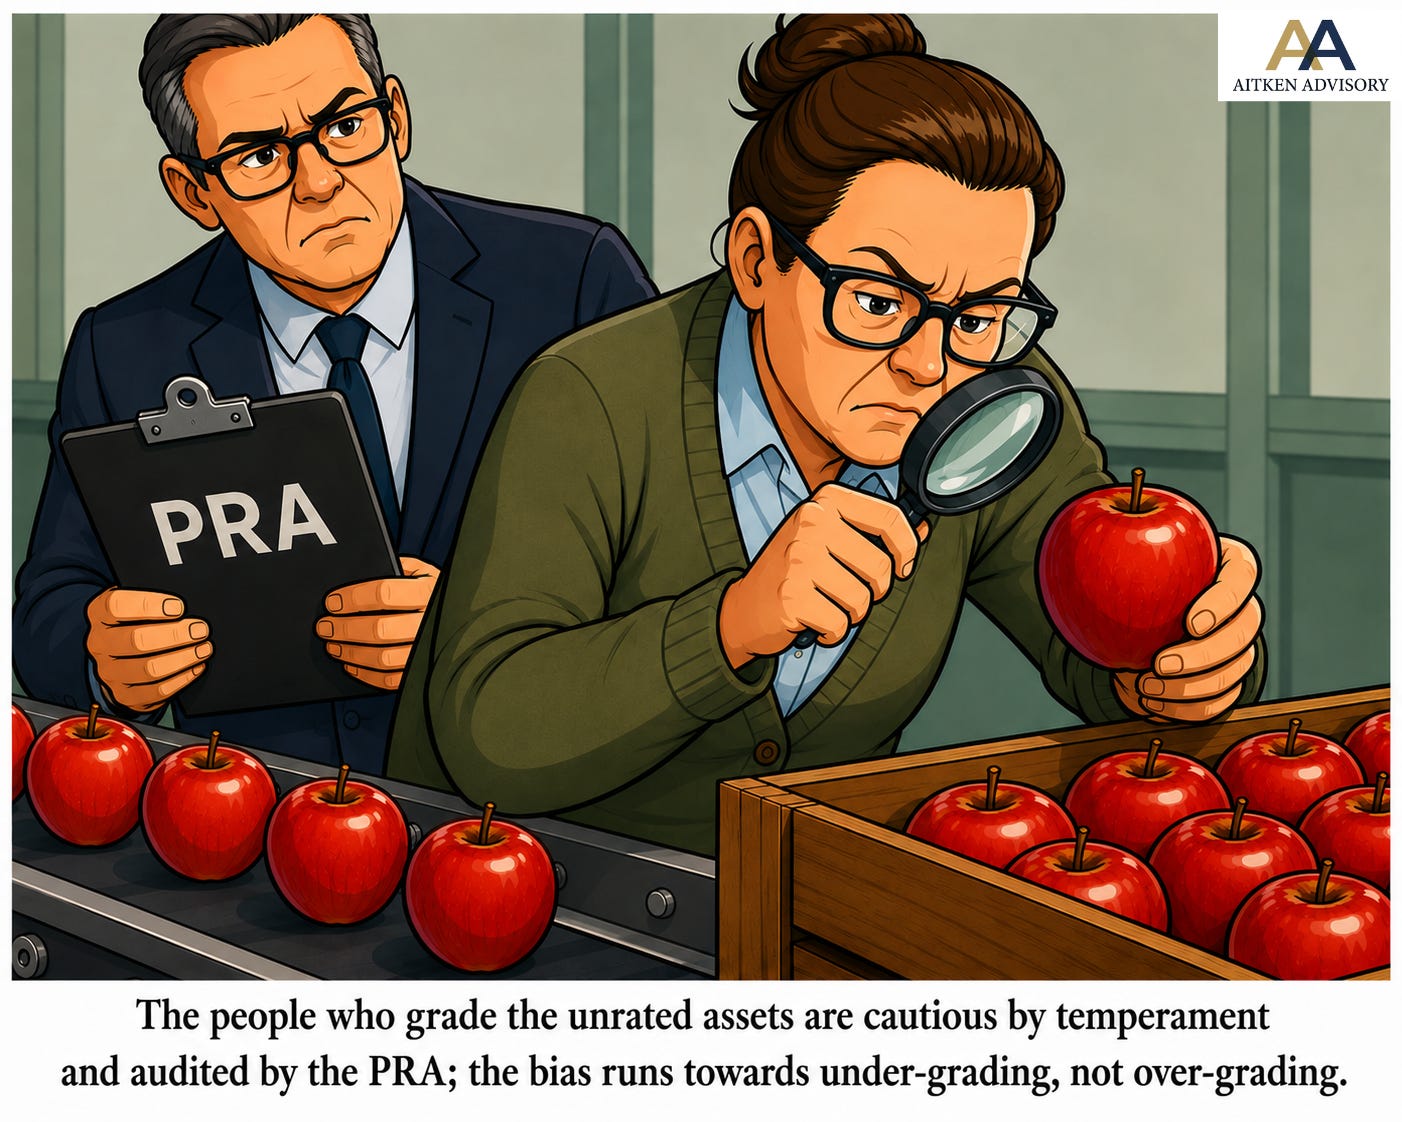
The disclosed numbers support it. Of the firms that publicly disclose their private ratings, 90% are investment grade, and the rating methodologies are disclosed to the PRA for regulatory recognition. S&P found no evidence that the illiquid portion of the portfolio is of significantly lower quality than the traded portion. I made the same point in Part 2 from company disclosures: across years of deep disclosure and analyst scrutiny, I cannot recall a single instance where private credit defaults had a material impact on the earnings or capital of a major UK annuity writer.
None of this is a criticism of the FT article, which is accurate throughout and quotes S&P’s own caveats. The two hedges it led with, limited visibility into holdings and uncertainty about performance “in case of a deterioration”, are both in the report. They are the caveats a rating agency writes around a benign conclusion, partly because flagging the tail is the job and partly because it costs nothing. The newspaper then faces its own incentive: “capital buffers adequate, insurers fine” does not sell, whereas opacity does. Everyone loves a scare story.
The structural problem for investors is the asymmetry of access. The scary headline is free to read; the reassuring stress test sits behind S&P’s registration wall. The report itself, with the 11% default absorption and the “could easily withstand” conclusion, will be read by a fraction of the FT’s audience.
The version that circulates, gets screenshotted, and quietly weighs on listed life insurer valuations is the alarming one. UK life insurers already trade on dividend yields of 6% to 8%, which tells you the equity market is pricing meaningful balance sheet risk that neither the PRA nor S&P can find.
The worry list itself is the tell. In my sell-side years it rotated from commercial property to equity release mortgages to leveraged gilts and now to private credit, while the solvency ratios barely moved. The asset class changes and the discount stays.
An interesting paragraph in the report has nothing to do with solvency, and as far as I can tell no press coverage picked it up. S&P observes that significant stress in the private credit market could change the behaviour of pension scheme sponsors. Many defined benefit (DB) schemes currently sit in surplus and are conservatively invested. If private credit blew up, trustees and sponsors might become reluctant to hand their members’ benefits to insurers that invest in it, and choose instead to run their schemes on. S&P is explicit that this “could reduce the size of the BPA market significantly” and could affect its view of the business risk profile of rated BPA insurers, particularly the less diversified ones.
S&P’s tail risk is not that annuity writers go bust; it is that their growth market shrinks. The prize at stake is large: research by L&G, cited in the S&P report, suggests the UK will capture half of an estimated £1trn global BPA market over the next decade. For the listed insurers, I would treat this as a second-order effect, and not an obviously negative one. Bulk annuities are capital intensive; writing fewer of them means less new business strain and more free cash flow. L&G, Aviva and Standard Life would simply hand back more cash, while Rothesay and PIC, the pure BPA monolines, would feel a demand shock directly. Lower volumes are not the same thing as lower share prices.
There is a certain irony here. The thing most likely to trigger that demand shock is not defaults themselves but the perception of danger, which is to say the scare story. The FT headline is a small contribution to the very risk S&P identifies.
S&P’s stress test excluded one channel: a credit deterioration would raise the fundamental spread, the implicit allowance for credit risk, which reduces the discount rate applied to liabilities and would add a second-order hit that the modelling did not capture. The one-third of MA assets without external ratings is a real information gap, and my view that internal ratings are reliable rests heavily on PRA scrutiny holding up as the market doubles. In addition, the private capital owners now running PIC and Just have every incentive to push allocations towards the US model, where private credit shares of insurance portfolios run far higher. So far, what I hear is that very little has actually changed: credit spreads are tight and there has been no wholesale shift in asset allocation. The S&P analysis describes today’s portfolios; the incentive describes tomorrow’s. Disclosure remains the weak point, as I argued in Part 2: reporting is not standardised across firms, and greater standardisation would do more to close the valuation discount than any number of stress tests.
Two referees have now marked this exam. The PRA stressed 11 firms and all passed with coverage of 154% after shock. S&P stressed a portfolio with an 11% default rate on its illiquid assets, then downgraded the whole internally rated book to BB, and coverage stayed above its threshold. The title of the agency’s own report calls the exposure manageable. Set against that, the market prices L&G, Aviva, and Standard Life as if a credit event is a live probability, and each retelling of the opacity story keeps it that way.
My conclusion across this three-part series has not changed, and it has now been independently tested. UK annuity writers hold private credit because the Matching Adjustment framework was designed for exactly this pairing of illiquid assets and non-surrenderable liabilities, the quantum is about 9% of total portfolios rather than the 40% figure doing the rounds, and the capital survives scenarios worse than anything in the historical record. Read the report, not the headline. The gap between the two is where the opportunity in this sector has sat for years.
Part 1 of this series covered why UK life insurers hold private credit.
Part 2 examined what sits inside annuity portfolios and the key risk calibrations.
Source: S&P Global Ratings, “Scenario and Sensitivity Analysis: U.K. Bulk Annuity Insurers’ Private Credit Exposure Set To Remain Manageable”, 19 July 2026; PRA Life Insurance Stress Test 2025 Results, 17 November 2025; FT, 20 July 2026.
Gordon Aitken runs Aitken Advisory, providing strategic advice on UK and European life insurers and pension funds. I work with investors, insurers and advisers on transactions, capital strategy and market positioning. If you would like to discuss a potential engagement, click the button below to email me.
Why does private capital keep finding value in insurance that public markets ignore? That is the subject of my new book, How Private Capital Found the Value Public Markets Forgot, the second in the Breaking Down the Insurance Black Box series.
Disclaimer
The content of this publication reflects my personal views only and is provided for information purposes. It does not constitute investment advice or investment research, and I am not acting in the capacity of an investment adviser. I own shares in some of the companies mentioned. Readers should carry out their own analysis or seek professional advice before making any financial decisions.
If you found this post helpful, feel free to share it with colleagues or subscribe for future updates on UK life insurers and pension funds.
No posts
Comments
Nothing yet. Say the first thing.
Sign in to join the conversation.