Weekly Bias:NEUTRAL Gold has built a stronger base, but higher real yields and a stronger dollar still cap rallies.
Week Type:RANGING Dealer hedging is damping volatility this week.
Position Size:HALF Professional traders reduced exposure into the week, we should do the same.
Three major economies reported inflation this week. I kept expecting to find evidence that the oil spike had spread into the rest of the economy - I didn’t.
🇨🇦 Canadian headline inflation fell from 3.2% to 2.8% as gasoline prices fell during the ceasefire. Strip out gasoline and inflation stayed the same as in May, 2.2%.
🇬🇧 The UK inflation is stickier. Their headline number came in the lowest in more than a year - just at 2.6%, but core inflation was also at 2.6%, and services inflation barely moved.
None of this should shock the Bank of England though. They've been saying for a while that Brexit left the UK with a higher inflation baseline, so a slower return to normal has been part of the expectation.
🇯🇵 Japan is actually the country I cared about most this week. It imports almost all its energy, so if expensive oil was feeding into broader inflation, Japan should have been first to show it.
Instead, producer prices jumped 7.1% in June while consumer inflation was only 1.6%. My guess is that companies are eating most of the higher costs instead of passing them on to customers.
🇪🇺 Europe didn’t publish inflation data this week, but Lagarde was asked directly about second-round effects after Thursday’s ECB meeting. Her answer was that the ECB isn't seeing them.
Business surveys don't point to broader price increases or stronger wage pressure, and services inflation eased again last month.
So across Canada, Europe, Japan, and even parts of the UK, we see the same pattern - the energy shock is staying in the energy sector.
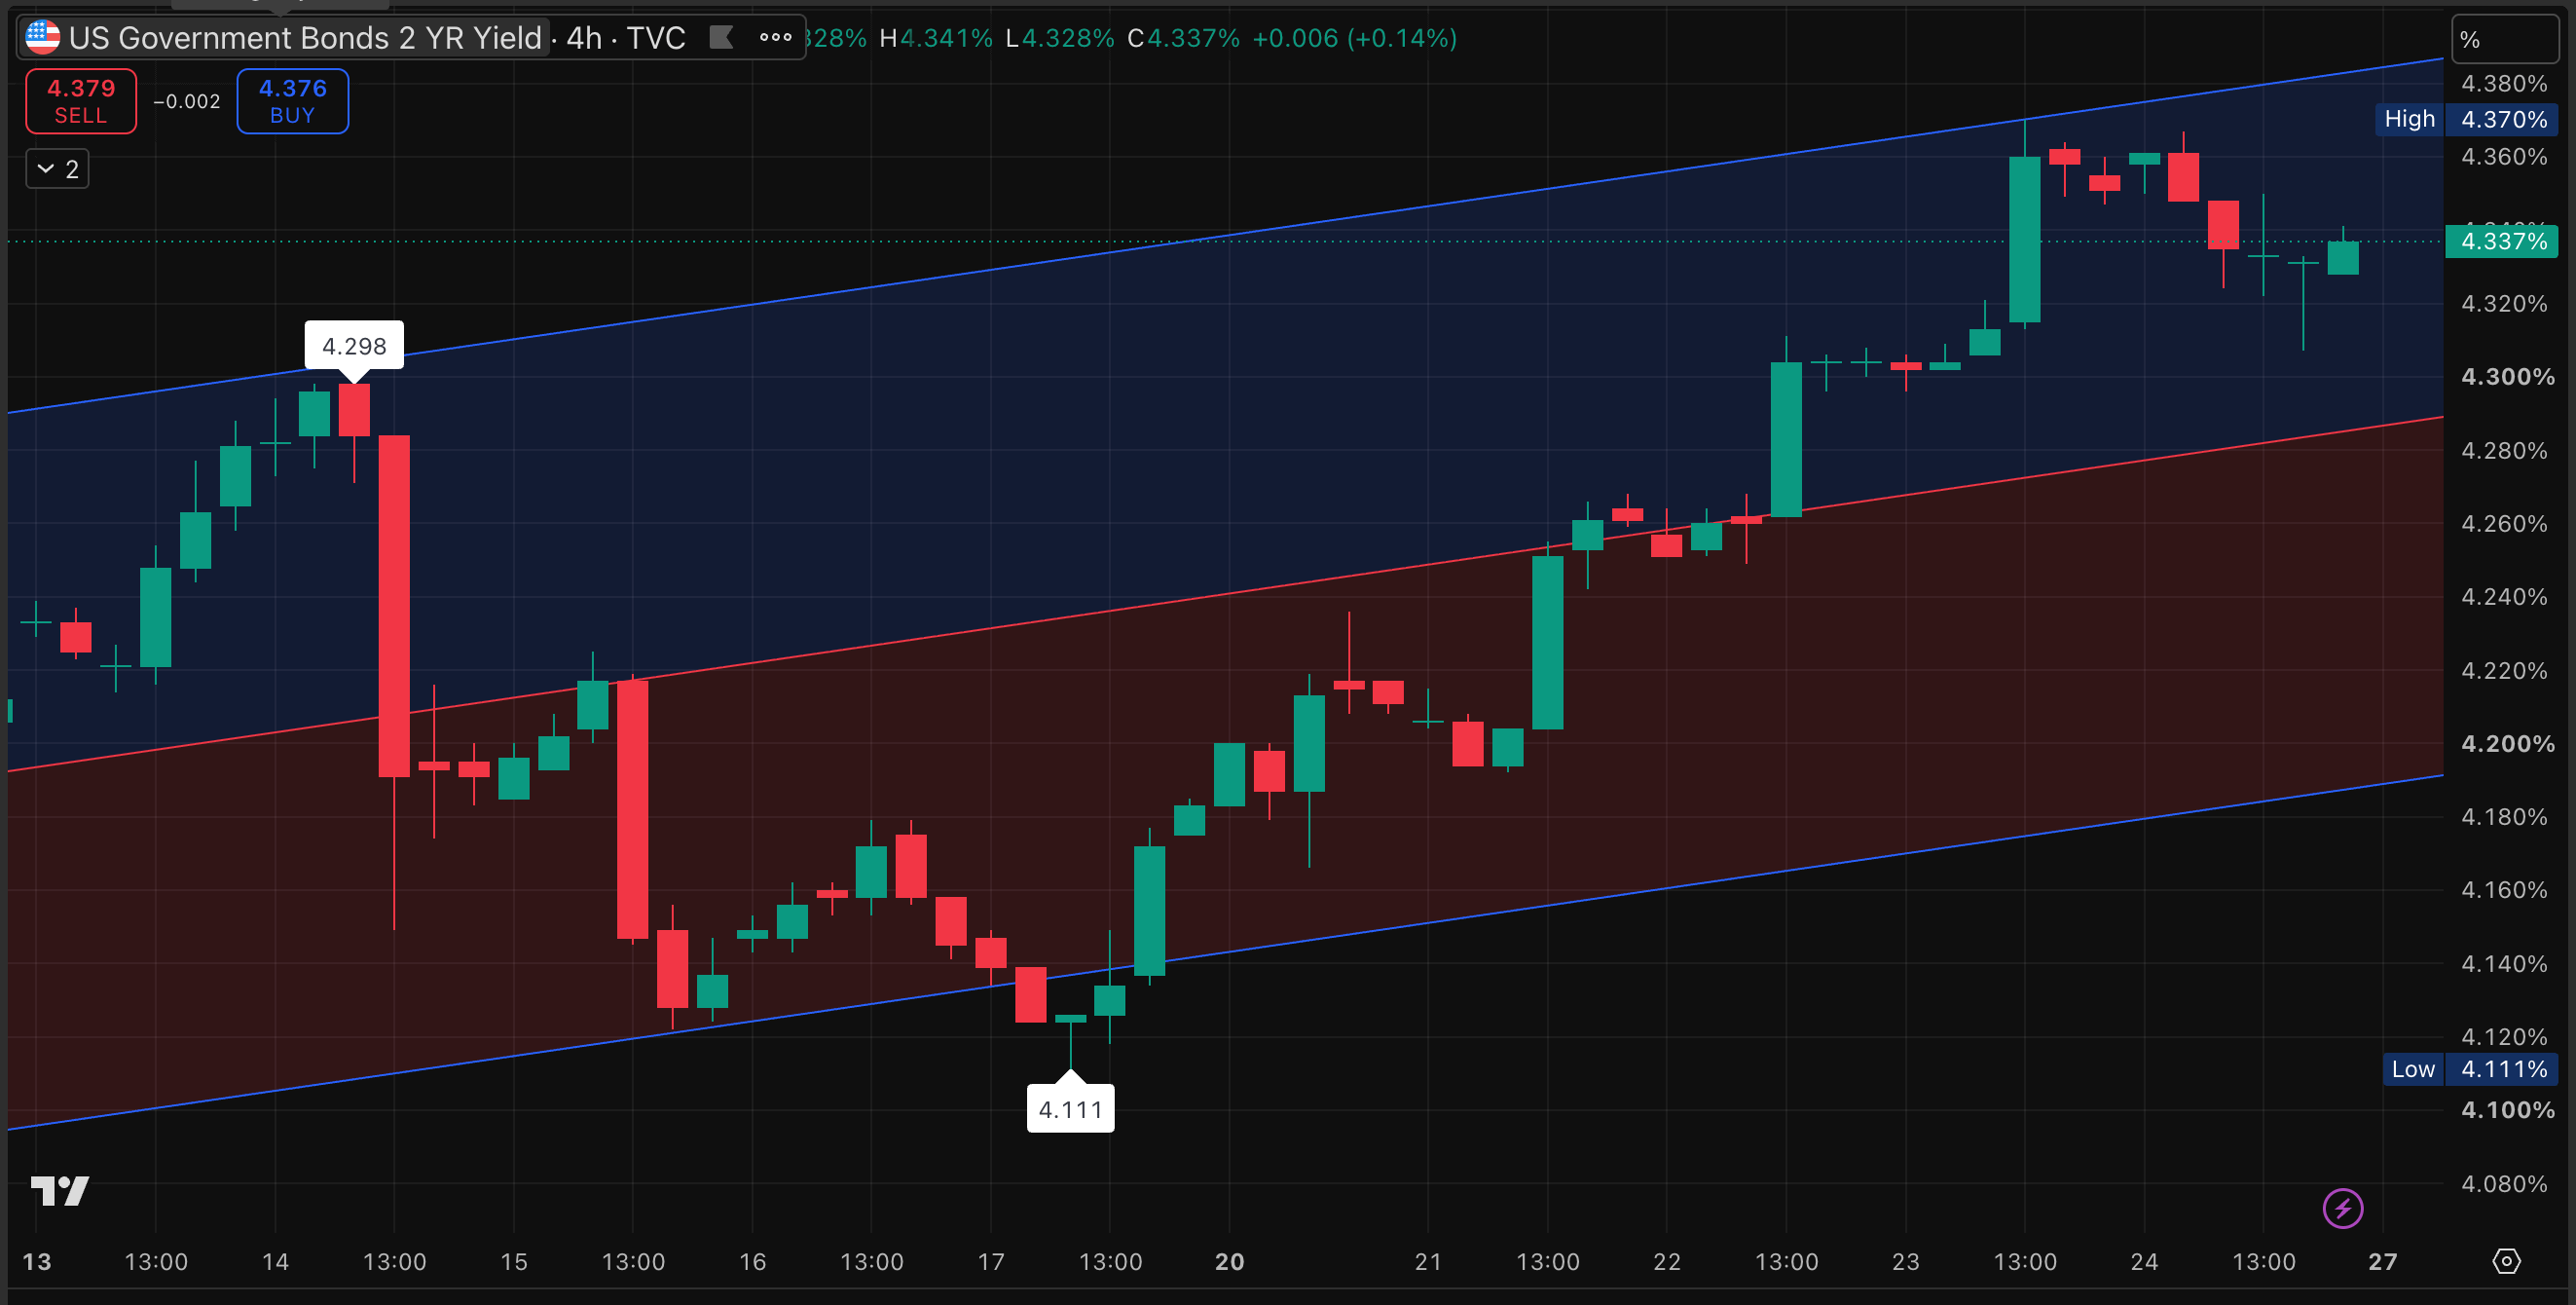
If that’s true - what exactly are U.S. bond investors looking at?
If this keeps going, "18-month high" is going to need a shorter name
American inflation is high, we all know this, and oil has been pushing headline inflation even higher. The bigger problem, though, is that the US inflation was already broad before oil.
Goldman Sachs estimated that nearly 60% of the categories inside core PCE were rising faster than 3% a year as of June. Before COVID, that number averaged about 37%. During peak pandemic inflation, it was close to 80%.
I don't usually like relying on a single bank's model, but this one lines up surprisingly well with what we're seeing elsewhere.
Core PCE itself was running ~3.4% in May. That's a lot of prices moving together and it's also what makes the US different from Canada, Japan, or the Eurozone, where inflation is much more concentrated.
Also Core PCE was already 2.8% last October, months before the first strike on Iran.
So Treasury yields are showing exactly that - higher oil explains part of the move higher while the rest reflects investors becoming less convinced that inflation will return to 2% anytime soon.
Oil prices don't stay in one place for very long. So if crude falls back to $80, headline inflation comes down with it.
I still think that’s mostly true in Europe, but the US situation is more complicated.
If investors are now repricing a domestic inflation problem that existed before the war, a ceasefire doesn't change much. Because cheaper oil wouldn't magically erase the broader inflation pressures that's been around since before anyone was talking about missiles.
There's still a reasonable case that inflation continues to cool.
Goldman Sachs still expects inflation to become less broad later this year. Other analysts also think housing inflation should cool further, wage growth should ease, and underlying inflation should continue drifting lower.
We’ll get a much better clue on July 30 when e get GDP and the core PCE.
As of now, markets expect monthly core PCE to come in between 0.1% and 0.2%. Doesn’t sound like much, but the difference between 0.1% and 0.2% matters.
A 0.2% would suggest inflation is proving harder to bring down than many expected.
A 0.1% reading would make June look less like a lucky month and more like the start of a broader slowdown.
That's really what the market is trying to figure out.
This is where the free report ends...
You now know what’s moving Gold. The paid report is about what to do with that information.
Inside this week’s plan:
Every support and resistance zone on my chart
5 setup ideas with exact entries, stops, and profit targets I’m using
My capital protection plan with exact alerts when to reduce/cut my position
The interactive Trade Board: input the current price and it shows you which setups are live and which need extra confirmation.
One trade won’t make your year. A process you can repeat every week just might.
When you join premium, you also get:
My proprietary ‘Gold Spotter’ tradingView warning system: Imagine knowing 3–5 days before everyone else when Gold is about to reverse. This leading custom-built tool does just that.
Proprietary SAGE - a rule-based indicator designed to put you in high probability buy setups and keep you away from bad ones.
Mid-week level updates on Telegram - Markets change. Levels shift. When they do, you’ll know immediately.
This isn’t for everyone. I want traders who are serious about making money and feeding their families, just like me.
If that’s you, it’s time to stop guessing and start trading with a plan.



Comments
Nothing yet. Say the first thing.
Sign in to join the conversation.