
Today, we take first steps towards our goal: creating a custom weather map with real time weather station observations.
Whenever I approach an API I haven’t used before, I start by testing the most simple of responses. What do I get back in the browser when I try to connect? This is a nice way to investigate data structure before worrying about any authentication steps. Let’s try it.
Go to https://www.weather.gov/documentation/services-web-api and hit the Specification tab.
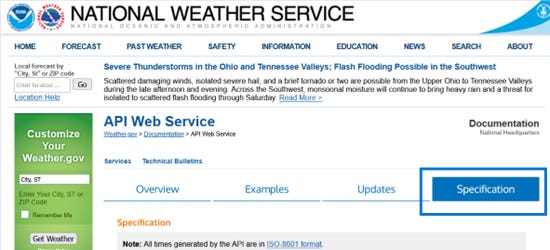
The blue boxes show the GET requests, or endpoints, from the API. I’m really interested in the weather station locations in San Diego County, and ultimately the real-time weather observations of those stations. It looks like to get the latest weather observations for a station, I need to know the stationID.

It also looks like I can get the station information by zone, and for that I need the zoneID.

I’m going to focus my weather app in San Diego County, so I’m first looking for the zoneID for this area. You could download a shapefile of the national weather zones, but I found my zoneID most easily by searching “nws san diego forecast zone” in a search engine and winding up at this URL as the first search result: https://forecast.weather.gov/MapClick.php?zoneid=CAZ043
The zoneID I want is right there in the URL: CAZ043
However, this is just for the most coastal zone, and there are a few zones that comprise San Diego County. You can find additional zones by clicking on the map on the right of the page, and then More Local Wx on the subsequent page. This process allowed me to find two more inland zoneIDs: CAZ050 and CAZ058.


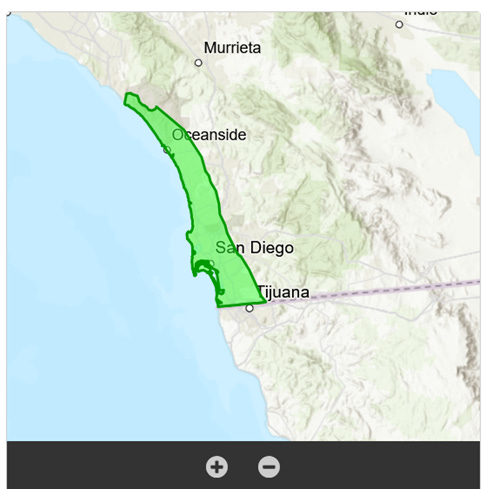

You could otherwise use https://www.weather.gov/gis/publiczones to find zones using a shapefile.
I now have 3 forecast zones for which I want the weather station data: CAZ043, CAZ050, CAZ058. Time to turn to the API.
Expand the stations endpoint, and click Try it out.
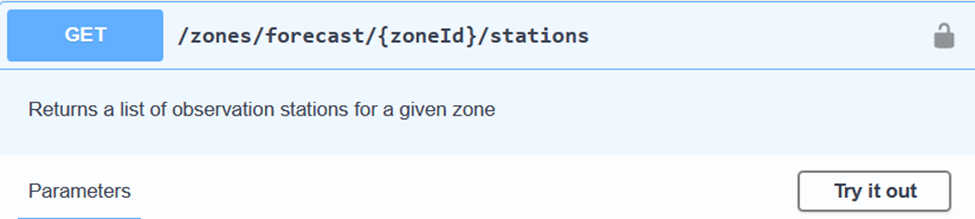
2. Put the zone in the zoneID box and hit Execute.

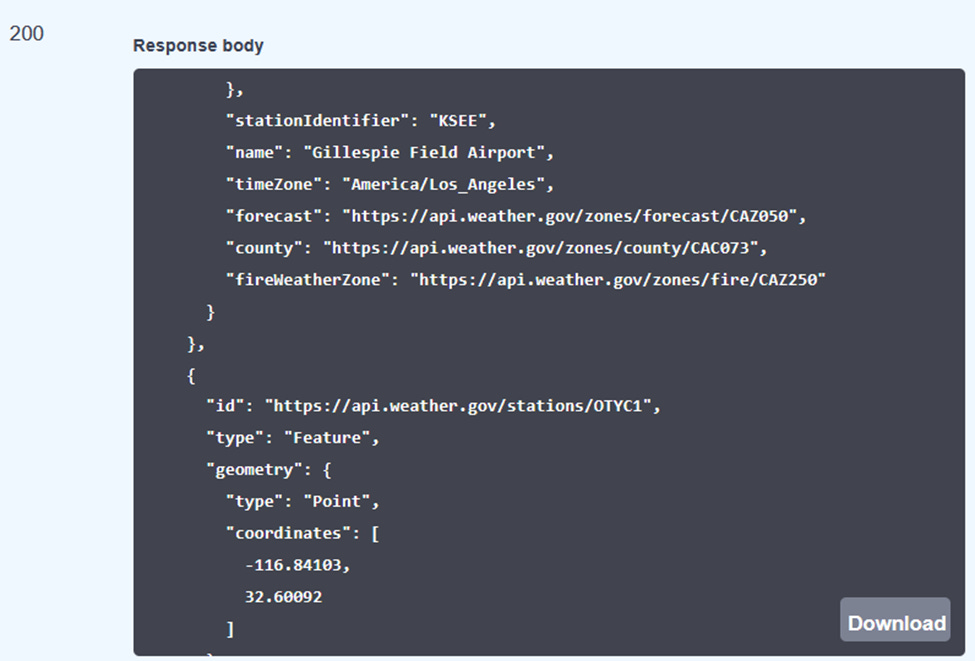
Scrolling down in the response body, you’ll see station fields including coordinates, elevation, names, time zones, and fire weather zones. Towards the end of the response, you’ll see a list of all the weather station URLs in the zone:
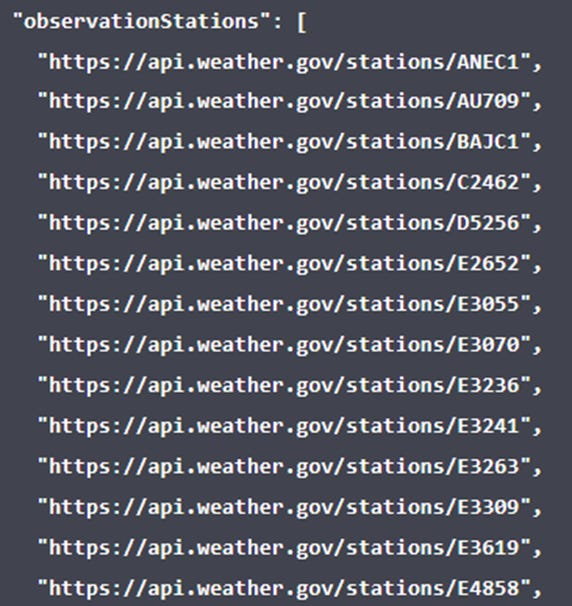
Try taking the request URL and pasting it into your browser. Does the same JSON response show up?

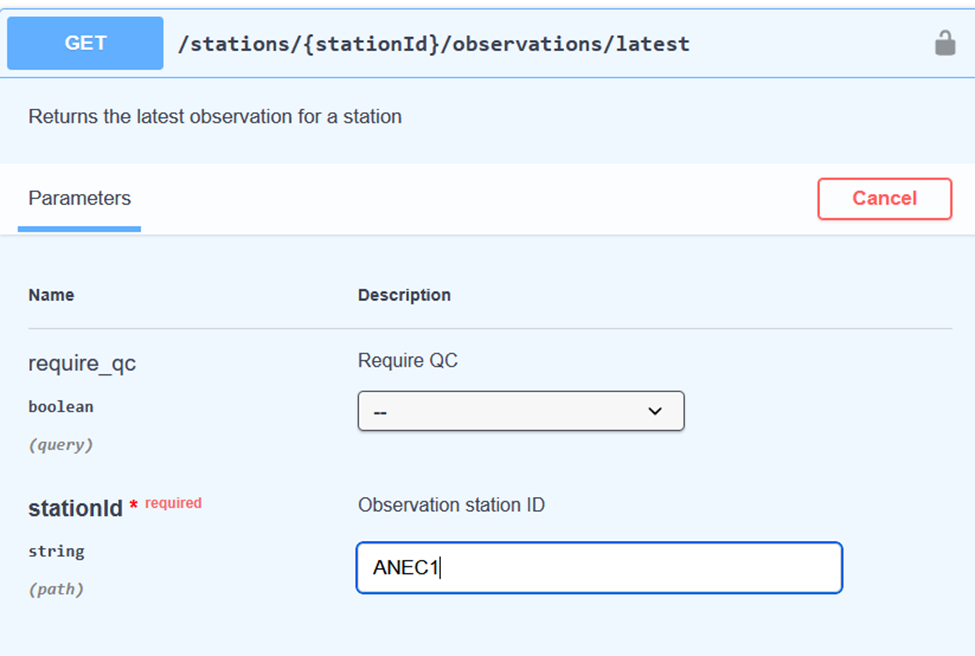
We know now that we can isolate a group of weather stations by zone. Let’s see what gets returned when we take one of those weather station codes and and put it in the latest observations endpoint. I’ll use my first returned station, ANEC1.
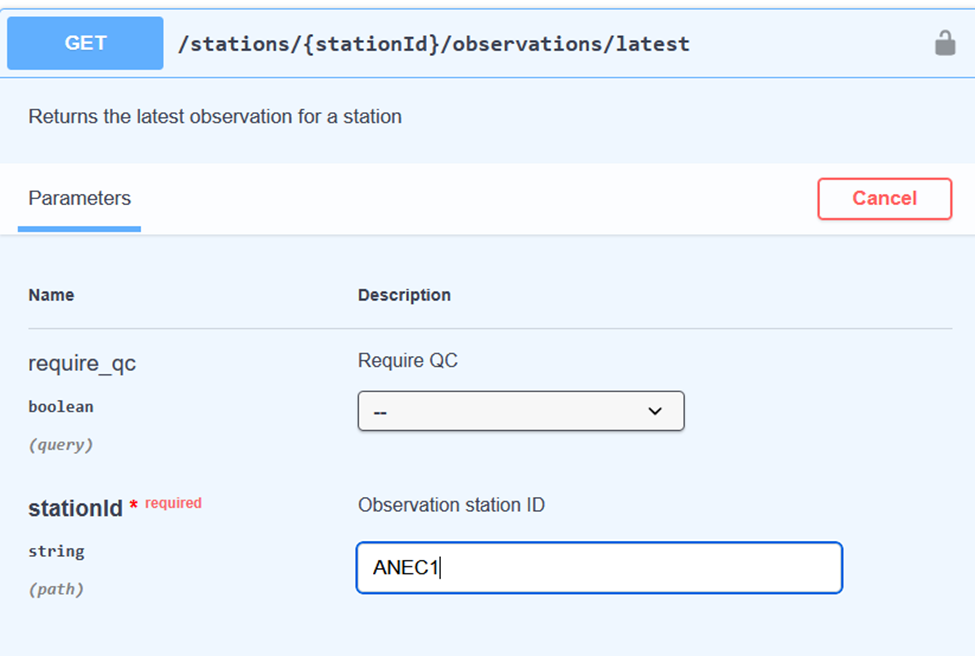
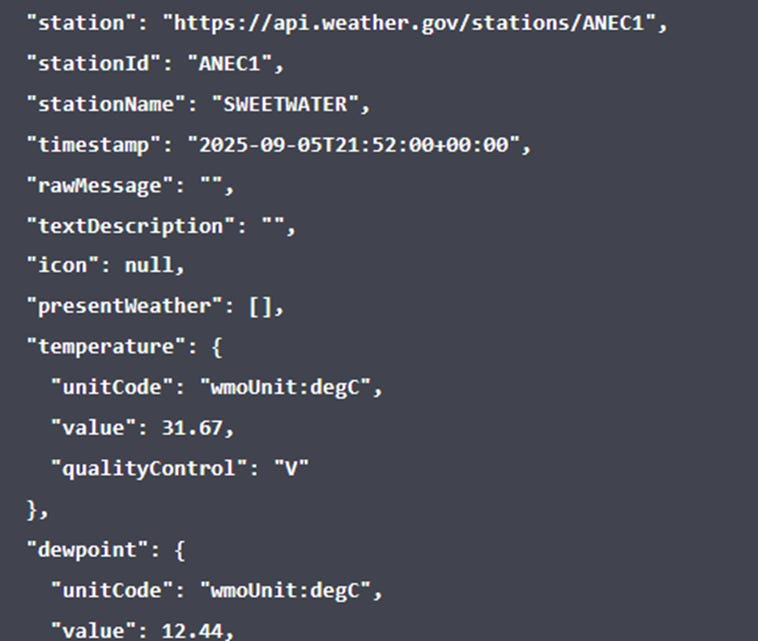
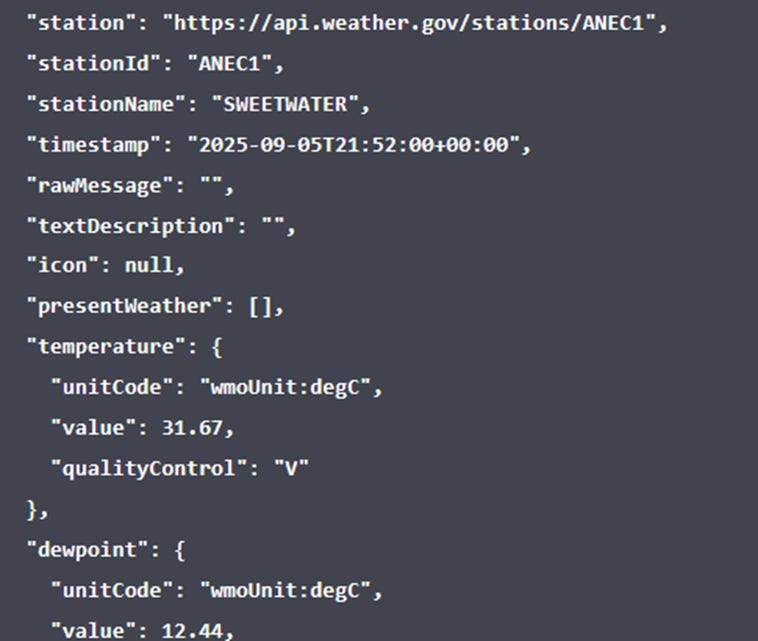
Well, well, looks like it’s pretty hot there, 31.67 degrees Celsius.
Other variables returned are dewpoint, wind direction, wind speed, wind gust, barometric pressure, relative humidity, and beyond, although not all of these have data returned with the fields.
For fun, I’ll take the Request URL and paste it in the browser to see if data are still returned there. They are!
One peculiarity I’ve noticed is that the latitude and longitude of the stations in the observations endpoint are returned truncated (only 2 decimal places) compared to the coordinates returned from the stations endpoint. Now, that simply won’t do! I want the most precise coordinates available (with the hope that they are most accurate) for this weather map, so I’ll want to fetch the weather station coordinates from the stations endpoint.
Very nicely, the response from this endpoint is geoJSON, which will play so well with our map down the line. We’ll conclude this section by downloading the geoJSON for the stations you want for your map. I have 3 zoneIDs, so I will download 3 files.
Back under the stations endpoint, paste your zones individually, then download each response body.

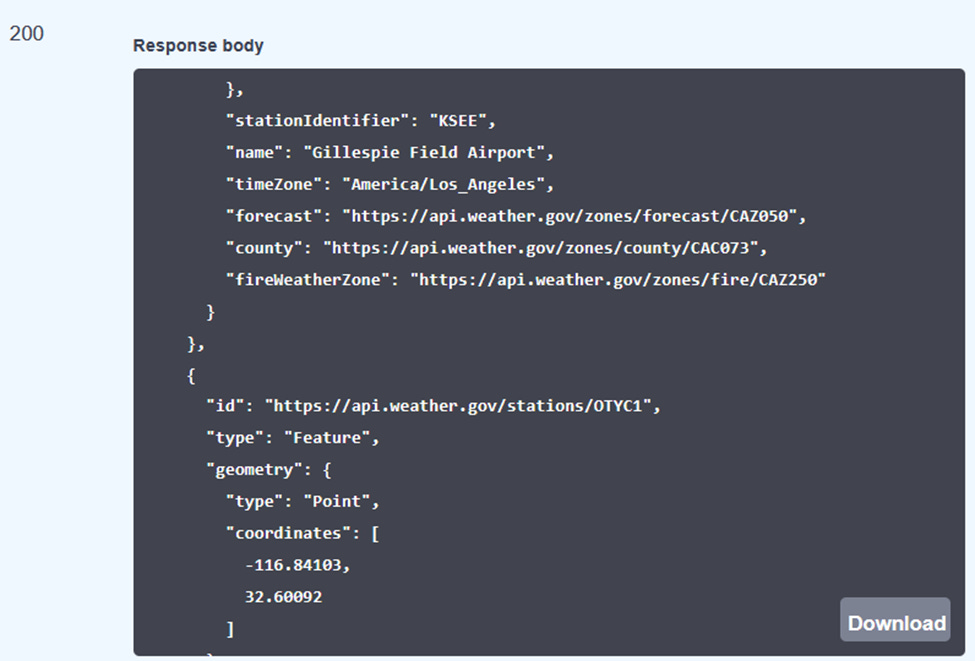

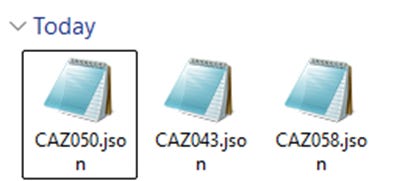
Rename your json files according to the zoneID.
For a quick rendering of geoJSON, I like to use
Go to the URL, open one of your JSON files, copy the text, and paste it in the JSON box, deleting the text that was in there before.


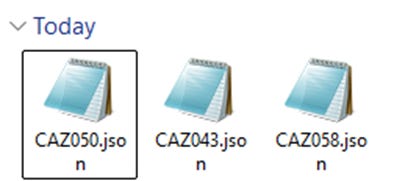
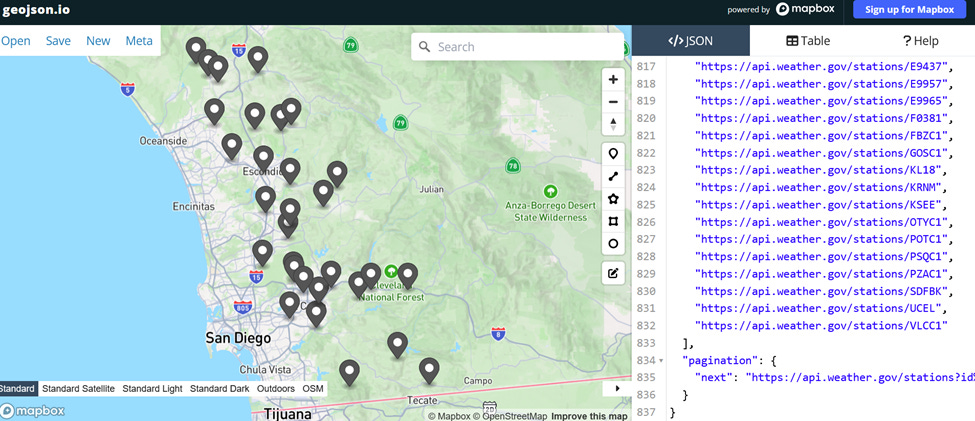
This should plot your points on the map! Click on one of the points, and it will bring up the fields.
This is a simple way to check for errors in your geoJSON.
Save your geoJSON files for the next part of the tutorial.
No posts
Comments
Nothing yet. Say the first thing.
Sign in to join the conversation.