
Part 1 of 2. Based on the ESIG Large Loads Task Force reports “Large Load Disturbance Events” and “Large Load Modeling for Dynamic Studies” (2026).
The subject of part 2: The Interconnection Gauntlet.
On August 14, 2003, a cascading outage tore through the northeastern United States and Canada, leaving 55 million people without power. The post-mortem revealed a devastating paradox: the very protection systems designed to save individual generators had collectively destroyed the grid. Relay after relay tripped generators offline to shield them from frequency swings, each trip deepening the crisis until the entire system collapsed.
The industry’s response was unequivocal. New standards mandated coordination between generator and transmission protection settings. Ride-through requirements became non-negotiable. The principle was simple: individual self-preservation cannot come at the cost of collective system survival.
Two decades later, we face the same problem — but from the other side of the meter.
The Energy Systems Integration Group (ESIG) has released a landmark set of reports from its Large Loads Task Force, and the picture they paint is sobering. Across North America and Europe, large electronic loads — data centers, cryptocurrency mining facilities, hydrogen electrolysers, advanced manufacturing — are doing precisely what generators did in 2003: tripping offline during routine grid disturbances, amplifying the events they should be riding through, and in some cases actively injecting oscillations into the transmission system.
The scale is no longer hypothetical. In one event in Northern Virginia, approximately 1,500 MW of data center load disconnected from the grid during a normally cleared transmission fault. That is equivalent to losing a large nuclear power station — except instead of generation disappearing, it was demand, causing frequency to spike and voltages to surge above emergency limits. And that load did not come back for hours.
This article examines what happened, and then asks the question the events force upon us: how did the interconnection studies not see this coming? The answer, as Section 4 shows, is that the models the industry relies on were built for a load landscape that no longer exists. A companion article, The Interconnection Gauntlet, takes up the institutional half of the problem — the processes and standards that allowed these facilities to connect without ever being asked to prove they could ride through a fault.
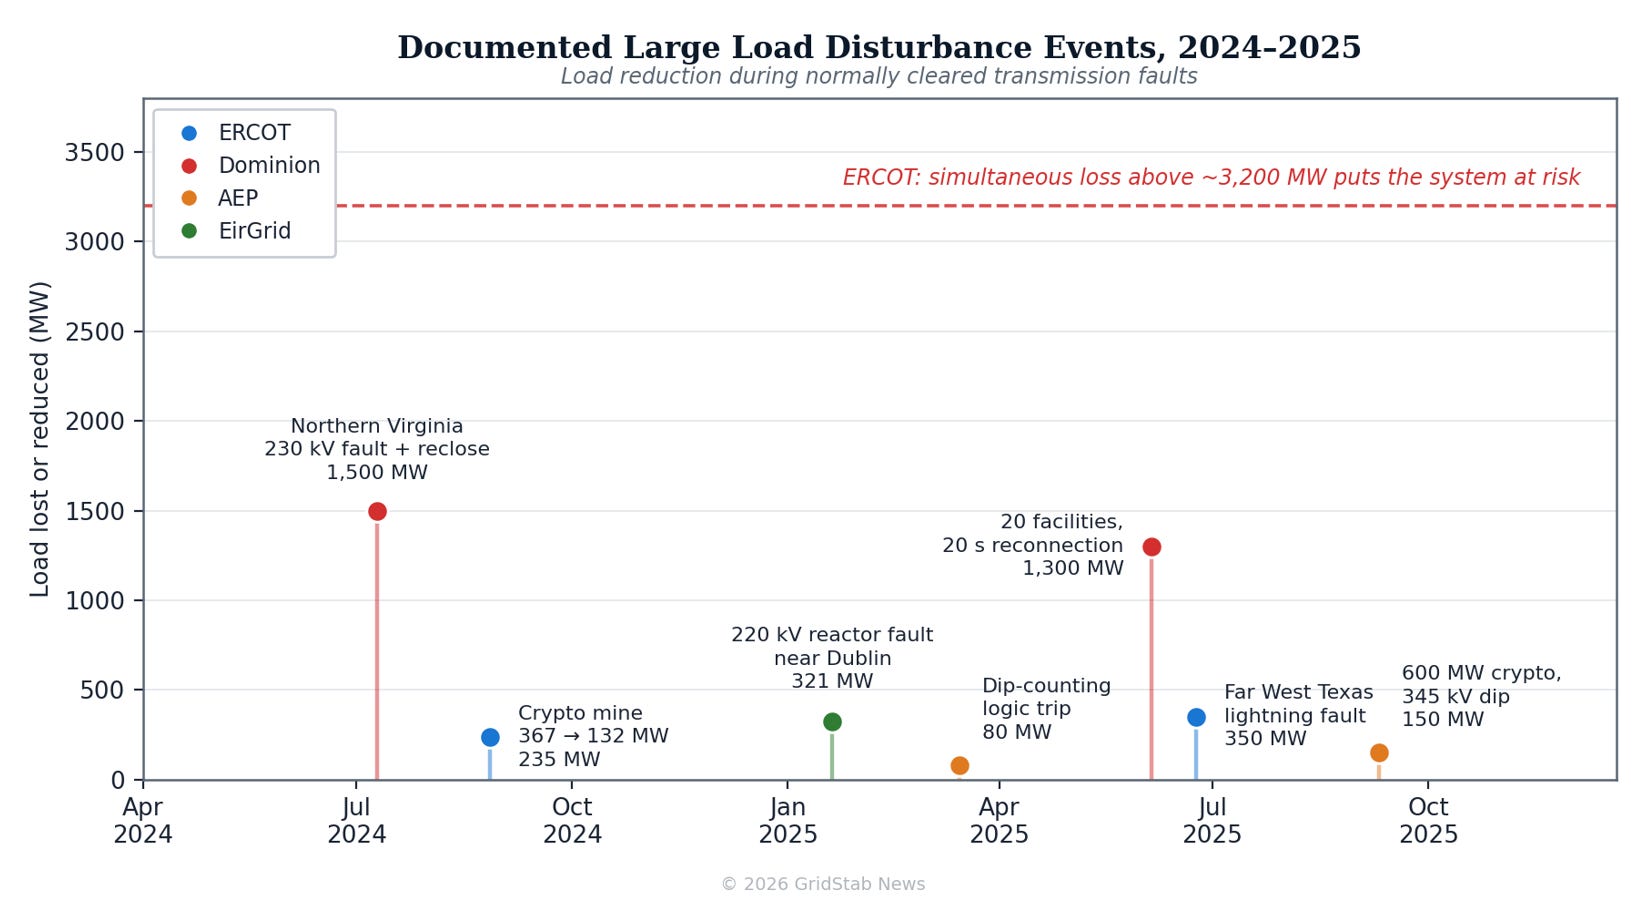
Figure 1. Documented large load disturbance events across four grid operators. Every one of these was triggered by a normally cleared transmission fault — the kind of event the grid handles daily. The dashed line marks ERCOT’s estimated systemic risk threshold. Compiled from ESIG (2026).
The ESIG Disturbance Events report catalogues ride-through failures across four major grid operators. The common thread is striking: in every case, normally cleared transmission faults triggered load reductions or complete disconnections measured in hundreds of megawatts.
Since 2023, ERCOT has documented dozens of events where large electronic loads and other large loads such as oil and gas facilities suddenly dropped their electricity consumption in response to normal voltage disturbances. Most were triggered by single line-to-ground faults — the most common type of transmission fault — that caused relatively shallow positive-sequence voltage dips.
The numbers are alarming. In one event on August 27, 2024, a three-phase-to-ground fault on a 138 kV line — cleared in just three cycles — caused a cryptocurrency mining facility to reduce its consumption from 367 MW to 132 MW, a 64% load reduction. The voltage had dropped to 0.4 pu for approximately 30–40 milliseconds. In a separate event in Far West Texas on June 24, 2025, a lightning-induced fault led to 184 MW of consequential and 166 MW of non-consequential load loss across oil and gas facilities and cryptocurrency miners, pushing system frequency to 60.06 Hz.
These are not isolated incidents. ERCOT’s data shows that crypto mining facilities consistently trip or reduce consumption when voltage sags reach approximately 0.7 pu at the service delivery point. And the variance in load reduction for similar voltage dips is enormous, suggesting that facility-specific design choices — not inherent physics — determine whether a load rides through or trips.
The systemic risk is unmistakable. ERCOT has estimated that if it lost more than approximately 3,200 MW of demand simultaneously, the system would be at risk of failure. Given that individual events are already reaching 400–900 MW of aggregate load loss, and that multiple data centers could respond to the same fault simultaneously, the margin is uncomfortably thin.
The most striking event in the ESIG report occurred in Dominion Energy’s Northern Virginia service territory — the world’s largest concentration of data center capacity, with over 450 facilities served by Dominion Virginia Power.
On July 10, 2024, a lightning arrestor failure on a 230 kV transmission line caused a permanent fault. The protection scheme attempted three auto-reclose operations at each end of the line, producing six successive system faults over 82 seconds. The transmission protection operated exactly as designed. But approximately 1,500 MW of data center load disconnected from the grid and transferred to backup generation. The event affected roughly 4 square miles across 22 substations, with the most distant substation located 32 transmission line miles from the fault.
The consequences rippled across the system. The sudden loss of 1,500 MW of demand caused frequency to spike to 60.047 Hz and drove voltage levels above emergency limits. Operators had to switch out nine 230 kV capacitor banks within seven minutes to restore voltage to normal levels. The data center load did not return to the grid for over three hours.
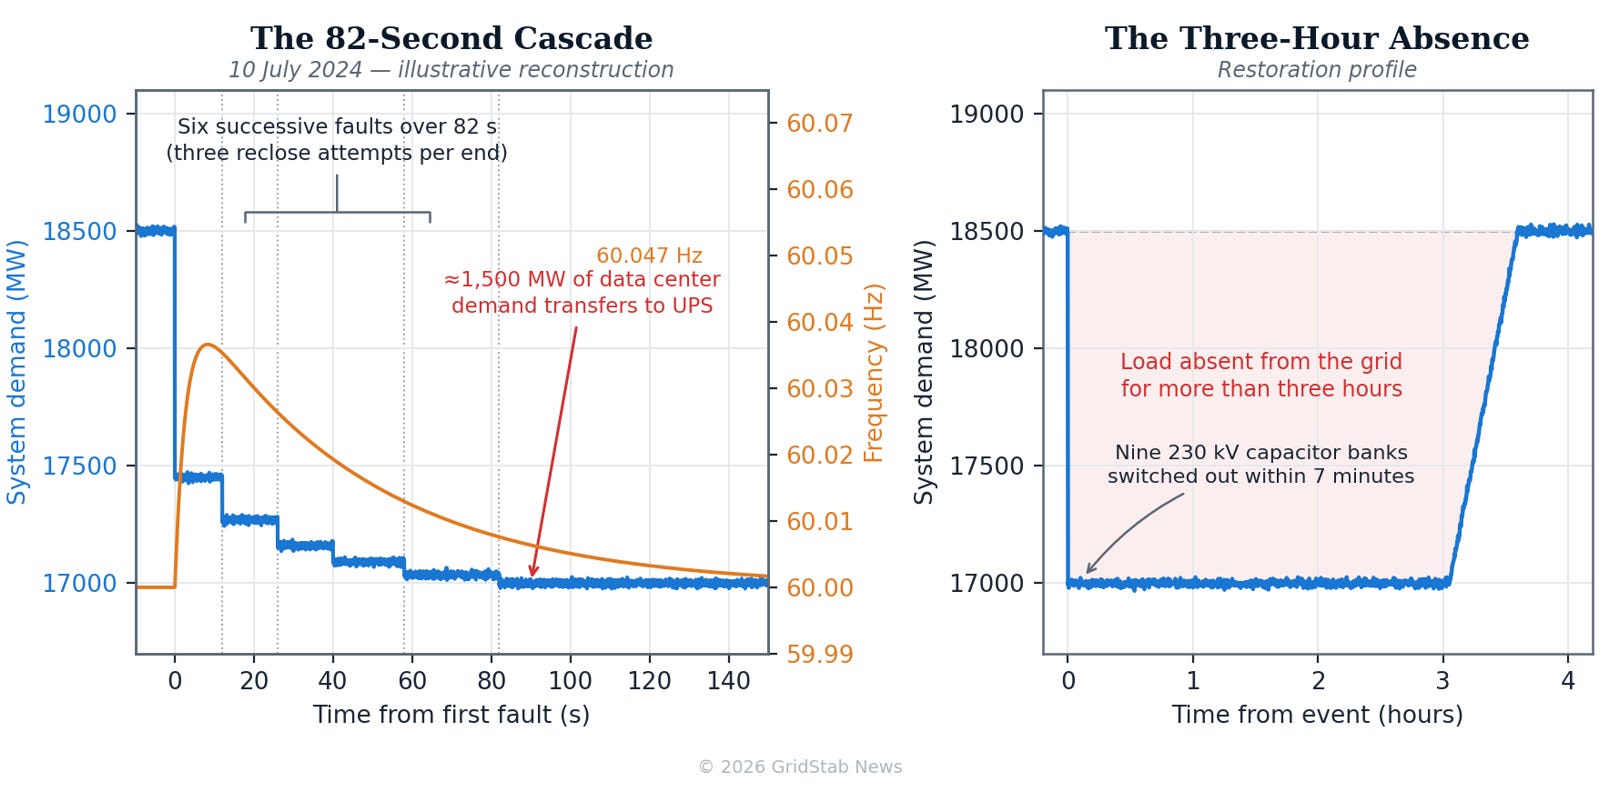
Figure 2. The July 2024 Dominion event. Six successive faults over 82 seconds, an instantaneous transfer of roughly 1,500 MW of demand to on-site UPS, a frequency excursion to 60.047 Hz, and a three-hour absence from the grid. Illustrative reconstruction from values reported in ESIG (2026) and NERC (2025).
Since that event, Dominion has experienced five similar load transfer incidents, all in Northern Virginia. The most recent, in June 2025, saw 1,300 MW across 20 facilities instantaneously transfer to their UPS systems — though in this case they reconnected after 20 seconds, suggesting that some operators are learning and adapting. Recovery profiles vary dramatically: full transfer to backup, momentary reduction followed by recovery, intermittent recovery during reclosing attempts, and — encouragingly — complete ride-through with no load loss.
This variation is itself a critical finding. It demonstrates that ride-through capability is fundamentally a design choice, not a physical limitation. The facilities that ride through have been engineered to do so.
—— YOU ARE 30% INTO THIS ARTICLE ——
What follows behind the paywall:
So far, you’ve seen the headline evidence: data centers and large electronic loads are already causing grid disturbances measured in hundreds — and in one case 1,500 — megawatts. But ride-through failures are only half the story. The remaining 70% of this article covers:
• The AEP and EirGrid events — how dip-counting protection logic trips data centers during routine auto-reclose sequences, and why 321 MW of loss on Ireland’s 7.5 GW island system is a direct threat to system survival (Section 2.3).
• Load-triggered oscillations — the ERCOT 23 Hz event, the Dominion Energy 14.7 Hz data center oscillation, and why these phenomena sit squarely in the frequency band that excites torsional modes in nearby turbine-generator shafts (Section 3, with a frequency-band and measurement-coverage diagram).
• Why the studies missed all of it — the composite load model was built for induction motors, not UPS-dominated data centers. Two ESIG case studies show how simplified models completely miss critical instabilities, including a sustained oscillation driven by UPS–series-capacitor interaction that appears only in detailed EMT modelling (Section 4, with side-by-side simulation comparison).
• Key takeaways and what this means for the interconnection process (Section 5).
Subscribe to GridStab News to unlock the full article and all future technical deep dives.
Comments
Nothing yet. Say the first thing.
Sign in to join the conversation.