
Everyone loves a good anti-establishment story. The idea that all of those smarmy experts have been wrong all along is wonderfully compelling. There’s a sense of self-righteous indignation that you can only get for disagreeing with established wisdom for no reason at all only to be proven right years later. It’s why Joe Rogan’s podcast is so popular, even though at least 90% of the things said on it are some combination of nonsensical gibberish and outright lies.
For a long time, the expert consensus has been that we should probably eat less saturated fat to improve our heart health. One way to do this is to reduce your intake of full-fat dairy by drinking skim milk and choosing other low-fat options. This has been contentious, although it’s generally held up pretty well in scientific studies as a decent idea.
A recent study, however, may have overturned the consensus. Scientists have apparently shown that full-fat dairy has no negative impacts on heart health in a brand new randomized trial, the strongest form of research. The dietary guidelines were always wrong, and the contrarians were right!
Except, well, that’s not true at all. The reality is that the study had major issues, was substantially under-powered, and if anything showed that full-fat was worse for your health than skim. It was also funded by the Dairy Farmers of Canada, which wasn’t mentioned much in the media reporting.
The newest paper was a trial where participants—overweight and obese Canadians aged 25-60—were randomly allocated to receive one of three interventions. The first group got given three servings of full-fat dairy products—yoghurt, cheese, and milk—per day for 3 months and were told to eat as much as they wanted. The second group got the same dairy products, but were counselled by a dietician to reduce their food intake a bit to account for the additional dairy. The final group were given no dairy, and were instead told by a dietician that they should reduce their food intake and only eat low-fat dairy where possible.
The researchers managed to recruit 107 people into their study, but only 74 completed it. They followed those people up for 3 months. At the end of the study period, they compared these participants on how much they weighed, as well as a wide range of dietary and other health outcomes.
The first issue with the reporting of the study is very obvious. The researchers pre-registered weight as their main outcome—this was the thing that they thought would be the most important when looking at dairy consumption and health. It’s the key outcome that usually they’d use to see if the interventions had a benefit or not.
And, it turns out, there was a benefit here. Specifically, people in the low-fat diet group lost about 1kg (~2lb) more weight than the other two groups over the course of the study. They also saw some modest improvements in waist circumference and BMI compared to the other groups. There were no other statistically significant differences between the groups across dozens of secondary outcomes including cholesterol, blood sugars, etc.
The authors have interpreted this in a truly bizarre way. Here’s the first paragraph from their discussion:
“The results support our hypothesis that adding 3 servings of full-fat dairy combined with counseling to follow the CFG would not adversely affect the blood biomarkers of chronic disease but would increase intake of limiting nutrients and decrease intake of food and beverages associated with chronic diseases.”
To be clear—the authors did not actually find that full-fat dairy had any impact on limiting nutrients or the intake of food and beverages associated with chronic diseases. The only thing that they found was that people in the dairy groups ate more dairy and had slightly more calories and calcium than those in the control. They also gained weight. In essence, the researchers proved that adding full-fat dairy to your diet increases your calcium intake and makes you a bit fatter.
The authors claim that their study shows that full-fat dairy does not adversely impact things like cholesterol, but there’s a huge problem there—attrition. The original study was designed to find an effect on body weight between the groups, and the researchers said that they’d need 153 people to find that effect. This would not guarantee us seeing any differences between other outcomes, like cholesterol, but it’d be at least enough to be reasonably sure that not finding an impact on body weight was meaningful.
But they only recruited 107 people into the study. Of those, 33 dropped out. The final analysis only looked at 74 people, which is less than half the required sample size that the researchers set out to get. In this sort of situation, a lack of any statistically significant finding is mostly meaningless—we cannot say that the lack of difference between the groups was due to the full-fat dairy being fine for cholesterol, it could just be that the study wasn’t big enough to notice the effect.
In addition, this was what’s called a per-protocol analysis. What this means is that the authors only included people in their study who completed the experiment. It is very rare to see this sort of study published these days, because per-protocol analyses are known to be extremely problematic. The gold standard is to include everyone who was randomized into the study—those 107 people—and use statistical methods to infer any missing data.
Worse still, the dropouts were not random. Nearly half of the control group dropped out of the study, compared to just one quarter of the intervention groups. This is probably because the intervention groups got given free food for three months and the control group got nothing.
At best, what this study shows is that full-fat dairy makes you put on a few kilograms and very little else. But there are some even more serious issues that are similar to papers that have previously been retracted.
This next bit is very much in the weeds. If you don’t care about numeric mistakes and serious data problems, you can skip down to the end.
Now we get to the really massive problems with the study. The first thing that I noticed is that the randomization the authors describe is impossible given the numbers. They say:
“Block randomization was per-formed prior to recruitment on SAS version 9.4 (SAS Institute Inc.) by the study dietitian to generate a random allocation sequence stratified by sex with a block size of 12.”
The way that block randomization works is that you create blocks with random sequences of the groups in them. Each block has the same numbers from each group, which is used to balance the numbers being randomized to each group overall—in pure randomization, you often end up with one group that is somewhat bigger than the others. With three groups (let’s call them A, B, and C) and a block size of 12, each block contains a sequence that looks a bit like this: AACABCABBCCB. At the end of each block, the groups are by design exactly the same size. Within each block, a group can at most be 4 bigger than the others, say if you had CCCCABABBBAA then A would be 4 smaller than C until you got to the fifth person in that block.
Stratification by sex means that the authors ran these blocks separately for men and women. This means that the maximum possible difference between two randomized groups is 8 people—if every person at the start of the male block was randomized to A, and the same for the female block, and then the study didn’t complete its randomization, you’d get an additional 8 people in group A compared to B and C.
But the study reports a bigger difference than this:
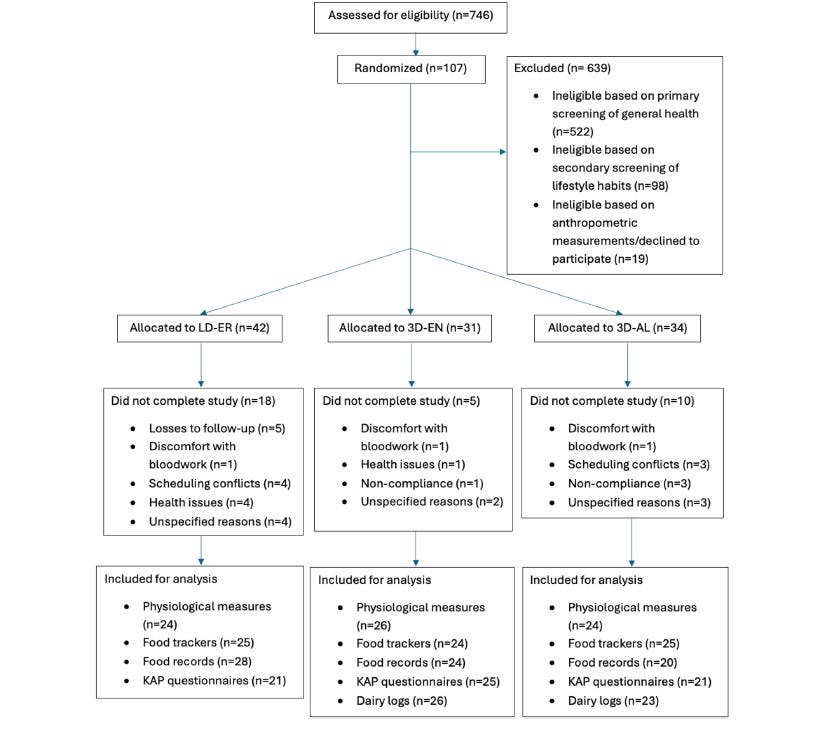
42-31 = 11. That’s bigger than 8, and therefore impossible. Either the randomization was done incorrectly, or the description is wrong, or both.
The study also keeps mixing up the sample size. LD-ER is the control, and the other two groups are the intervention groups. They report that 18 people did not complete the study in the LD-ER group, but 28 people had full food record data. Only 10 people did not complete in the 3D-AL group, but 14 people had missing data for their food records. So what does did not complete mean, and why is the sample size so different? The authors don’t explain this issue.
There are also mathematical errors in the paper. Here is table 7:
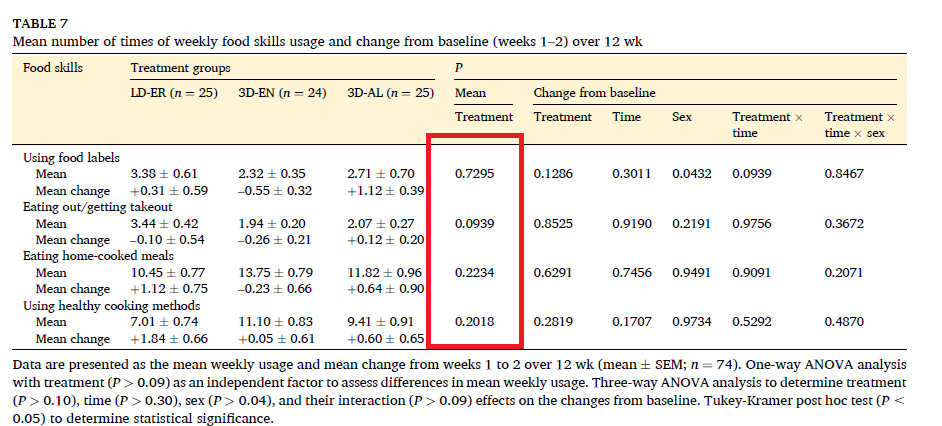
This is a very important table. It shows healthy eating behaviours measured at baseline between the groups. If the groups were very different in their reported baseline healthy eating behaviours—if the control group, for example, got takeout more than the other two groups—it would mess up pretty much all the study’s conclusions.
The p-values, fortunately for the authors, are not statistically significant. So there are no differences between these groups on their baseline healthy eating behaviours. Except, we can recalculate these p-values using a one-way ANOVA, and they are wrong. I used the aovsum command in Stata to check this—the correct p-values are 0.42, 0.0016, 0.0036, and 0.025. At baseline, the control group ate significantly more takeout, had fewer home-cooked meals, and used fewer healthy cooking methods than the intervention groups. And they still lost more weight. That’s a massive issue which largely if not entirely invalidates the study.
There are also a bunch of copy-paste errors in the paper. You can see it in the table above—the p-value 0.0939 appears twice for two completely different analyses. It is incredibly unlikely to have two identical p-values to four decimal places for different analyses in one table, making this quite likely to just be a case of someone accidentally copy+pasting the wrong value into a cell.
There are other mathematical impossibilities. Take Table 9:
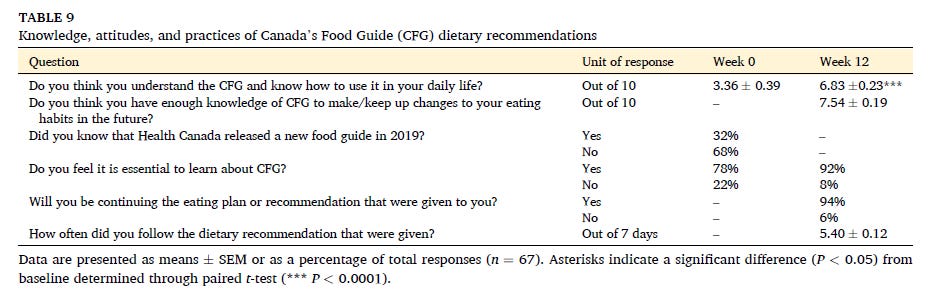
Do you see the problem? Have a look at the total number of responses and then look at the percentages. You can’t have 32% of 67 people—21/67=0.313… and 22/67=0.328… This either rounds to 31% or 33%. This is a mistake. Most likely it’s another symptom of the authors not knowing their sample size.
The mean values are also impossible. You can’t have a mean of 6.83 for a questionnaire with integer values and 67 participants. 6.82 or 6.84 work, but not 6.83. It’s a bad sign when people have tables full of impossible values.
Let’s do one final problem. Look at this snippet from Table 6 of the paper:
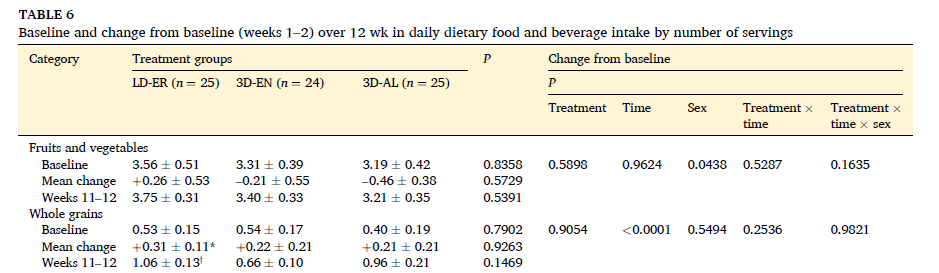
Have a look at the baseline and weeks 11-12 mean values. Now look at the mean change scores. Do you see the problem?
Again, this is bizarre. The mean change does not match the baseline and final scores. For example, the LD-ER group went from 0.53 to 1.06 serves per day of whole grains. That’s an increase of 0.53 But the authors report this as a change of just 0.31 serves. In some cases—such as for fruits and vegetables in the 3D-EN group—the change is in entirely the wrong direction. Oddly enough, the p-values appear to be correct this time, which implies that either the baseline or final values are wrong.
There are other issues in this paper, but you have to stop with these things somewhere. We’re already at 2,000 words and half of you have probably already stopped reading. Suffice to say that it’s extremely borked and I would not trust any of the results in their current form.
It is hard to see how this paper got published. The authors state in their conclusion:
“We found that consuming 3 daily servings of full-fat dairy did not lead to increases in weight, body fat, HbA1c, BG or lipids when compared with an energy-restricted diet with low dairy consumption.”
That’s straightforwardly false. They found that eating more full-fat dairy makes you gain a bit of weight. Not a huge amount, perhaps, but given the massive issues with the study it’s enough to make it a bad idea to drink full-fat dairy if your aim is to lose weight.
Why did the authors put such a positive spin on such a negative, problematic study? We will never know for sure. But it is worth noting that industry-funded studies are well-known to have skewed reporting, and this paper was indeed funded by industry.
As this study—and all of the previous literature—has shown, full-fat dairy is a bit worse for your health than low-fat options. The dietary guidelines were, and are, right. Full-fat is not going to kill you, but if you want to lose weight and lower your cholesterol, low-fat is probably the best way to go.
Comments
Nothing yet. Say the first thing.
Sign in to join the conversation.