
For the first time since spot Bitcoin ETFs launched in January 2024, institutional capital didn't buy the dip: it sold into it. Over 13 consecutive trading sessions in May and June 2026, $4.4 billion left US spot Bitcoin ETFs, the longest outflow streak on record. At the same time, Strategy, the largest corporate Bitcoin holder in the world, sold Bitcoin for the first time since 2022. The central question both events raise is the same: how durable is institutional Bitcoin demand when macro conditions deteriorate and competing risk assets are outperforming?
Spot Bitcoin ETFs recorded 13 consecutive trading sessions of net outflows from May 15 through June 3, totalling $4.4 billion and 59,351 BTC according to Galaxy Research, records in both measures. But the headline figure obscures something more important: where the money left from.
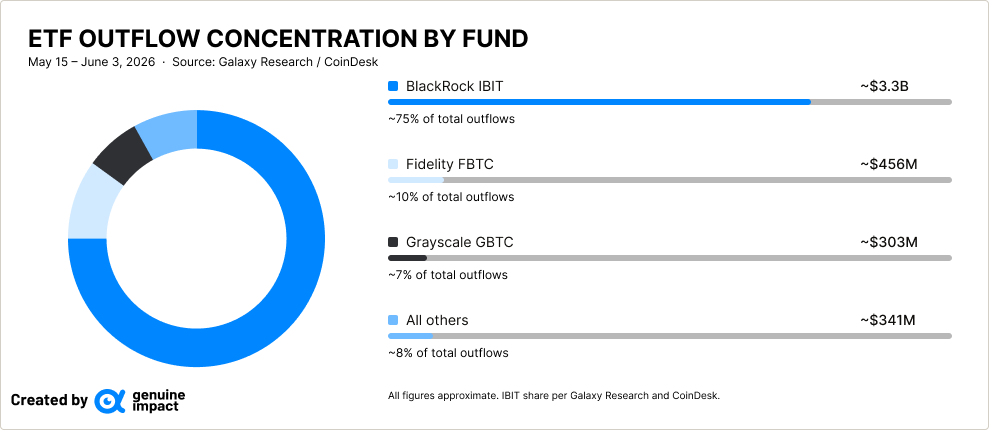
Roughly 75% of all outflows approximately $3.3 billion, came from a single fund: BlackRock’s IBIT. That is not the ETF most associated with retail access. It is the ETF most associated with institutional adoption, the one that drew pension funds, endowments, and sovereign wealth-adjacent vehicles into Bitcoin for the first time, as Q1 2026 13F filings showed. When IBIT leads outflows at that scale, it is not a retail rotation. It is institutional money moving.
ETF flows aren’t just a sentiment indicator. Analysts at Citi, one of the world’s largest banks, estimate they may explain roughly 45% of weekly Bitcoin price moves.
The outflows also built in stages rather than arriving in a single shock. Moderate in the first week, accelerating sharply through late May, then intensifying further into early June. Two of the three heaviest sessions came in the final stretch: June 1 at $483.8 million and June 2 at $519.1 million. Selling that deepens rather than fades points to overlapping waves of separate allocation decisions, not a single event playing out.
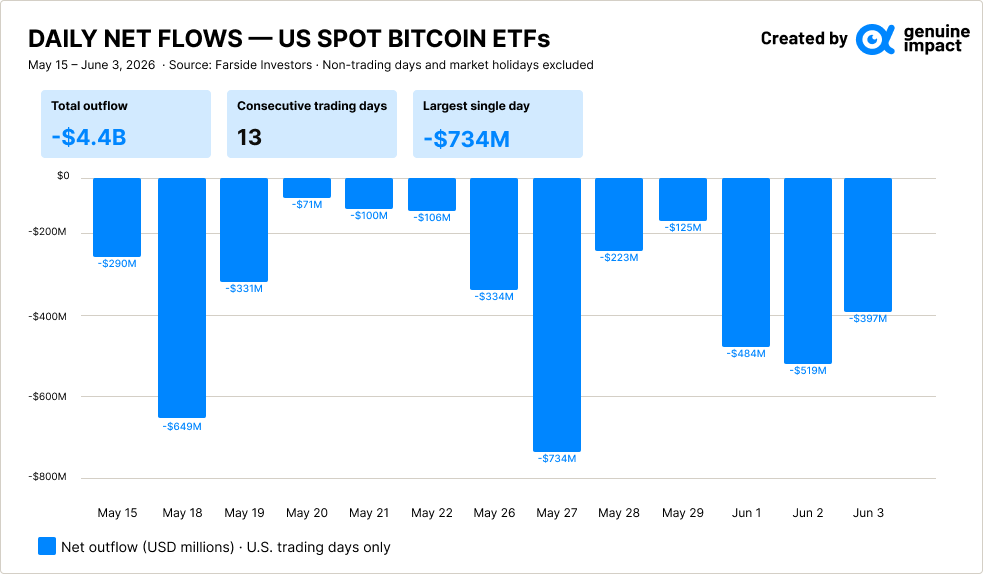
Galaxy Research noted that the trailing 7-day, 10-day, and 20-day outflow windows each set all-time records during the streak, with the 20-day window reaching $5.42 billion and 73,080 BTC. Total ETF assets fell from $104.29 billion on May 15 to $82.83 billion by June 3, a $21.46 billion decline combining redemptions with Bitcoin's roughly 21% price drop.
The counterargument is worth stating. Bitcoin ran from the low-$60,000s to above $80,000 between February and May 2026. Outflows following that move are consistent with profit-taking after a strong rally, not necessarily a structural change in institutional appetite. Cumulative lifetime net inflows still exceed $55 billion. Under that reading, the streak reflects position trimming at elevated prices rather than a reassessment of Bitcoin's role in institutional portfolios. Q2 13F filings, due later this year, will provide the clearest evidence of which interpretation is correct.
On June 1, 2026, Strategy filed a Form 8-K disclosing it had sold 32 BTC between May 26 and May 31, generating approximately $2.5 million at an average price of roughly $77,135 per coin. The proceeds funded a preferred stock distribution. At 0.004% of total holdings, the sale had no material impact on the company’s Bitcoin exposure.
Three details in the filing matter. The sale was executed above Strategy’s average cost basis of $75,699. No loss was taken. The company holds a $900 million cash reserve established in December 2025 specifically to service preferred dividends and debt obligations without touching Bitcoin. The reserve exists so that situations like this one don’t require a Bitcoin sale. The fact that it happened anyway is what the market reacted to.
Strategy’s shares fell nearly 6% on the disclosure. That wasn’t a response to financial distress. What changed was the market’s assessment of one assumption it had treated as fixed: that Strategy would never sell Bitcoin. The 8-K showed that assumption was conditional, not contractual. The $900 million reserve provides a buffer, but it is finite. One transaction is not a policy shift. It is the first data point in a sequence that previously had none.

Bitcoin peaked at roughly $82,000 on May 14, 2026, the day before the outflow streak began. Three macro developments converged in the weeks that followed. US inflation data came in above expectations, pushing back market pricing for Federal Reserve rate cuts and keeping real yields elevated. Geopolitical tensions between the US and Iran intensified in late May, prompting institutions to reduce exposure to risk assets broadly. And equity markets, the S&P 500 and Nasdaq, continued climbing through the same period that Bitcoin fell, with AI and semiconductor stocks driving gains.
That last point is the most relevant to the ETF data. On the days Bitcoin fell most sharply, equity markets were reaching new highs. Capital was not moving to cash. It was moving to assets with visible earnings growth, a category Bitcoin does not belong to. According to Investing.com, the macro environment as of June 3 had led institutions to shift funds toward AI and semiconductor stocks, diverting capital from crypto. The ETF outflows are consistent with that rotation: not a rejection of risk, but a reallocation within it toward assets with cleaner near-term return profiles.
The convergence of these pressures, including delayed rate cuts, geopolitical risk, equity outperformance, ETF redemptions, and the Strategy filing, created a self-reinforcing sequence in which each element reduced the pool of buyers available to absorb the next wave of selling. No single factor was decisive. The combination was.
A single positive session is not the signal. Watch for multiple consecutive inflow days the kind of sustained reversal that indicates allocators are returning, not just short covering at a technical level.
Watch Q3 2026 filings. If accumulation resumes at the pace seen through 2024 and 2025, the June 1 sale reads as a one-off. If further sales appear, the assumption of permanent accumulation requires a formal reassessment.
Watch whether Bitcoin begins outperforming AI-linked equities on a relative basis during periods of broad risk-on sentiment. That would be the clearest evidence that institutional capital is rotating back rather than simply staying put.
The streak ended June 4 with a $3.2 million net inflow, small enough to confirm the run was over without signalling a strong reversal. Cumulative lifetime net inflows still exceed $55 billion. The streak gave back a fraction of two years of capital formation. It did not undo the structural position.
What it did reveal is worth being precise about. The ETF outflows removed consistent buying pressure that had been present since January 2024. The Strategy filing removed a different kind of support: the market’s assumption that the largest corporate Bitcoin holder would step in under any conditions. Neither event alone was decisive. Together they exposed the same vulnerability: institutional Bitcoin demand is real, but it is not unconditional.
The question facing Bitcoin is no longer whether institutions can buy it. The ETF era settled that. The question is whether they will keep buying when macro conditions deteriorate, rate cuts are delayed, and equities with visible earnings are outperforming. The 13-session streak did not answer that question. It raised it, with $4.4 billion worth of evidence that it deserves to be taken seriously.
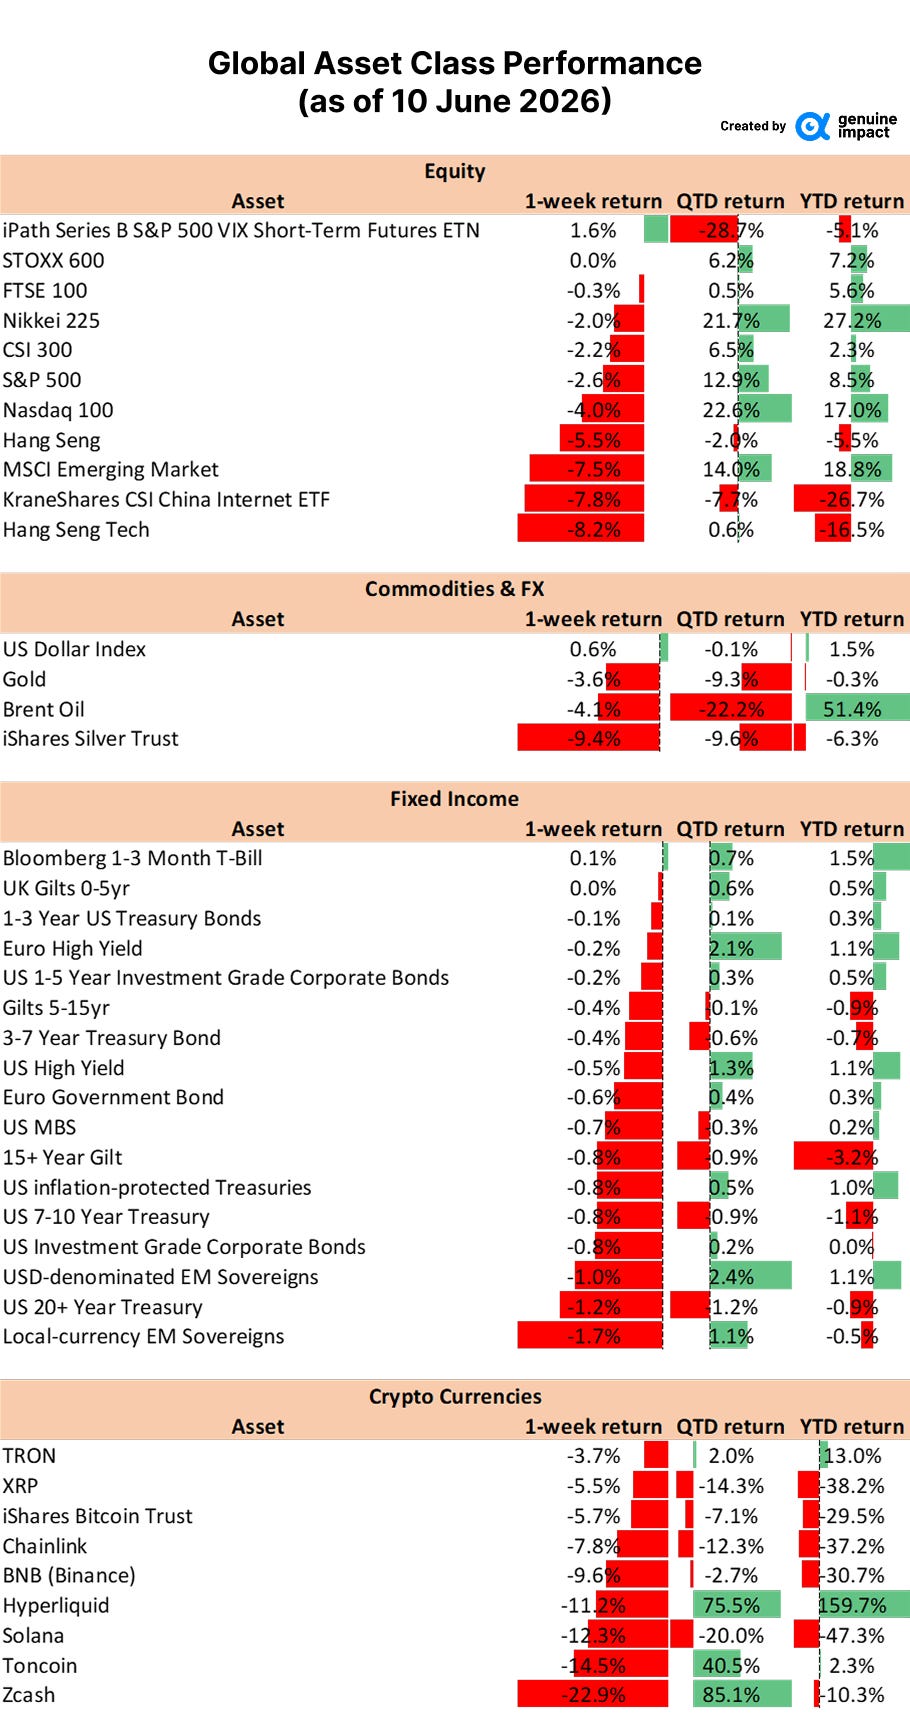
Global markets turned risk-off this week, with selling that ran across equities, crypto, and commodities. Among developed markets US tech led the declines, with the Nasdaq 100 off 4.0% and the S&P 500 down 2.6%, but the sharpest falls were in Chinese and Hong Kong equities, where the Hang Seng dropped 5.5% and Hang Seng Tech slid 8.2%. Broader emerging markets fell 7.5%. Europe held up best, with the STOXX 600 roughly flat and the FTSE 100 down just 0.3%.
The bigger story was crypto. Bitcoin fell 5.7%, but the damage ran far deeper across the asset class, with Solana down 12.3%, Toncoin off 14.5%, and Zcash sliding 22.9% on the week. Commodities gave no shelter either: gold fell 3.6%, silver dropped 9.4%, and Brent crude slipped 4.1%. Fixed income drifted modestly lower, leaving the US dollar, up 0.6%, and volatility as the only real gainers.
‼️ Almost nothing was spared this week as risk assets sold off in tandem. The real question is where the portfolio held firm and where it gave back.
How the portfolio navigated the sell-off, with full holdings and performance, below ⬇️
Comments
Nothing yet. Say the first thing.
Sign in to join the conversation.