
Every coach looks at the scoreboard.
Most of us look at the box score, too. How many yards did we rush for? How many did we throw for? How many first downs did we have? How many turnovers?
Those numbers matter.
But when I go back and evaluate a game, I want to know more than how many yards we gained. I want to know why the game went the way it did.
Did we stay ahead of the chains?
Did we give up too many explosive plays?
How many times did we move backward?
How many tackles did we miss?
Did we continually hurt ourselves before the ball was even snapped?
Did we lose 50 yards of field position simply because we wouldn’t catch a punt?
Those are the kinds of numbers that can actually help us coach our team the following week.
There is research behind some of this. Football analytics work has consistently identified efficiency, explosiveness, field position and finishing drives as important factors associated with winning games.
But I’m not trying to turn Friday night football into an analytics convention.
I’m looking for simple numbers a high school coaching staff can actually chart, understand and use.
And I’ve made it easy for you to start.
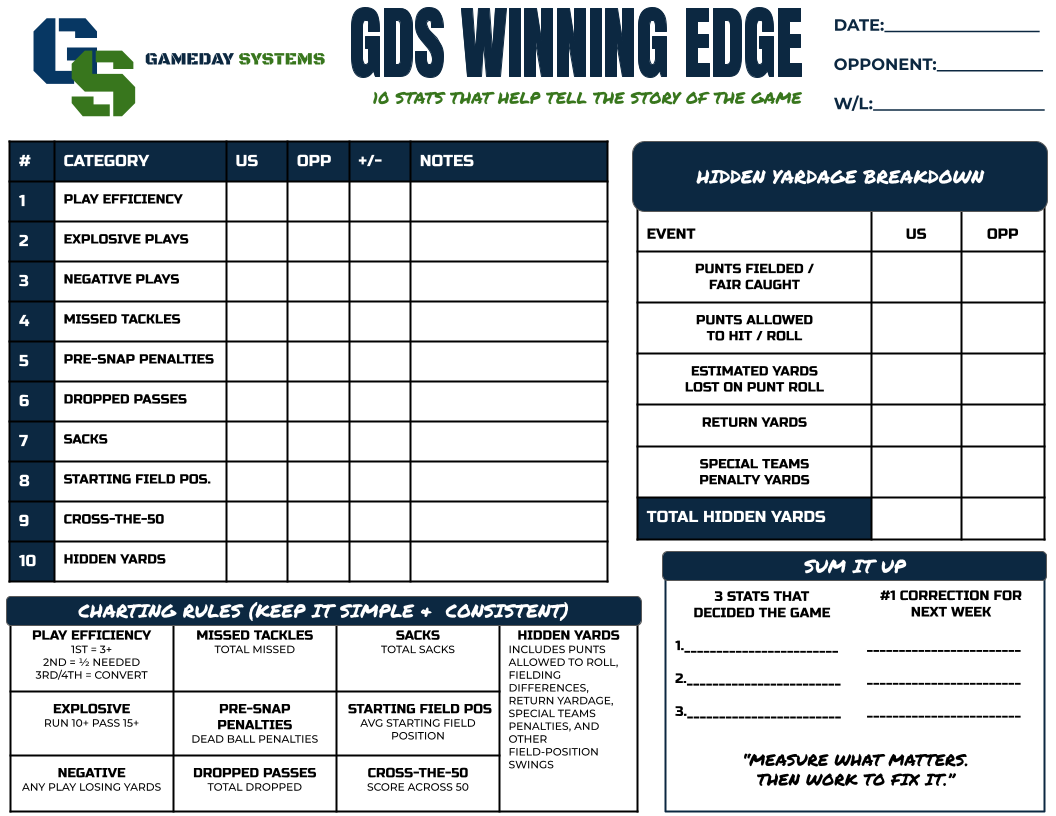
At the end of this article, I’m giving you the GDS Winning Edge Chart completely free. Its a one-page printable tracker built around the 10 stats below. Print it, take it into your weekend film review, and start tracking these numbers every week.
But first, let’s look at what we’re actually measuring — and why each one matters.
This is one of my favorite ways to evaluate an offense.
I don’t want to simply know our yards per play. One 70-yard touchdown can make an otherwise poor offensive night look much better statistically than it really was.
I want to know:
How often did we accomplish what we needed to accomplish on that particular down?
Here is how I chart an efficient play:
1st Down: Gain 3+ yards
2nd Down: Gain at least half of the yards needed for the first down
3rd Down: Convert
4th Down: Convert
That’s it.
If it’s 2nd & 8 and we gain four, I count it.
If it’s 2nd & 4 and we gain two, I count it.
If it’s 3rd & 2 and we gain one, I don’t.
At the end of the game:
Efficient Plays ÷ Total Plays = Play Efficiency %
There are more complicated versions of success rate used in football analytics. I intentionally keep ours simple.
I want something our staff can chart quickly and compare week after week.
If our offense ran 62 plays, I don’t just want to know that we gained 340 yards.
How many of those 62 plays actually kept us on schedule?
That’s a much more useful question.
Explosive plays change games.
For our purposes, I would define an explosive play as:
Run of 10+ yards
Pass of 15+ yards
Then chart both teams.
If we created seven explosives and allowed three:
Explosive Differential: +4
If we created two and allowed eight:
Explosive Differential: -6
Research backs up the importance of this category. In Bill Connelly’s Five Factors study using 2013 college-football data, the team that won the explosiveness battle won 86% of the time.
That doesn’t mean winning this particular definition of 10/15 explosives guarantees anything. It does reinforce something coaches already understand:
Big plays matter.
Don’t just count yours.
Who won the explosive-play battle?
This one is incredibly simple.
How many times did your offense go backward?
Any offensive snap that loses yardage gets counted.
A run for -2.
A screen for -4.
A sack for -7.
They all count.
Then chart the opponent the same way.
I like this number because negative plays create problems that don’t always show up when we’re looking at total offense.
You can rush for 200 yards and still have a problem if you continually put yourself behind the chains.
A 1st & 10 becomes 2nd & 13.
A manageable 2nd down becomes 3rd & long.
A drive that was moving suddenly stalls.
When I look at this number after the game, I want to ask two questions:
How many negative plays did we allow?
And:
How many did our defense create?
Don’t overcomplicate this one.
Count them.
If we should have made the tackle and didn’t, put it on the sheet.
A missed tackle can turn a four-yard gain into 14.
It can turn a punt into another set of downs.
It can turn a routine completion into a touchdown.
And sometimes you watch the film Monday morning and realize the defensive call wasn’t the problem at all.
We had somebody there.
We just didn’t get the ballcarrier on the ground.
That’s an important distinction when you’re deciding what needs to be fixed during the upcoming week.
I would separate these from total penalties.
Why?
Because a holding call and a false start aren’t the same kind of mistake.
A kid may get called for holding while competing his tail off against a really good defensive lineman.
A false start?
The defense didn’t make us do that.
False starts. Illegal formations. Delay of game. Illegal substitutions. Alignment penalties.
Those are self-inflicted wounds.
Track them separately.
If you’re averaging three or four pre-snap penalties every Friday night, you don’t just have a penalty problem.
You may have an operational problem.
Communication. Cadence. Substitution procedures. Formation clarity. Practice organization.
The number should lead you toward the problem.
The stat sheet calls it an incompletion.
The film tells a different story.
Sometimes the quarterback put the ball exactly where it needed to be and we simply didn’t finish the play.
So chart drops separately.
I don’t think we need some complicated formula for potential yards lost.
Just count them.
Because there’s a major difference between:
We couldn’t get anybody open.
and
We had opportunities and didn’t capitalize on them.
Those require two completely different corrections Monday afternoon.
Yes, sacks are technically already included in our negative plays.
I would still pull them out and track them separately.
Why?
Because sacks can completely change a possession.
More importantly, every sack deserves an answer.
Was it protection?
Did an offensive lineman simply get beat?
Did the running back miss an assignment?
Did the quarterback hold the football?
Was nobody open?
Did we fail to account for pressure?
Simply writing down “4 sacks” doesn’t help much.
But tracking them every week forces us to go back and figure out why they’re happening.
I would also chart the other side.
Sacks Created – Sacks Allowed = Sack Differential
This one gets overlooked far too often.
Where did we start our possessions?
Where did they start theirs?
Over the course of a game, ten yards here and twelve yards there add up.
Football analytics have found average starting field position to be strongly associated with winning. In Connelly’s Five Factors work, the team winning the field-position battle won 72% of games in the 2013 college dataset.
That doesn’t mean field position exists independently of everything else. Good offense, good defense and special teams all contribute to it.
That’s actually the point.
Field position can tell the story of the entire team.
If we’re repeatedly starting at our own 18 while they’re starting near the 35 or 40, we’re playing two very different football games.
Chart the average starting field position for both teams.
You may be surprised what it tells you.
This isn’t a traditional analytics statistic.
It’s simply something I think can be useful for a high school staff.
How many possessions crossed midfield?
Then:
How many of those possessions produced points?
Maybe we crossed the 50 eight times.
Sounds pretty good.
But if we only scored on three of those possessions, we left opportunities on the field.
Now go back and find out why.
Penalty?
Negative play?
Sack?
Missed field goal?
Failed fourth down?
Bad play call?
Poor execution?
Getting across midfield tells me we were capable of moving the football.
Finishing those possessions tells me whether we took advantage of it.
This may be my favorite one on the entire list.
There are yards won and lost during a football game that never really show up when we look at offensive statistics.
Bill Belichick once gave a perfect example when discussing special teams.
Imagine a punt that could have been fair caught after traveling 37 yards.
The returner doesn’t catch it.
It hits the ground and rolls another 13.
The stat sheet doesn’t record a 13-yard punt return loss.
But you just lost 13 yards of field position.
Belichick referred to those types of plays as hidden yardage.
I learned this lesson firsthand.
Last season, we had trouble finding somebody who wanted to catch punts.
And I understand it.
Standing by yourself with eleven guys flying down the field at you while you’re trying to track a football in the air can be intimidating for a high school kid.
We had kids who were nervous about it. Nobody really wanted the job.
Eventually, we put a kid back there who wasn’t necessarily our most athletic option.
His job was simple:
Catch the football.
He didn’t have to make anybody miss.
He didn’t have to be a great punt returner.
If necessary, just fair catch it.
But catch it.
It made a huge difference.
There were nights where I believe simply having somebody willing to field those punts probably saved us 50–100 yards of field position compared with allowing balls to hit the ground and roll another 20 or 30 yards.
There are no return yards in that statistic.
There is no offensive yardage.
There may not even be anything obvious in the box score.
But those yards are real.
And punts aren’t the only place hidden yardage exists.
Special-teams penalties.
Poor kickoff coverage.
Bad punts.
Poor returns.
A return erased by a penalty.
A ball we could have fielded but allowed to roll.
Start looking for hidden yardage and you’ll start seeing it everywhere.
I even gave Hidden Yardage its own section on the free tracker. Don’t just write down a total. Track where those yards are actually disappearing — punts allowed to roll, return yardage, special teams penalties and other field-position swings.
The best way to make these statistics useful is to build them into a simple weekly routine.
Assign one or two coaches to chart the game in real time. Use the same definitions every week.
Track:
Efficient plays
Explosive plays
Negative plays
Missed tackles
Pre-snap penalties
Dropped passes
Sacks
Starting field position
Possessions that cross midfield
Hidden-yardage plays
Don’t worry about making the sheet perfect during the game. Mark the play, possession or situation quickly and leave detailed explanations for the film review.
Before the staff meeting, compare the chart with the film and official statistics.
Correct missed plays. Separate obvious mistakes from judgment calls. For every sack, missed tackle, dropped pass or hidden-yardage play, add a short explanation of what happened.
Then calculate the key totals and differentials:
Play efficiency percentage
Explosive-play differential
Negative-play differential
Sack differential
Average starting field position
Cross-the-50 scoring percentage
Do not try to fix all 10 categories at once.
Review the numbers alongside the film and choose the three statistics that most affected the game or show the clearest trend. Ask:
What happened?
Why did it happen?
What can we change this week?
A low play-efficiency number may point to poor execution or bad down-and-distance situations. Missed tackles may require more tackling work. Pre-snap penalties may require changes to communication and practice organization. Poor cross-the-50 efficiency may require more work on red-zone execution and finishing drives.
Turn each priority into a specific correction.
If negative plays are the problem, build periods around staying on schedule. If explosive plays allowed are the problem, emphasize alignment, leverage and pursuit. If hidden yardage is the problem, devote special-teams time to punt decisions, coverage and ball security.
Make the players aware of the target, but keep the message simple.
Here is the number we need to improve. Here is why it matters. Here is how we are going to attack it.
Keep the weekly numbers in one place so you can compare games over time.
One bad game may be an outlier. The same problem appearing for four or five weeks is a trend. Trends should influence personnel decisions, practice priorities, game planning and offseason work.
The goal is not to collect more statistics.
The goal is to create a repeatable process:
Chart it Friday. Verify it over the weekend. Choose priorities Monday. Practice the correction during the week. Review the trend over time.
Stats are useless if they just sit on a sheet.
The scoreboard will always tell us who won.
Our job as coaches is figuring out why—and using that answer to prepare for the next game.
I’ve put all 10 of these numbers onto one simple, printable postgame tracker.
It includes space to compare your team with your opponent, chart the differential, break down hidden yardage and identify the three numbers that told the story of the game.
Print one each week. Chart the game. Study the trends. Fix what matters.
No posts
Comments
Nothing yet. Say the first thing.
Sign in to join the conversation.