
Dear Mr. Fundasy,
I know that it has been some time since I’ve given you a portfolio update. In all honesty, I have continued holding my existing positions largely, due to our buying and holding strategy. In addition, the last month I have been dealing with an achilles tear and writing got put on the backburner for a while. To update readers, the holding re-weight and my current risk appetite are the primary focus of this Portfolio Update.
William
Today, I have a big update for the portfolio strategy going into H2 2025.
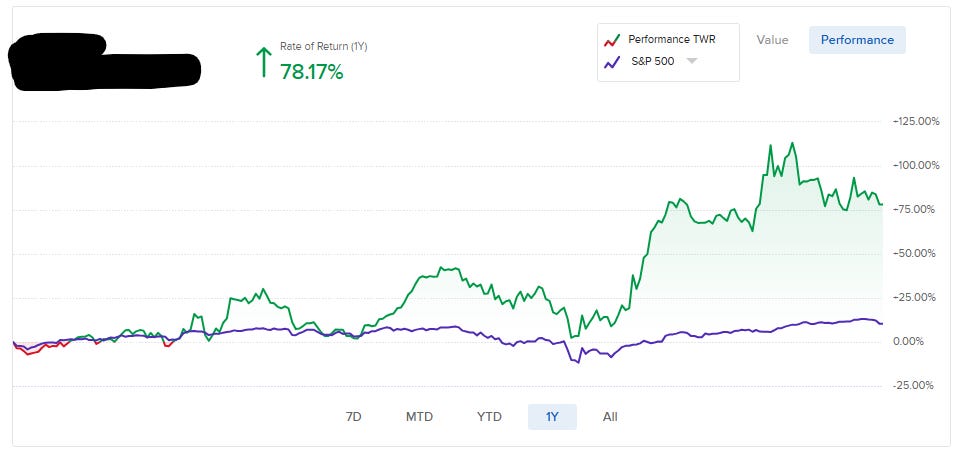
YTD: 72.4%
1-Year: 78.2%
Since Inception (5.17.24): 88% - 66% CAGR
In an effort to keep myself accountable for portfolio maintenance and proper due diligence, I think it will be valuable to get my thoughts down today. With this update, I will also provide a conceptualization into a few of the many mental models through which I view the market. This will be a good walk through for portfolio construction both for Free and Paid Subs. Then, Paid Subscribers can see how this affected my weightings and my thought process for aligning the portfolio for H2 of 2025 with these concepts in mind.
I’ve always loved Statistics. Then, after I studied Industrial and Systems Engineering in College I learned to apply statistics to complex systems. Being a finance enthusiast, I completed a R-Project which took the average REIT performance each year of the top 25 and built a ML Model to determine which one would beat the average REIT performance the next year. I gave the right 8-10 variables to focus on. It ended up being so good that the P-value for its predictions was .0125, statistically significant.
I got a B on that project. That’s why he worked in Academia though.
Industrial Engineers are trained to manage the volatility within systems to ensure they stay within acceptable margin of error. It was the perfect indirect training for managing financial markets. Of course, it also dramatically shaped my market mental models.
In Stat 101, you’ll learn about a normal distribution. It’s a fairly simple concept:
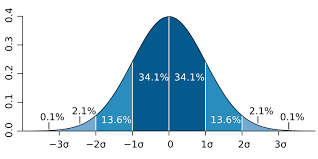
A normal distribution is a symmetrical and bell-shaped curve where most data points fall near the center (the average or "mean"). As you move further from the center, values become less common or probable to occur.
68% of data falls within 1 standard deviation (σ) of the mean — 34% on each side.
95% falls within 2σ, and 99.7% within 3σ
It models many real-world scenarios (like heights or test scores) because random variation tends to "pull" extreme values back toward the average, a property known as regression to the mean. Also a valuable point to this analysis is that at each end of the spectrum to the high and low, it is much lower of a probability of an occurrence.
Through this perspective, if you were to hypothetically overlap S&P 500 PE Valuations over a Simple Normal Distribution, you would come up with the following graphic:
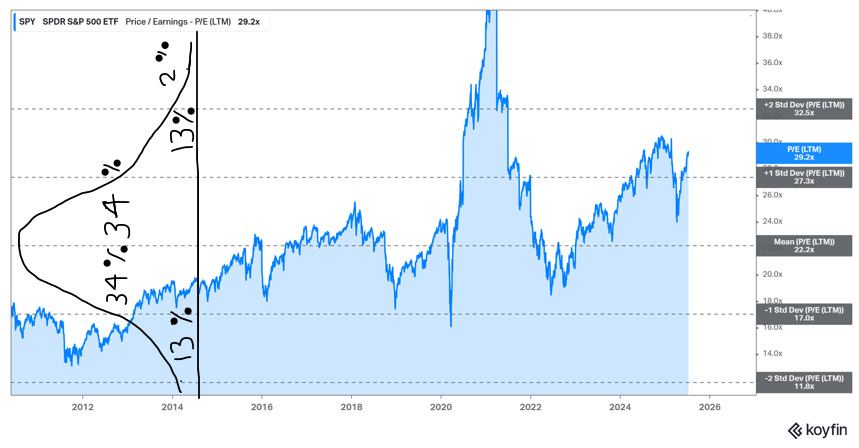
Mean S&P 500 valuation at 22 ; +1 Std Dev 27.3 ; +2 Std Dev 32.5x
Today’s valuation : +1.5x ; 93% percentile valuation with only Covid being higher.
Obviously, there are other macro factors that have occurred from 2011 to today. However, this rough conceptualization gives us an average PE Valuation around 22x Earnings, reasonable enough. That means that with our 29 PE today, this is sitting around 1.5 standard deviations from the mean, with only a 7% chance of being higher. That math only stands correct though, if 22x is the correct average PE for the S&P500.
Which if you consider the past two decades of modern tech mega-cap trading compared to interest rates, that could be about right. With rates where they are though, weakening macro data, tariff second order effects not being felt, AND record high-valuations. It’s not the time to be putting your foot on the gas, which is fine.
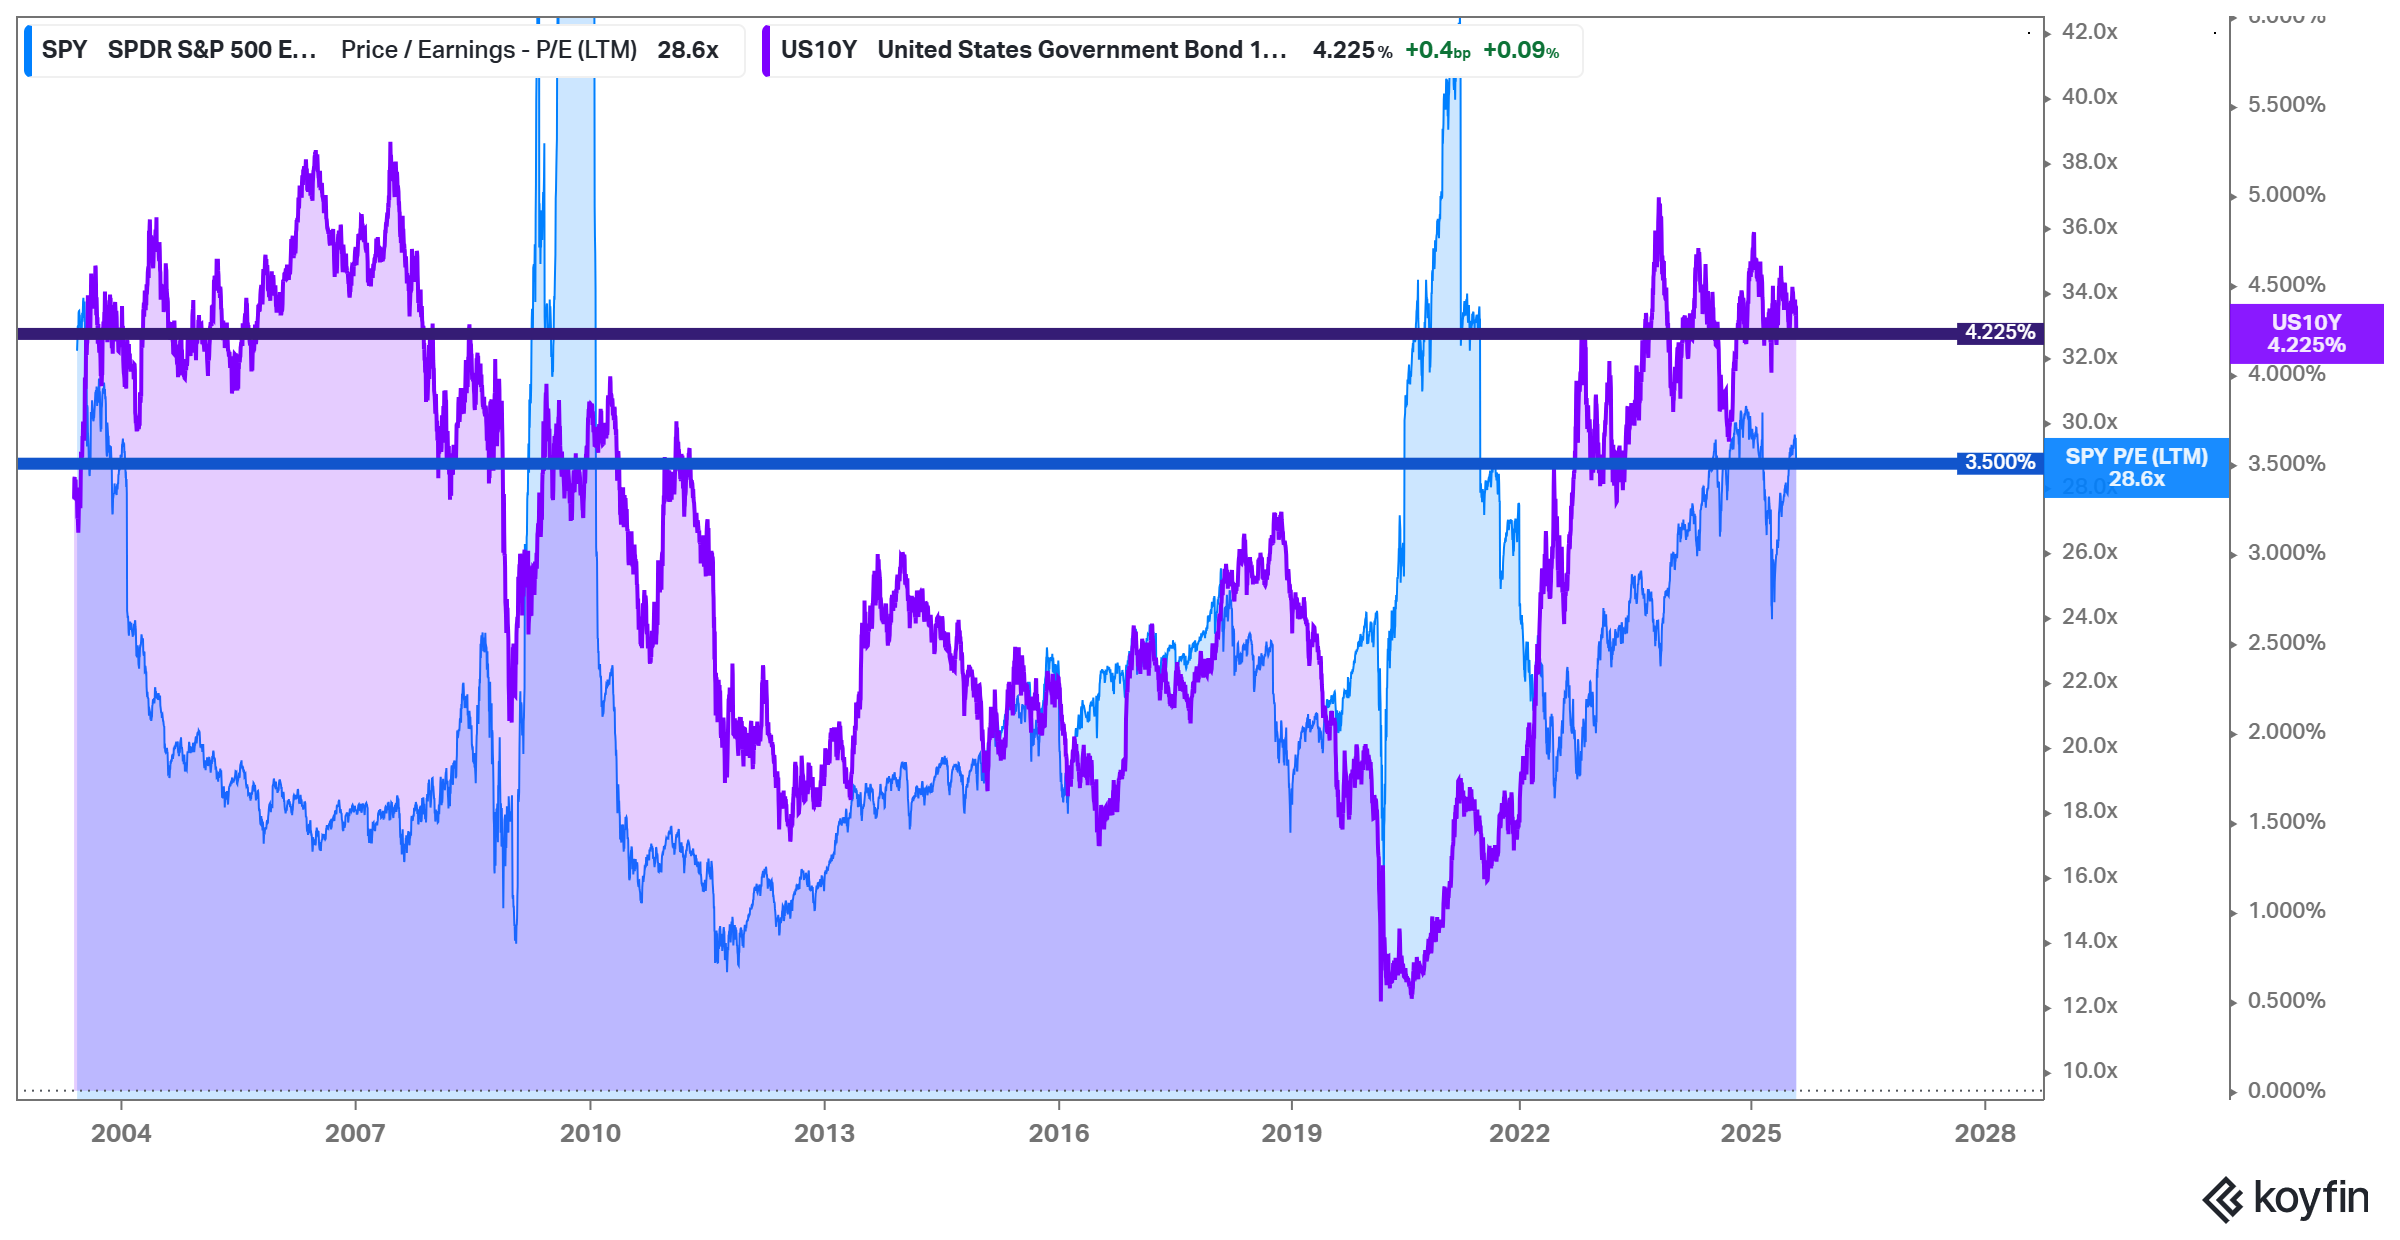
Although not a perfect framework for valuing markets, this gives an investor a rough quantitative approach to confirm one’s thoughts on the public stock market system. The general ideas in stocks is that it is all a guessing game. No one knows what will happen exactly.
The fact that the exact outcome cannot be known is not an excuse to disregard the conceptualization about the risk/reward at the given setup. Many investors don’t have a plan for this type of situation and how to handle it within a long only portfolio. In the portfolio updates, I will update Paid Subs on the method I will be implementing for my own portfolio.
Independently of the overall averages, you have the average valuations of each of the sectors as well. That is where the idea of a regression comes in handy. With a best fit line in a linear regression, you can get the Residuals (how far from the trend) given sectors are. This would allow us to find a framework for figuring out which stocks to focus on.
Here are two examples down below to give you can idea:
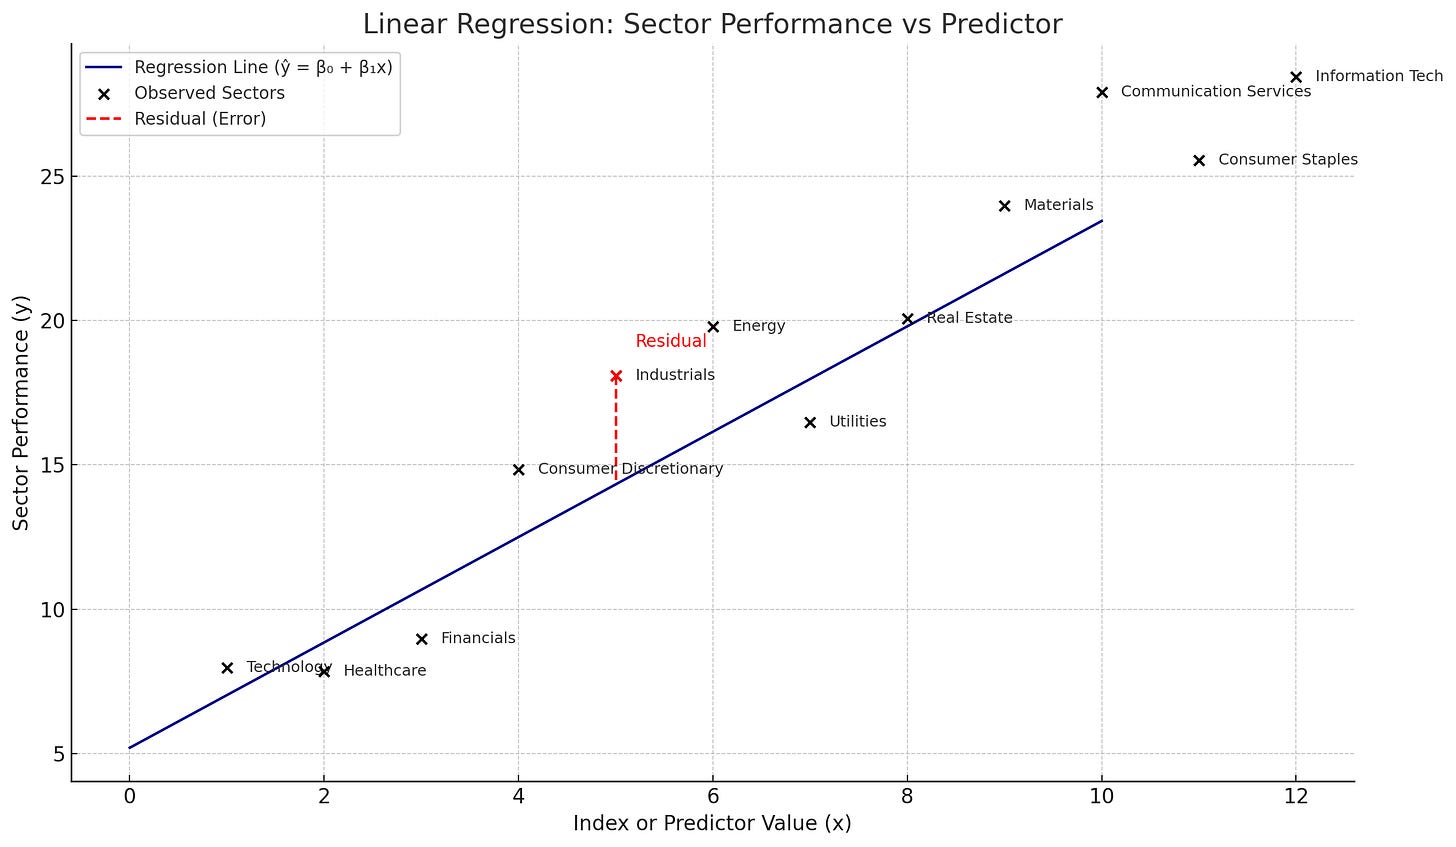
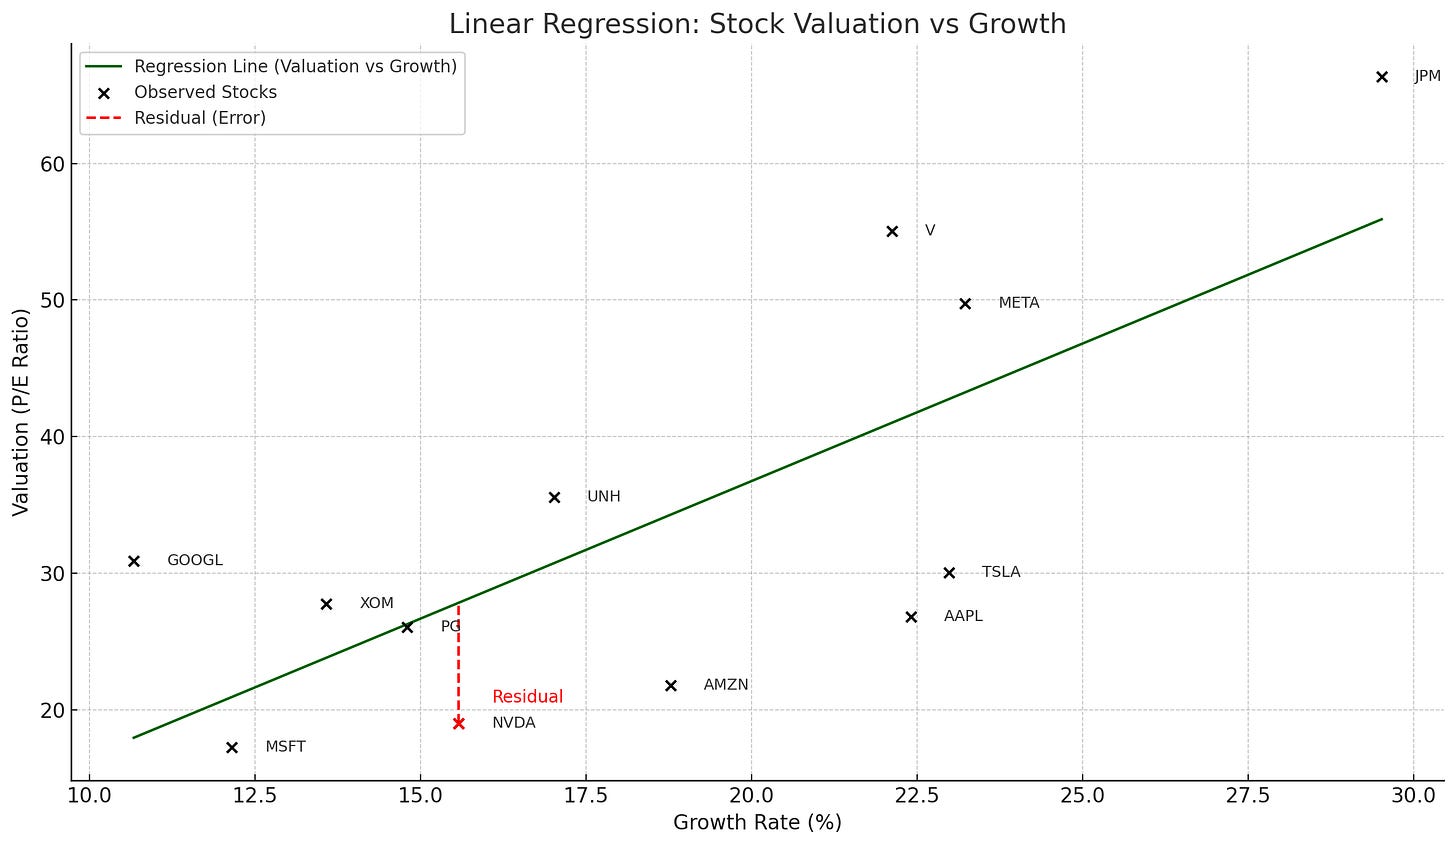
The idea would be that that can find both sectors and individual stocks under the regression to maximize probability of success in any given environment. Conceptualizing this Market Structure Hierarchy as follows:
Layer 1.0: Market Average
Layer 2.0: Sector 1 Average
Layer 3.1: Individual Stock 1
Layer 3.2: Individual Stock 2
Layer 3.3: Individual Stock 3
Layer 2.0: Sector 2 Average
Layer 4.1: Individual Stock 1
Layer 4.2: Individual Stock 2
Layer 4.3: Individual Stock 3
Etc.
With this framework and going from top to bottom to find the (1) overall market risk (2) individual sector risks and (3) individual stock valuations vs Overall Market Valuations can yield us a perspective on how to weight both the portfolio and individual stocks.
If an individual were to look at the valuations across sectors and compare relative value versus generalized growth expectations. What sectors would stand out to you to look into?
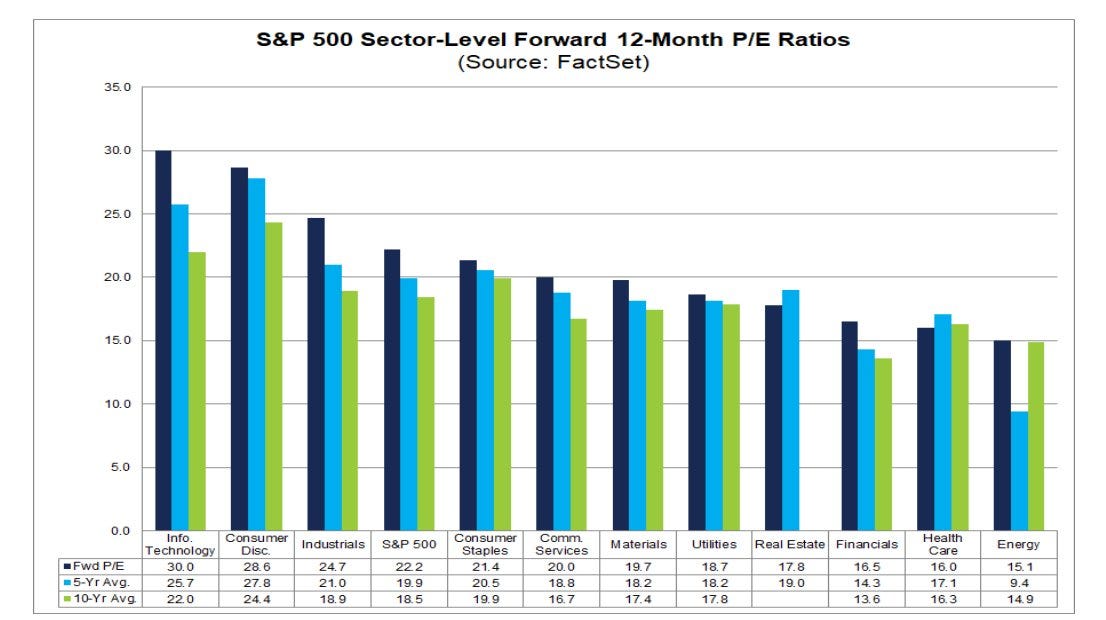
Currently, the Healthcare and Energy Sectors are near their 10-Year Averages. Within these, I know that I have a competency studying insurance stocks and that seems to be a terrific hunting ground for investors looking for opportunities in a beaten down set of stocks.
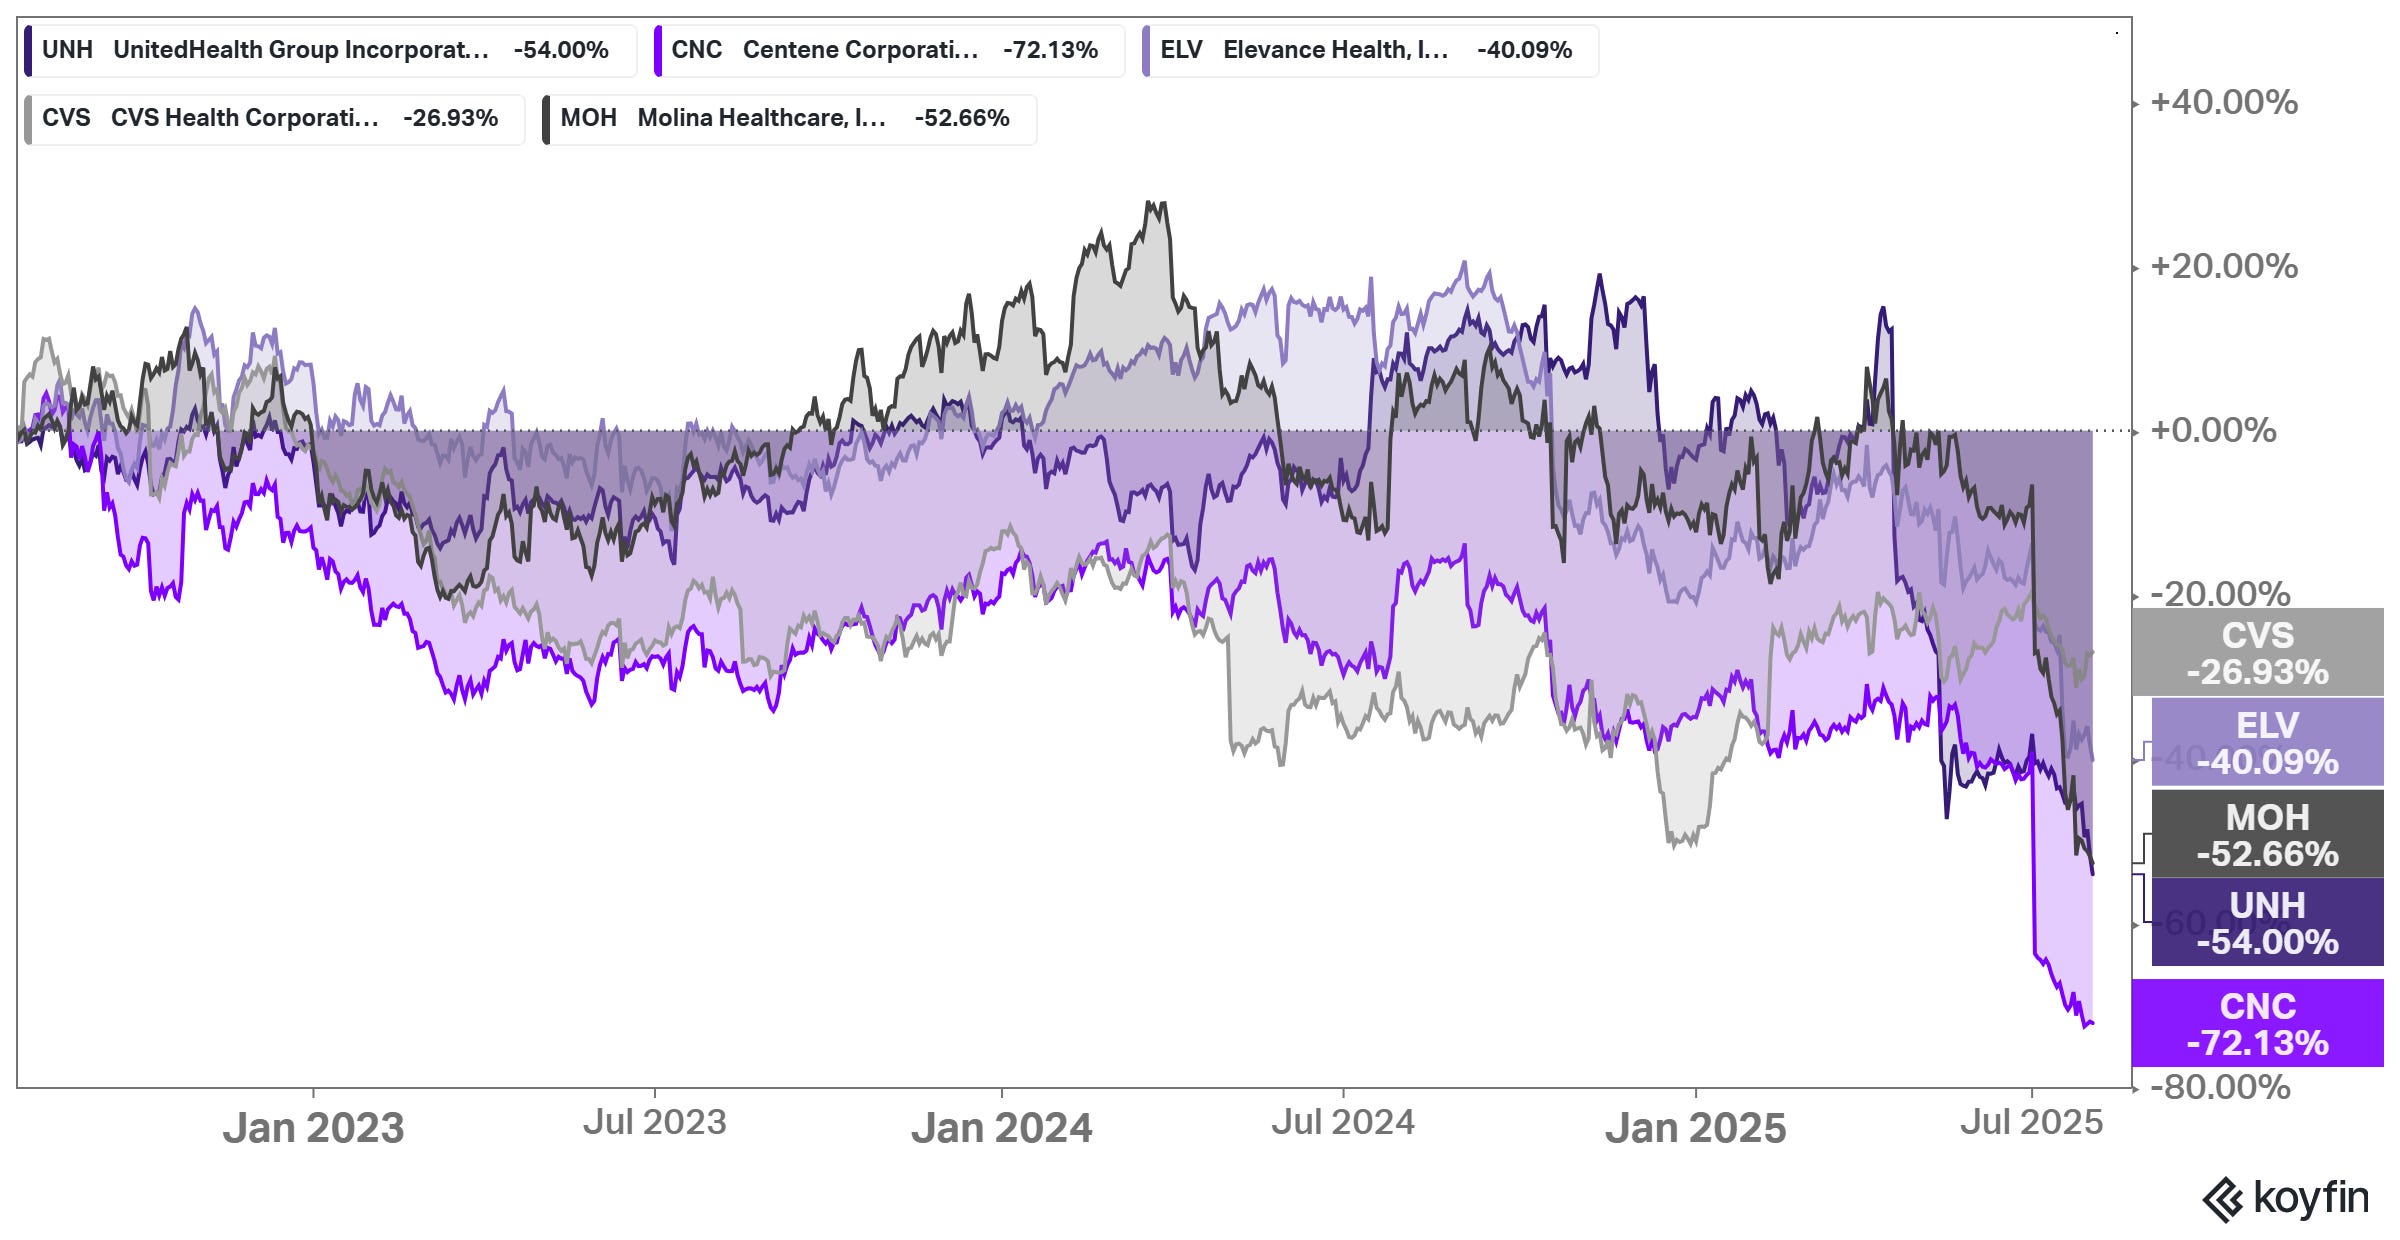
Therefore, after conducting a complete analysis we can come away with two general ideas:
From a probabilistic sense, the market is overvalued
From a probabilistic sense, the healthcare stocks, insurers specifically, are at statistically low valuations.
If you’re interested to see what I’m doing with these insights in my portfolio that contains 60% of my net worth going into H2 2025 , then consider becoming a Paid Sub today to my Analyst Services!
Comments
Nothing yet. Say the first thing.
Sign in to join the conversation.