
Deploy a Python/FastAPI backend and React frontend to production Docker containers
Wire environment variables through a secrets-safe
.envpipelineSet up Prometheus metrics collection with a custom
/metricsendpointImplement layered health checks: liveness, readiness, and dependency probes
Launch a Grafana performance dashboard — live, real data, zero mocks
Every engineer at some point treats deployment as “copy code, run it.” That mental model collapses at scale. Production deployment is an operational contract — a guarantee that your app starts correctly, fails predictably, exposes its own health, and integrates into the monitoring fabric of your infrastructure.
Netflix, Shopify, and Stripe all treat deployments as observable events, not silent background tasks. Their systems emit telemetry from the first millisecond of startup.
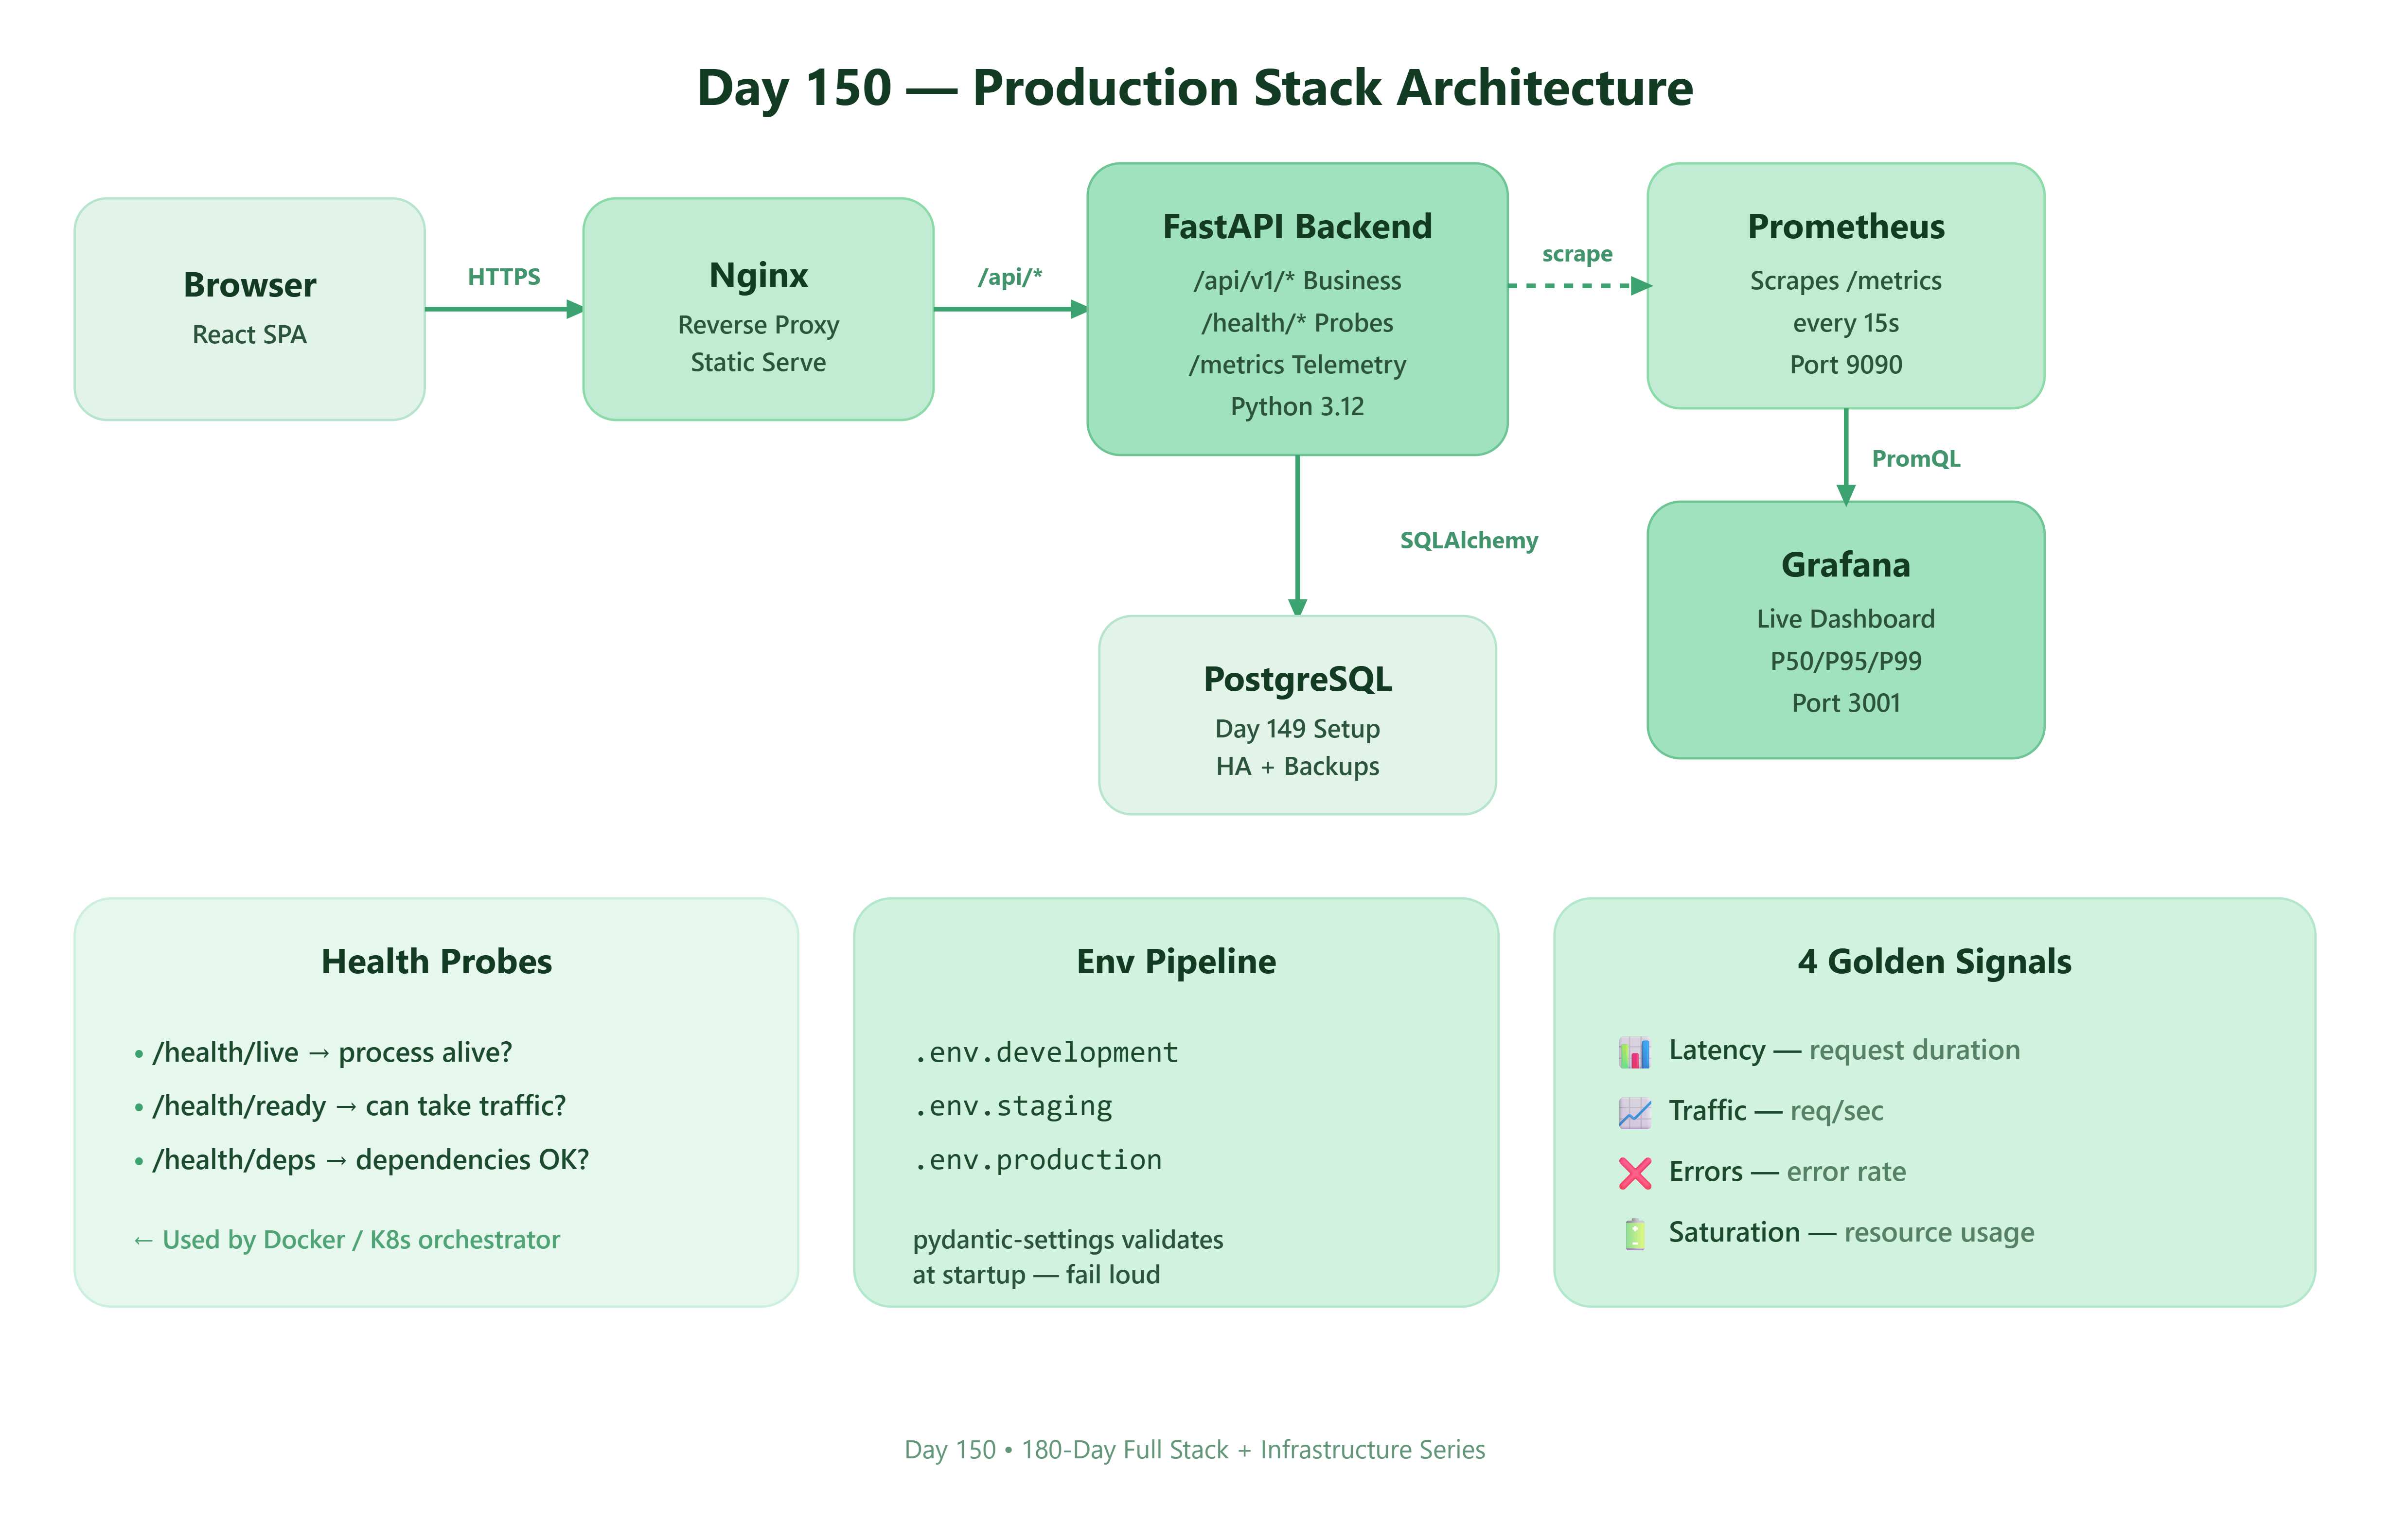
┌─────────────────────────────────────────────────────┐
│                   PRODUCTION STACK                   │
│                                                     │
│  React Frontend ──► Nginx Proxy ──► FastAPI Backend │
│                                          │           │
│                                     PostgreSQL DB    │
│                                          │           │
│                              Prometheus ◄─────────── │
│                                   │                  │
│                               Grafana Dashboard      │
└─────────────────────────────────────────────────────┘
The backend exposes three categories of endpoints:
Business endpoints — actual application logic
Health probes —
/health/live,/health/ready,/health/dependenciesMetrics endpoint —
/metricsscraped by Prometheus every 15 seconds
The frontend is a React SPA served via Nginx — same pattern used by Vercel’s internal deployments. Nginx also reverse-proxies API calls to the backend container, eliminating CORS complexity.
Most junior engineers hardcode secrets. Mid-level engineers move secrets to .env files. Senior engineers design an environment promotion pipeline where the same app binary runs in dev, staging, and prod — only the environment context changes.
Your backend reads config using pydantic-settings — it validates types, provides defaults, and fails loudly at startup if required vars are missing. No silent misconfiguration.
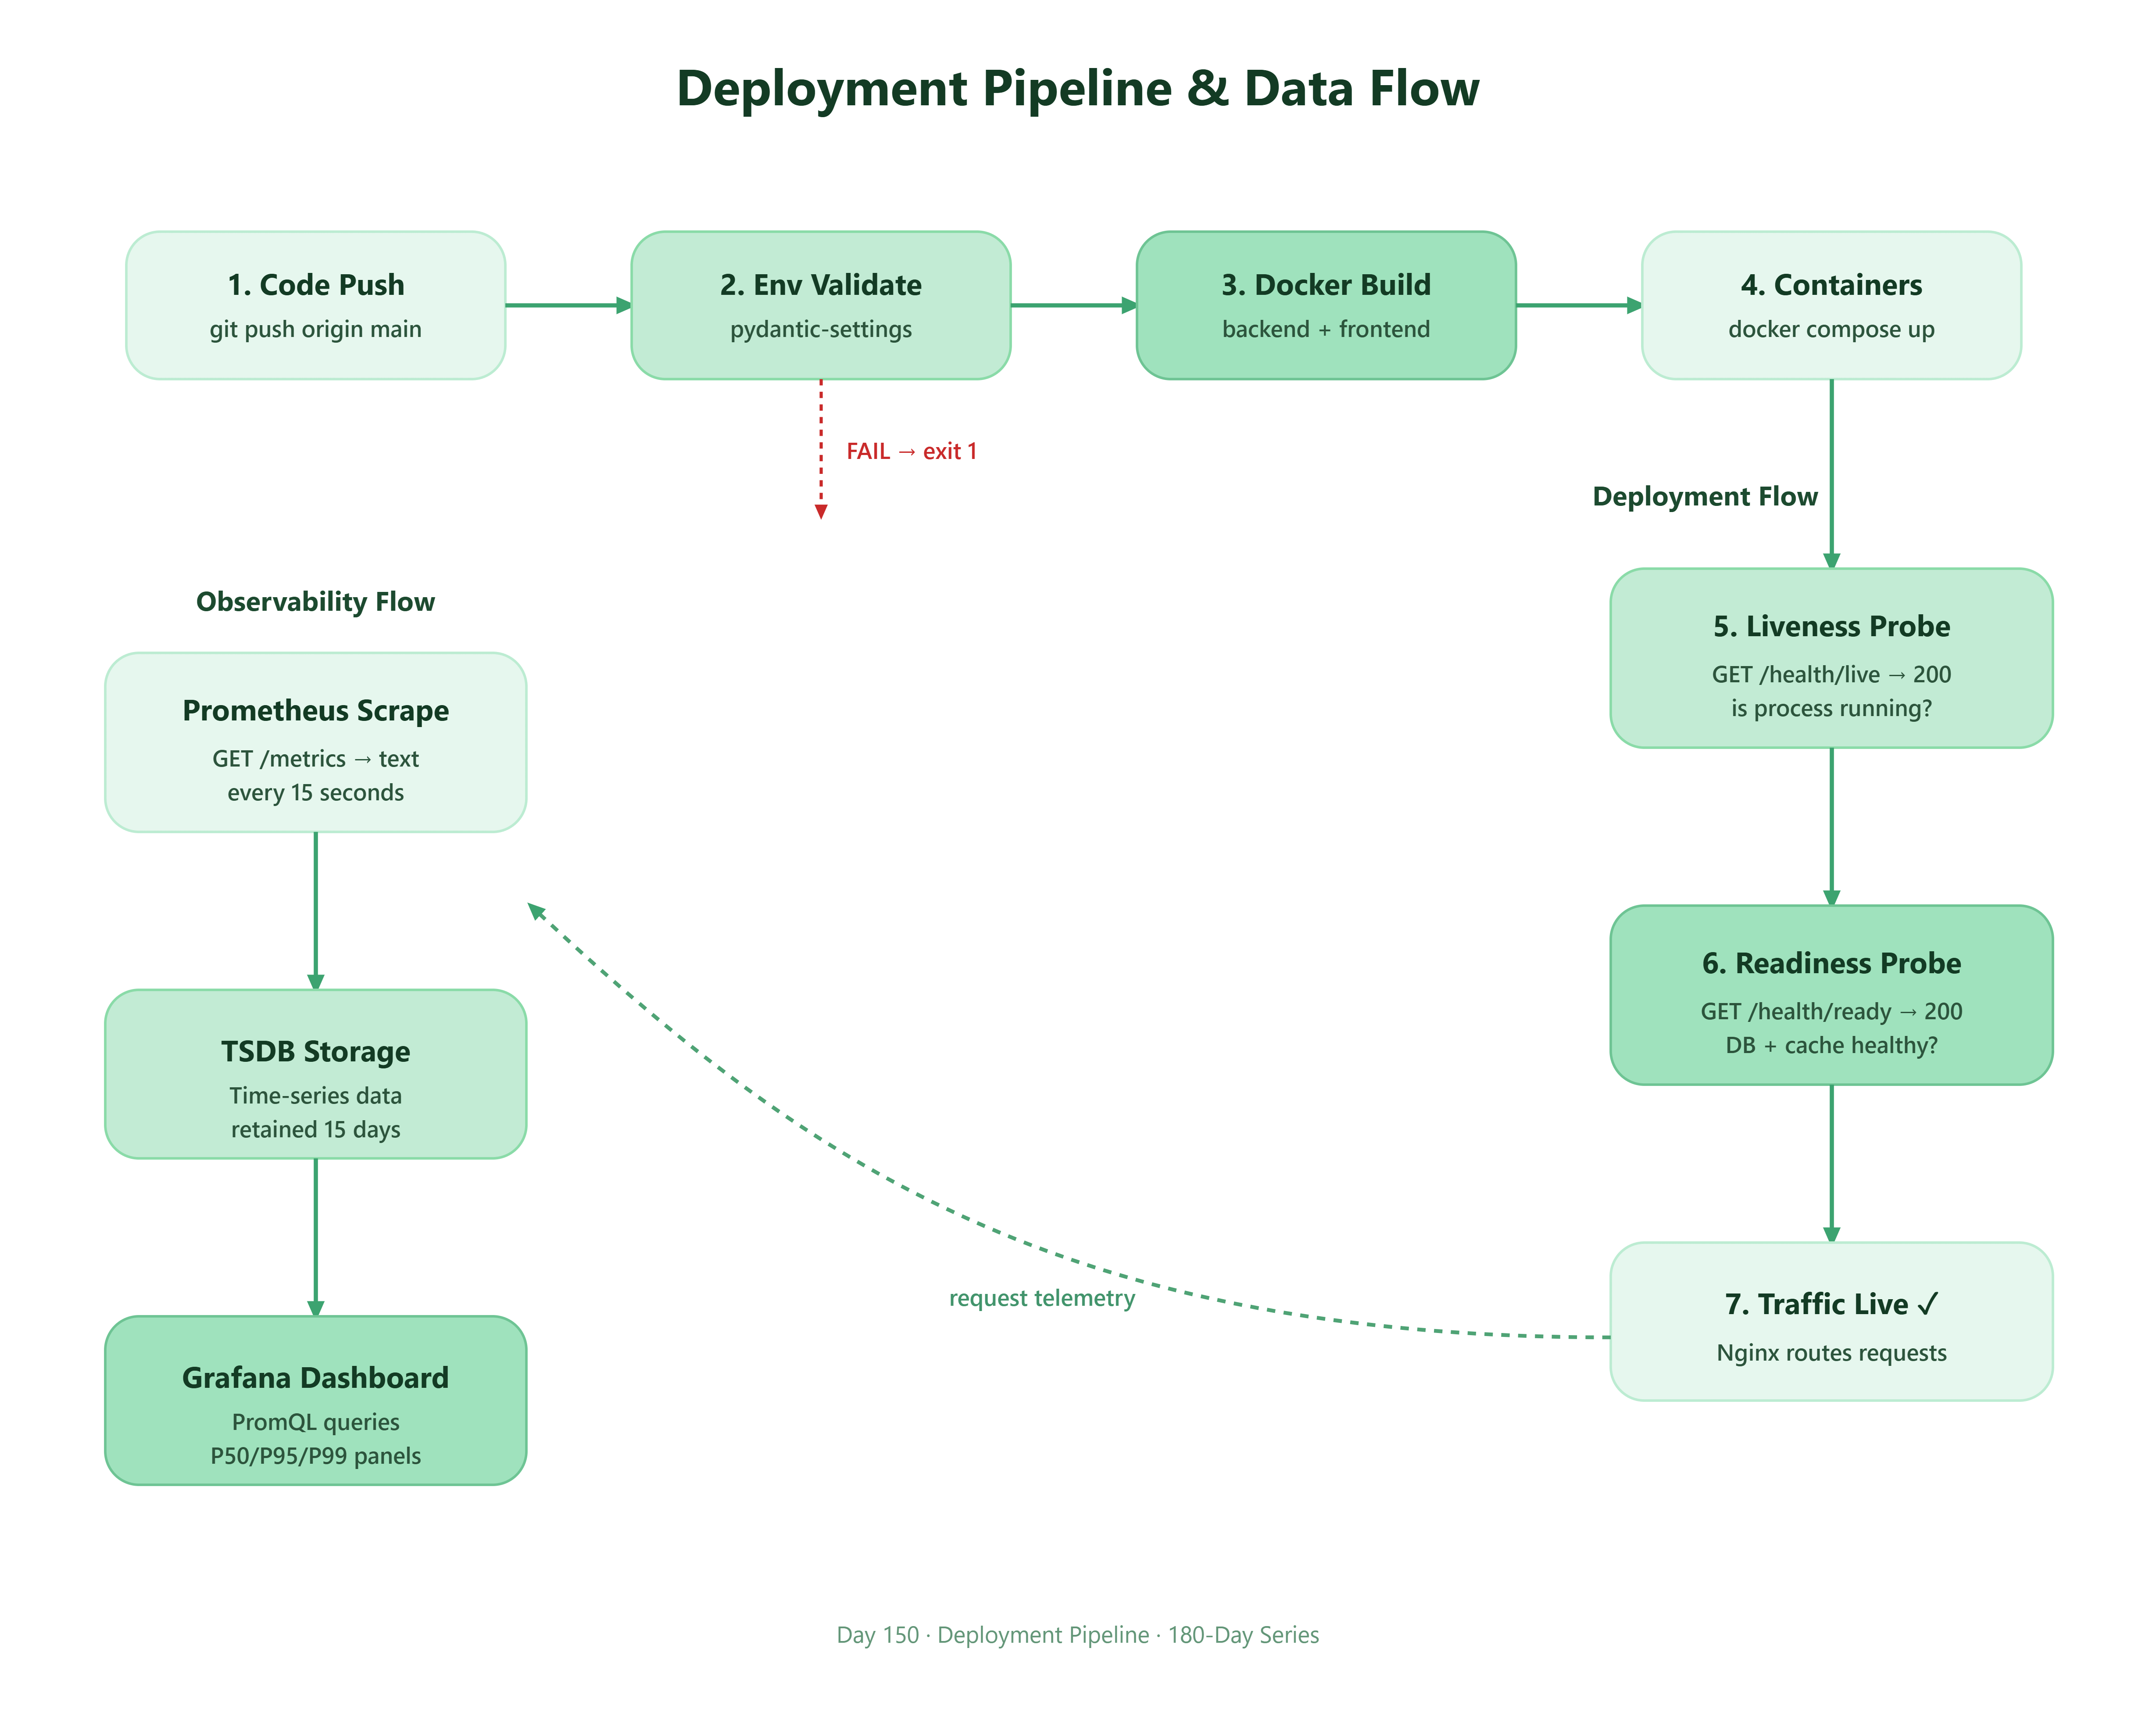
Kubernetes and Docker orchestrators need to know: Is this container alive? Is it ready to serve traffic? Are its dependencies healthy?
Liveness probe — answers “Is the process running?” A 200 means the container shouldn’t be killed. Returns 503 only on catastrophic internal failure.
Readiness probe — answers “Can this instance take traffic right now?” If the DB connection pool is exhausted, return 503 here. The load balancer routes around you.
Dependency check — answers “Are all my downstream services healthy?” Checks PostgreSQL connectivity, Redis ping, and external API reachability. Used by deployment automation to gate rollouts.
This pattern is identical to what Google’s production infrastructure uses internally — fail fast at startup, fail clear in operation.
Don’t instrument everything. Instrument the four golden signals (coined by Google SRE):
Signal Metric Name What It Tells You Latency http_request_duration_seconds Are requests slow? Traffic http_requests_total How much load? Errors http_errors_total Are things failing? Saturation process_open_fds Am I running out of resources?
Your FastAPI app will use prometheus-fastapi-instrumentator to auto-instrument all routes with zero boilerplate, plus custom counters for business-specific metrics (e.g., deployments triggered, health check failures).
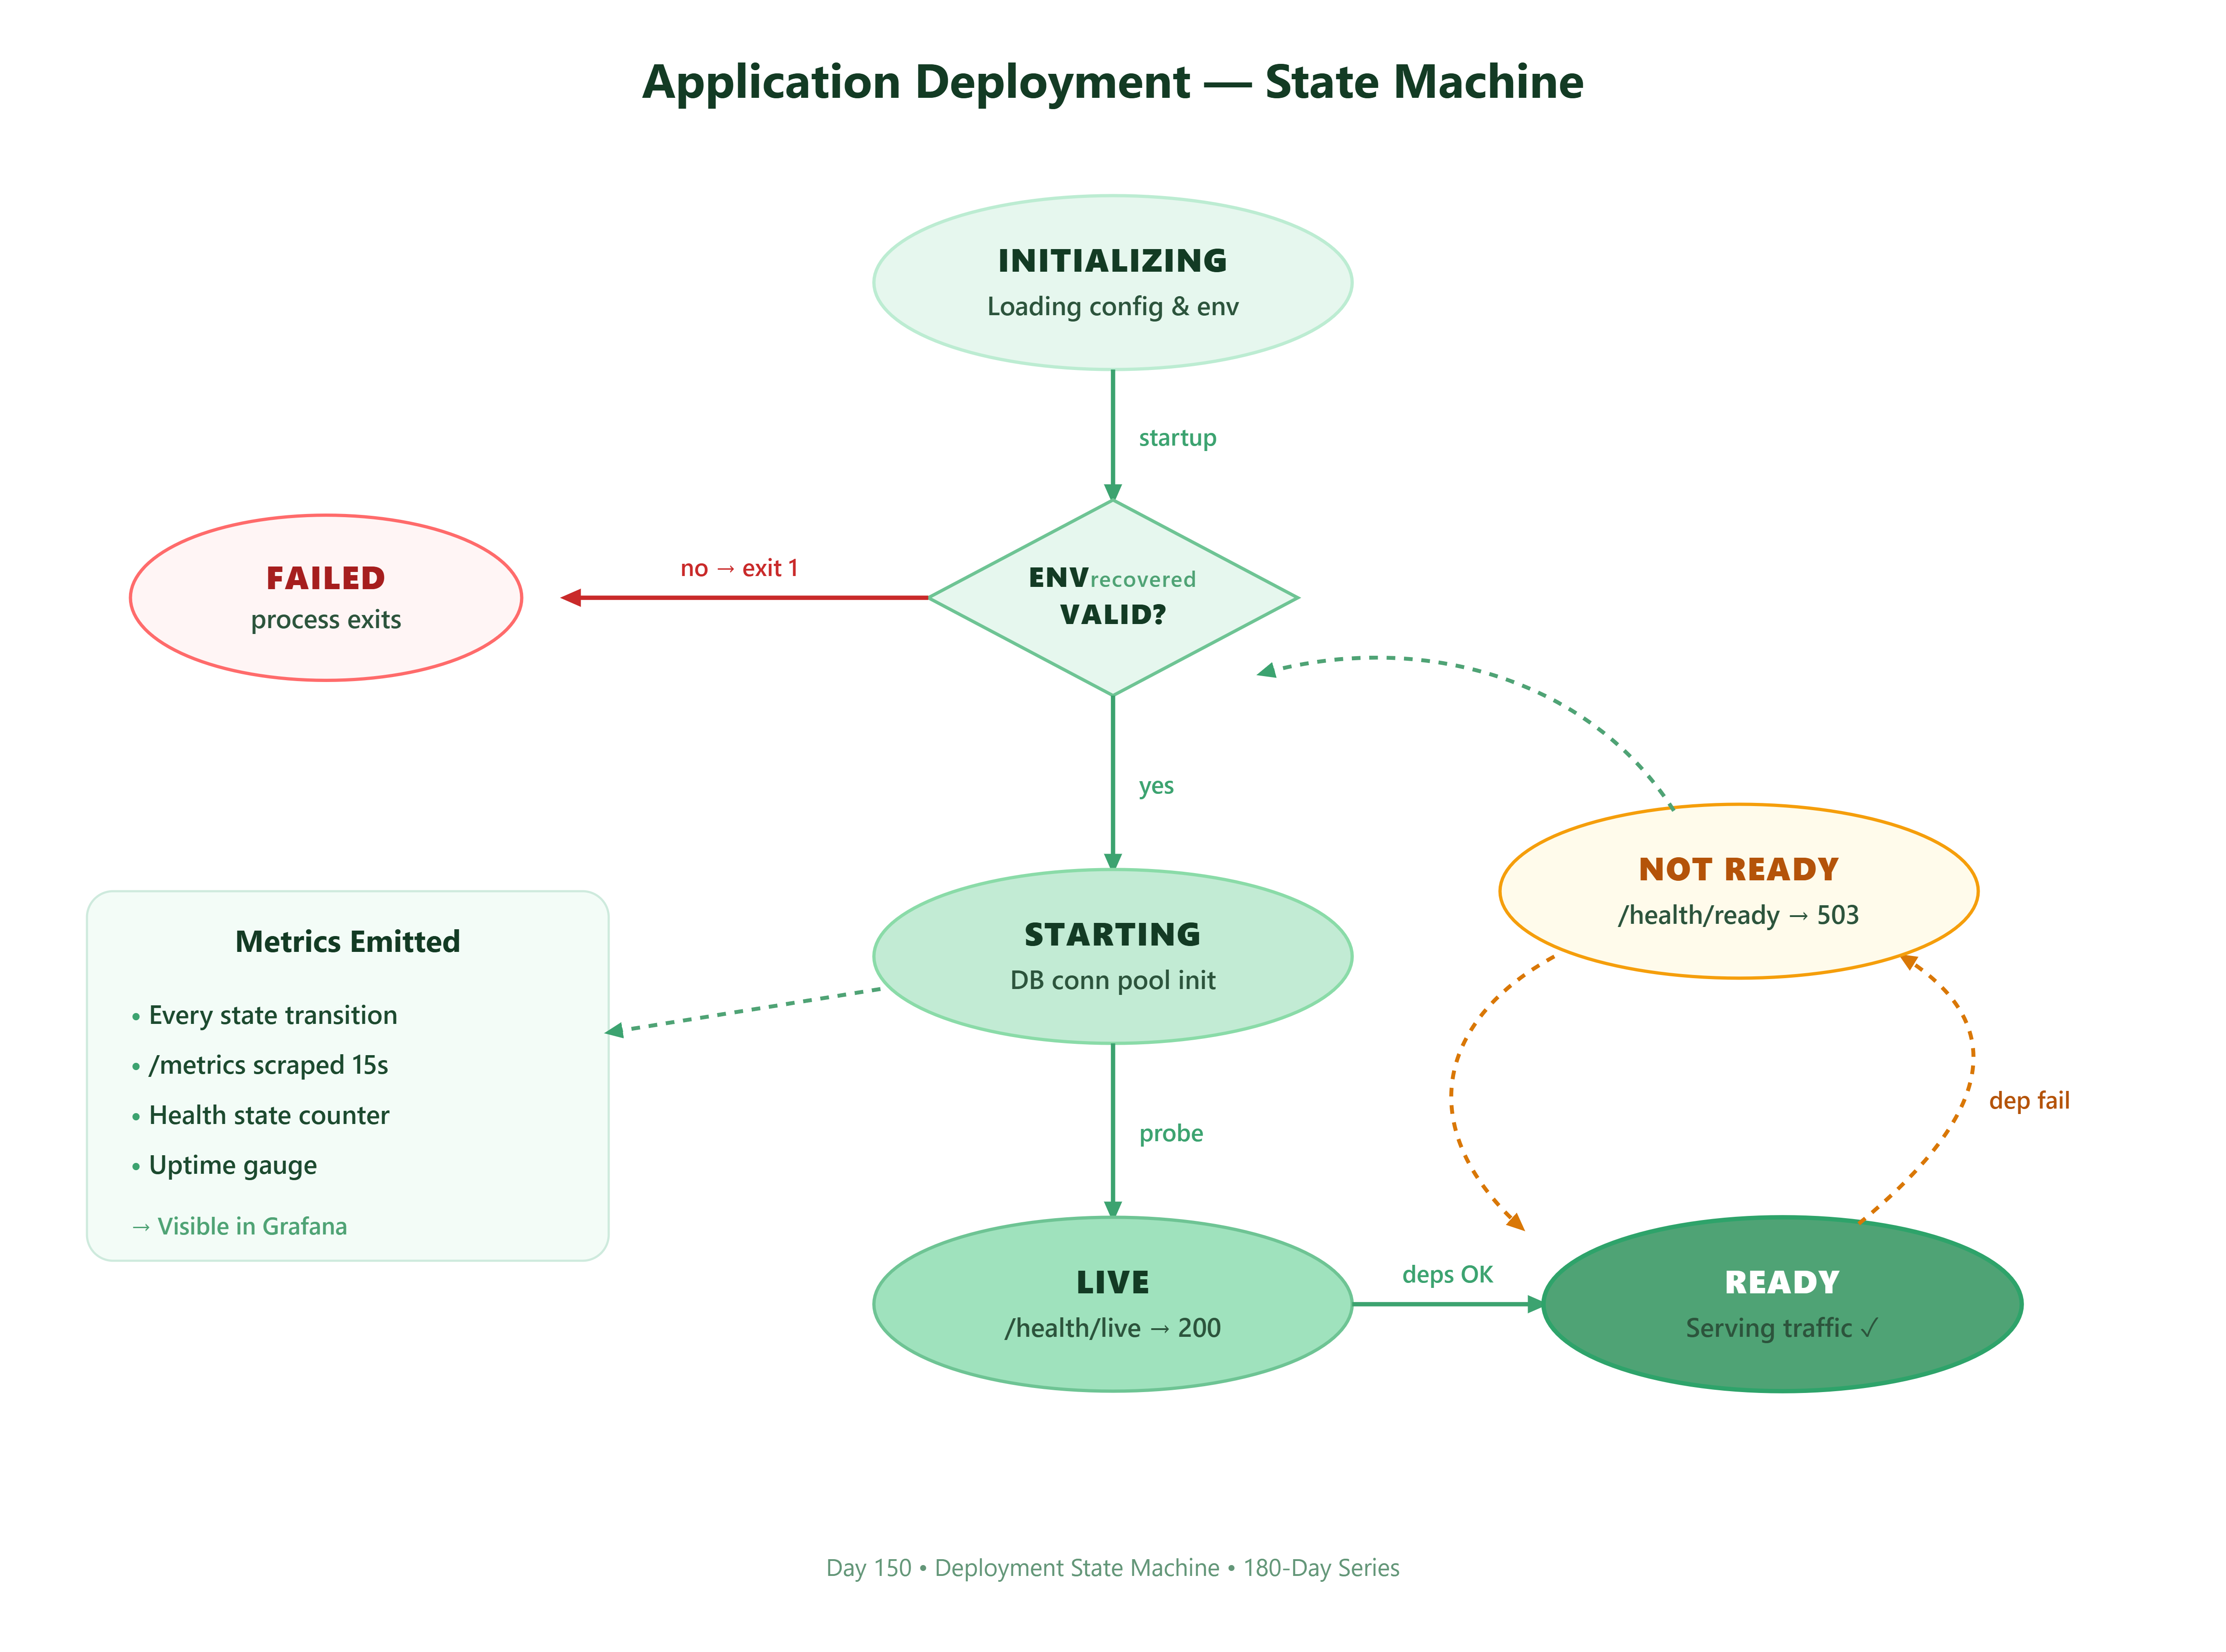
A production Grafana dashboard has three rows:
Availability row — uptime, health check status, error rate
Performance row — P50/P95/P99 latency, requests/sec, active connections
Resource row — CPU, memory, open file descriptors, GC pressure
This is structurally identical to Datadog’s APM default view. You’re building the open-source version.
https://github.com/sysdr/infrawatch-fullstack-p/tree/main/day150/day150_app
Expected output:
All endpoints are explorable and testable here.
Expected output (abridged):
Navigate to: Dashboards → Day150 → Day 150 — Application Deployment
You should see:
App Uptime counter (top left)
Request Rate stat
Error Rate stat
Health Status indicator (1 = READY)
P95/P50 Latency time series (updates after a few requests)
Dependency Health time series
HTTP Requests by Status (updates in real-time)
Generate traffic to populate charts:
If you forget DATABASE_URL in your .env, your app exits immediately with a validation error. You catch misconfigurations before the first request, not during.
These map directly to Kubernetes livenessProbe, readinessProbe, and pre-deployment checks.
This one line adds http_requests_total, http_request_duration_seconds, and http_requests_in_progress to every route automatically. You still add custom business metrics on top.
Symptom Cause Fix /health/ready returns 503 DB not running Start PostgreSQL or use local mode metrics endpoint missing Instrumentator not installed pip install prometheus-fastapi-instrumentator Grafana shows “No data” Backend not scraped yet Wait 30s for first scrape; check Prometheus targets Frontend blank CORS origin mismatch Check ALLOWED_ORIGINS in .env
For Docker specifically:
By completing this lesson, you’ve deployed:
A FastAPI production backend with structured JSON logging, Pydantic config validation, and three-tier health checks
A React dashboard that polls live endpoints and visualizes deployment operations in real-time
A Prometheus + Grafana observability stack with the four golden signals already wired up
A complete test suite covering health probes, deployment endpoints, and feature flag logic
This is architecturally identical to how Stripe, Shopify, and Cloudflare deploy and monitor their services — you have the same operational primitives.
By end of this lesson, you should be able to:
[ ] Hit
GET /health/liveand get{"status": "alive"}within 100ms[ ] Hit
GET /health/readyand see all dependencies marked healthy[ ] See your app’s request metrics appear in Prometheus at
localhost:9090[ ] Open Grafana at
localhost:3001and see live P95 latency updating every 15 seconds[ ] Trigger a simulated failure, watch the health check turn red, watch it recover
The app that deploys cleanly, exposes its health, and emits structured telemetry from minute one is worth ten times the app that “works on my machine.” Deployment is product quality.
Task: Extend the monitoring stack with a custom business metric.
Add a Prometheus counter called feature_flag_evaluations_total with labels {flag_name, result}. Instrument it in a new /api/feature-flags/{flag_name} endpoint that randomly returns enabled or disabled (simulate a feature flag service). Create a Grafana panel showing evaluation rate by flag name.
Solution Hints:
Use
prometheus_client.Counterwithlabelnames=["flag_name", "result"]Call
.labels(flag_name=name, result=result).inc()on each requestIn Grafana: query
rate(feature_flag_evaluations_total[1m]), group byresultlabelAdd a legend with
{{flag_name}} - {{result}}format stringSet panel type to “Time series” with stacked display
No posts
Comments
Nothing yet. Say the first thing.
Sign in to join the conversation.