
Here’s the agenda for this session:
Backup Engine — automated PostgreSQL WAL archiving + snapshot scheduling to MinIO
Health Monitor + Failover Controller — heartbeat detection with auto-promote of a replica
Recovery Tester — a chaos runner that validates your RTO and RPO on a schedule
Business Continuity Plan (BCP) Module — runbooks stored and surfaced through the API
DR Dashboard — a React UI that looks and feels like PagerDuty’s incident console
Your infrastructure stack now has observability eyes (Day 144). Disaster recovery is the immune system — it reacts when those eyes see something bad. The DR components sit between your primary site and your standby site, continuously syncing state and ready to reroute traffic in under 60 seconds.
Every business conversation about disaster recovery eventually reduces to two numbers:
RTO (Recovery Time Objective) — How long can your service be down before the business bleeds? Netflix targets seconds. A hospital EHR might tolerate 4 hours. Your architecture must be designed to meet this number, not just aspire to it.
RPO (Recovery Point Objective) — How much data loss is acceptable? An e-commerce checkout system might say “zero seconds” — every transaction must survive. A logging pipeline might say “15 minutes” is fine.
These aren’t soft guidelines. They’re the engineering spec. If your WAL archiving runs every 5 minutes, your RPO is at least 5 minutes. If your DNS TTL is 300 seconds and your replica takes 40 seconds to promote, your RTO is at least 340 seconds. The math is merciless.
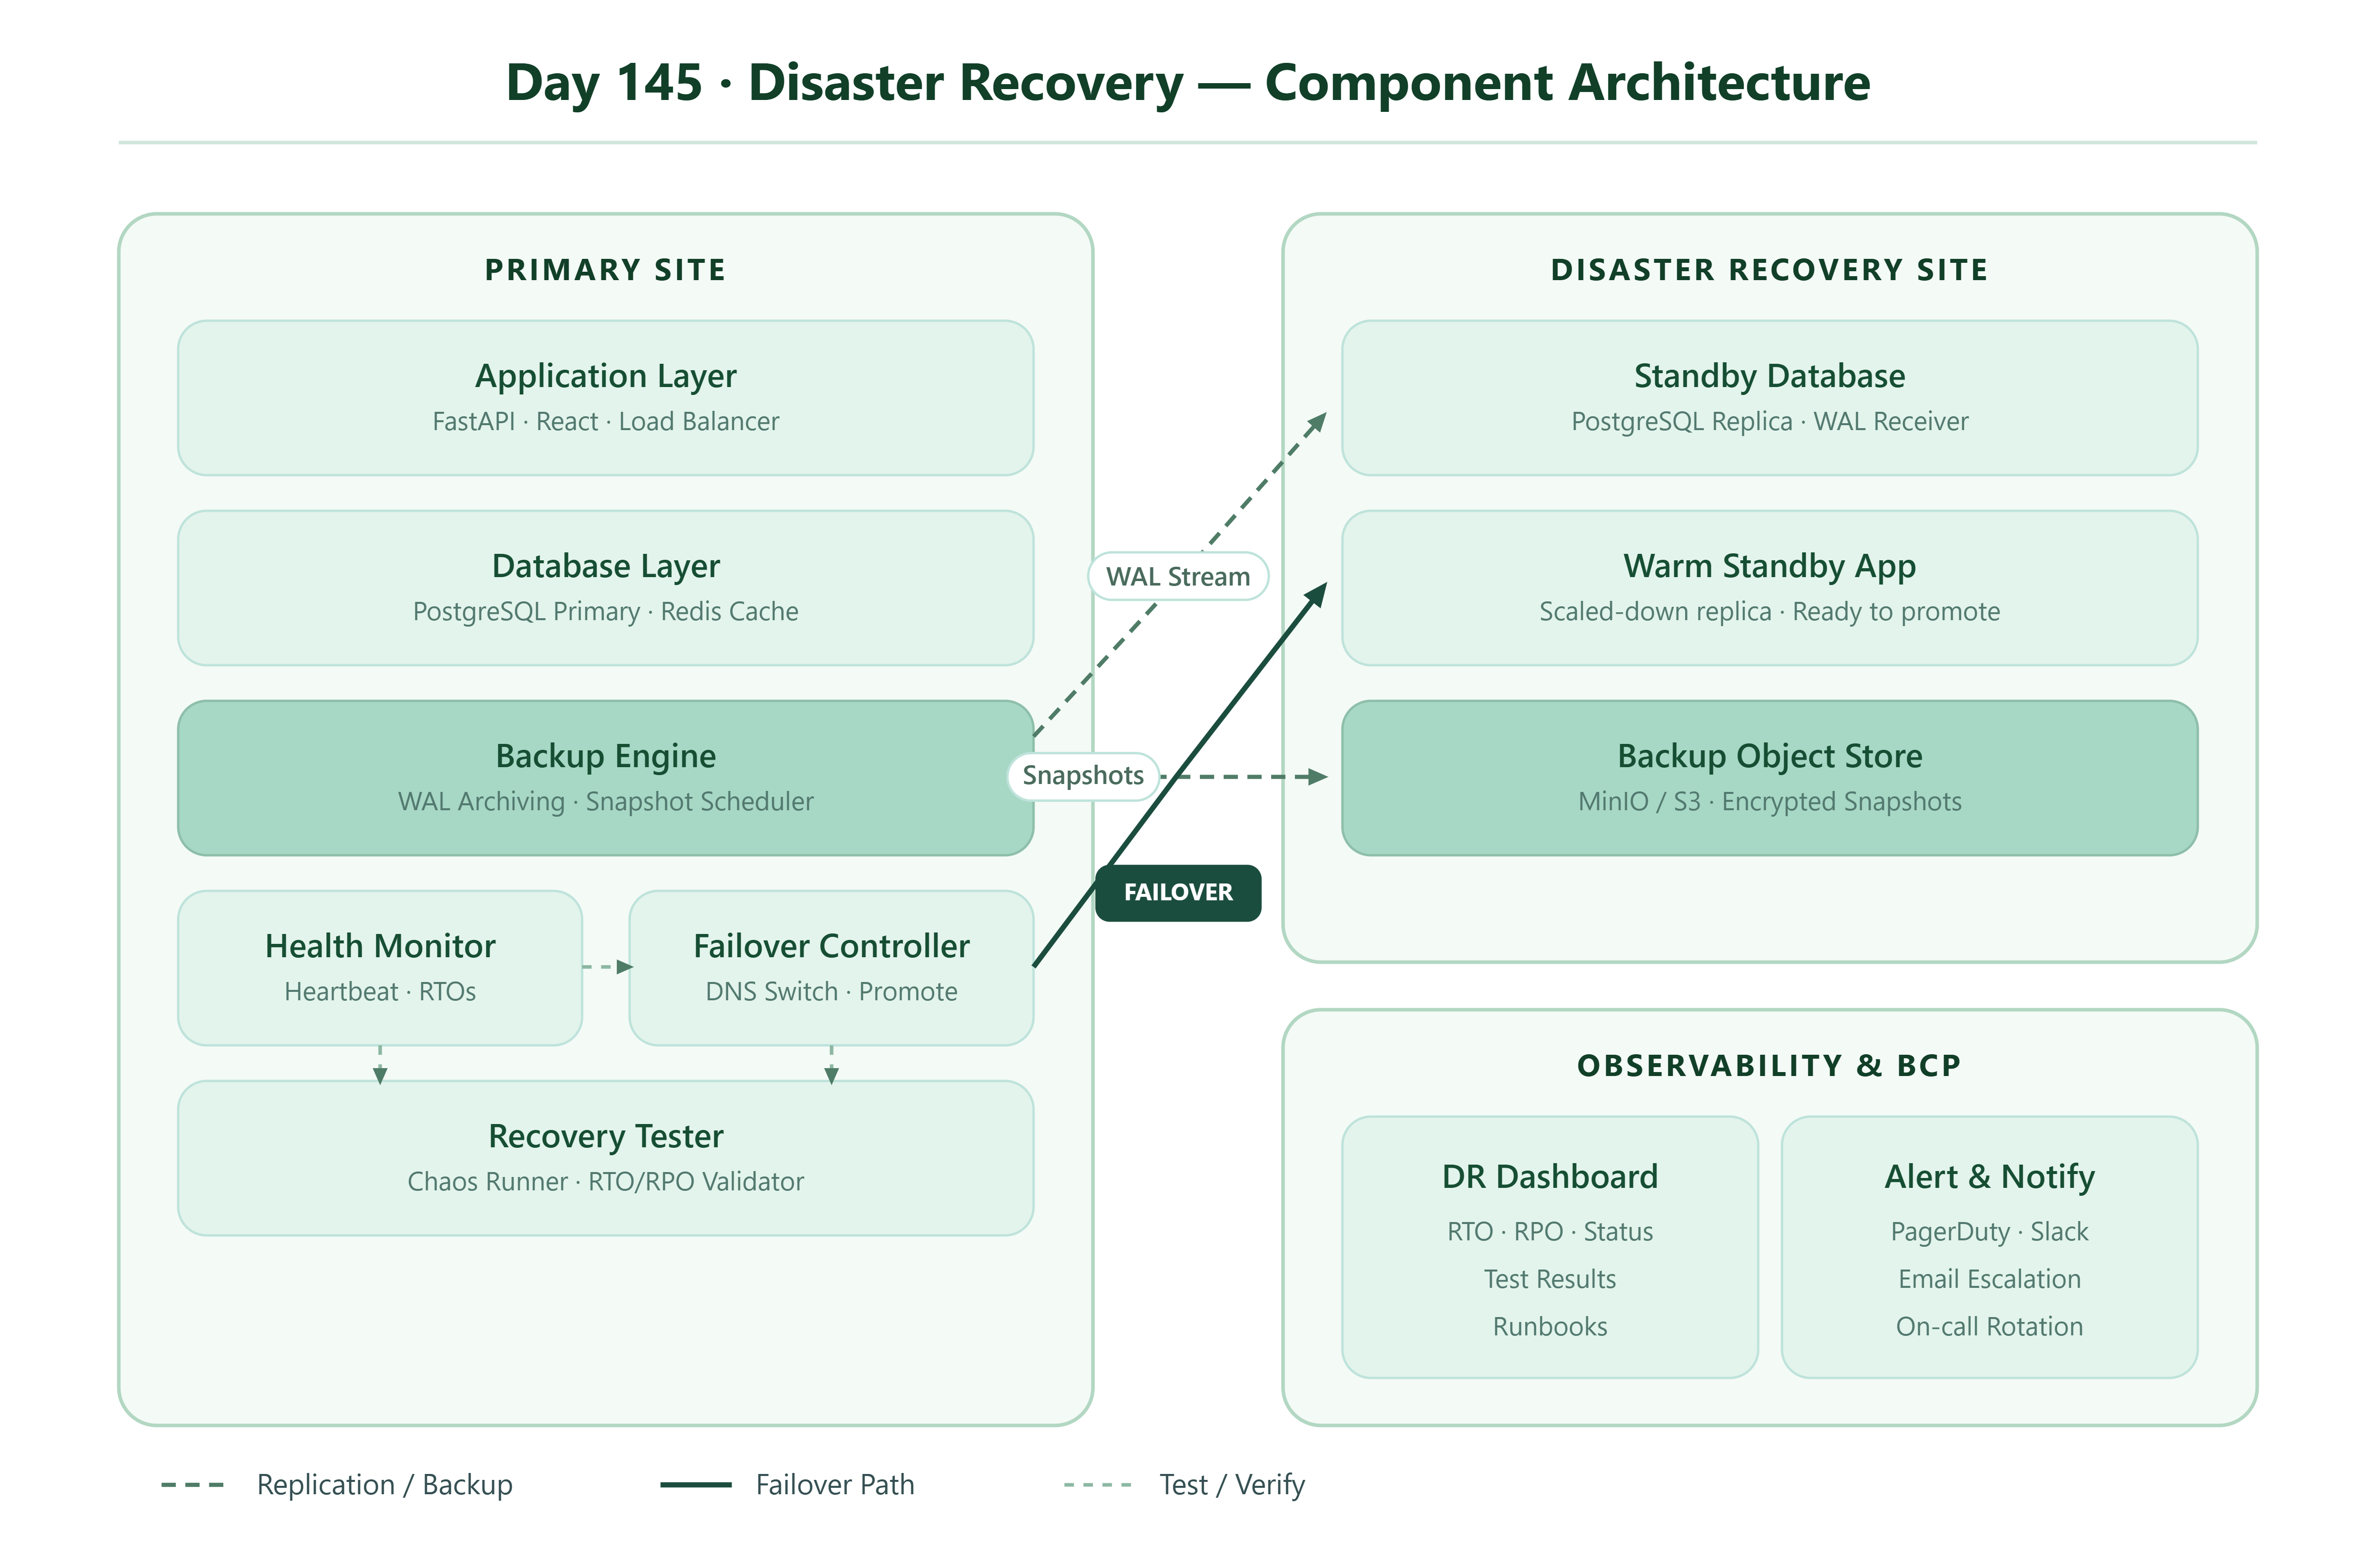
The system has three logical zones:
Primary Site runs your FastAPI backend, PostgreSQL primary, and Redis cache. The Backup Engine continuously ships WAL segments to MinIO every 60 seconds and runs full snapshots nightly. The Health Monitor pings a /health endpoint every 10 seconds with a 3-failure threshold before triggering the Failover Controller.
DR Site runs a PostgreSQL streaming replica (WAL receiver) and a warm-standby FastAPI instance. It receives WAL in near real-time (~2-5 seconds lag under normal conditions). On failover, the Failover Controller issues pg_promote() to the replica, flushes DNS, and the standby app begins serving traffic.
Observability Layer captures RTO measurements (timestamp of failure detected → timestamp service confirmed healthy at DR site), surfaces them on the dashboard, and archives every test run result.
This module has two jobs running as background threads:
WAL Archiving — PostgreSQL’s archive_command is configured to call a Python script that uploads each completed WAL segment to MinIO. Each segment is ~16MB and represents roughly 60 seconds of write activity. You get continuous backup with sub-minute RPO.
Snapshot Scheduler — Every hour (configurable), the engine calls pg_basebackup to take a full base backup, compresses it with pigz, and uploads to MinIO under a dated prefix. These are your recovery anchors.
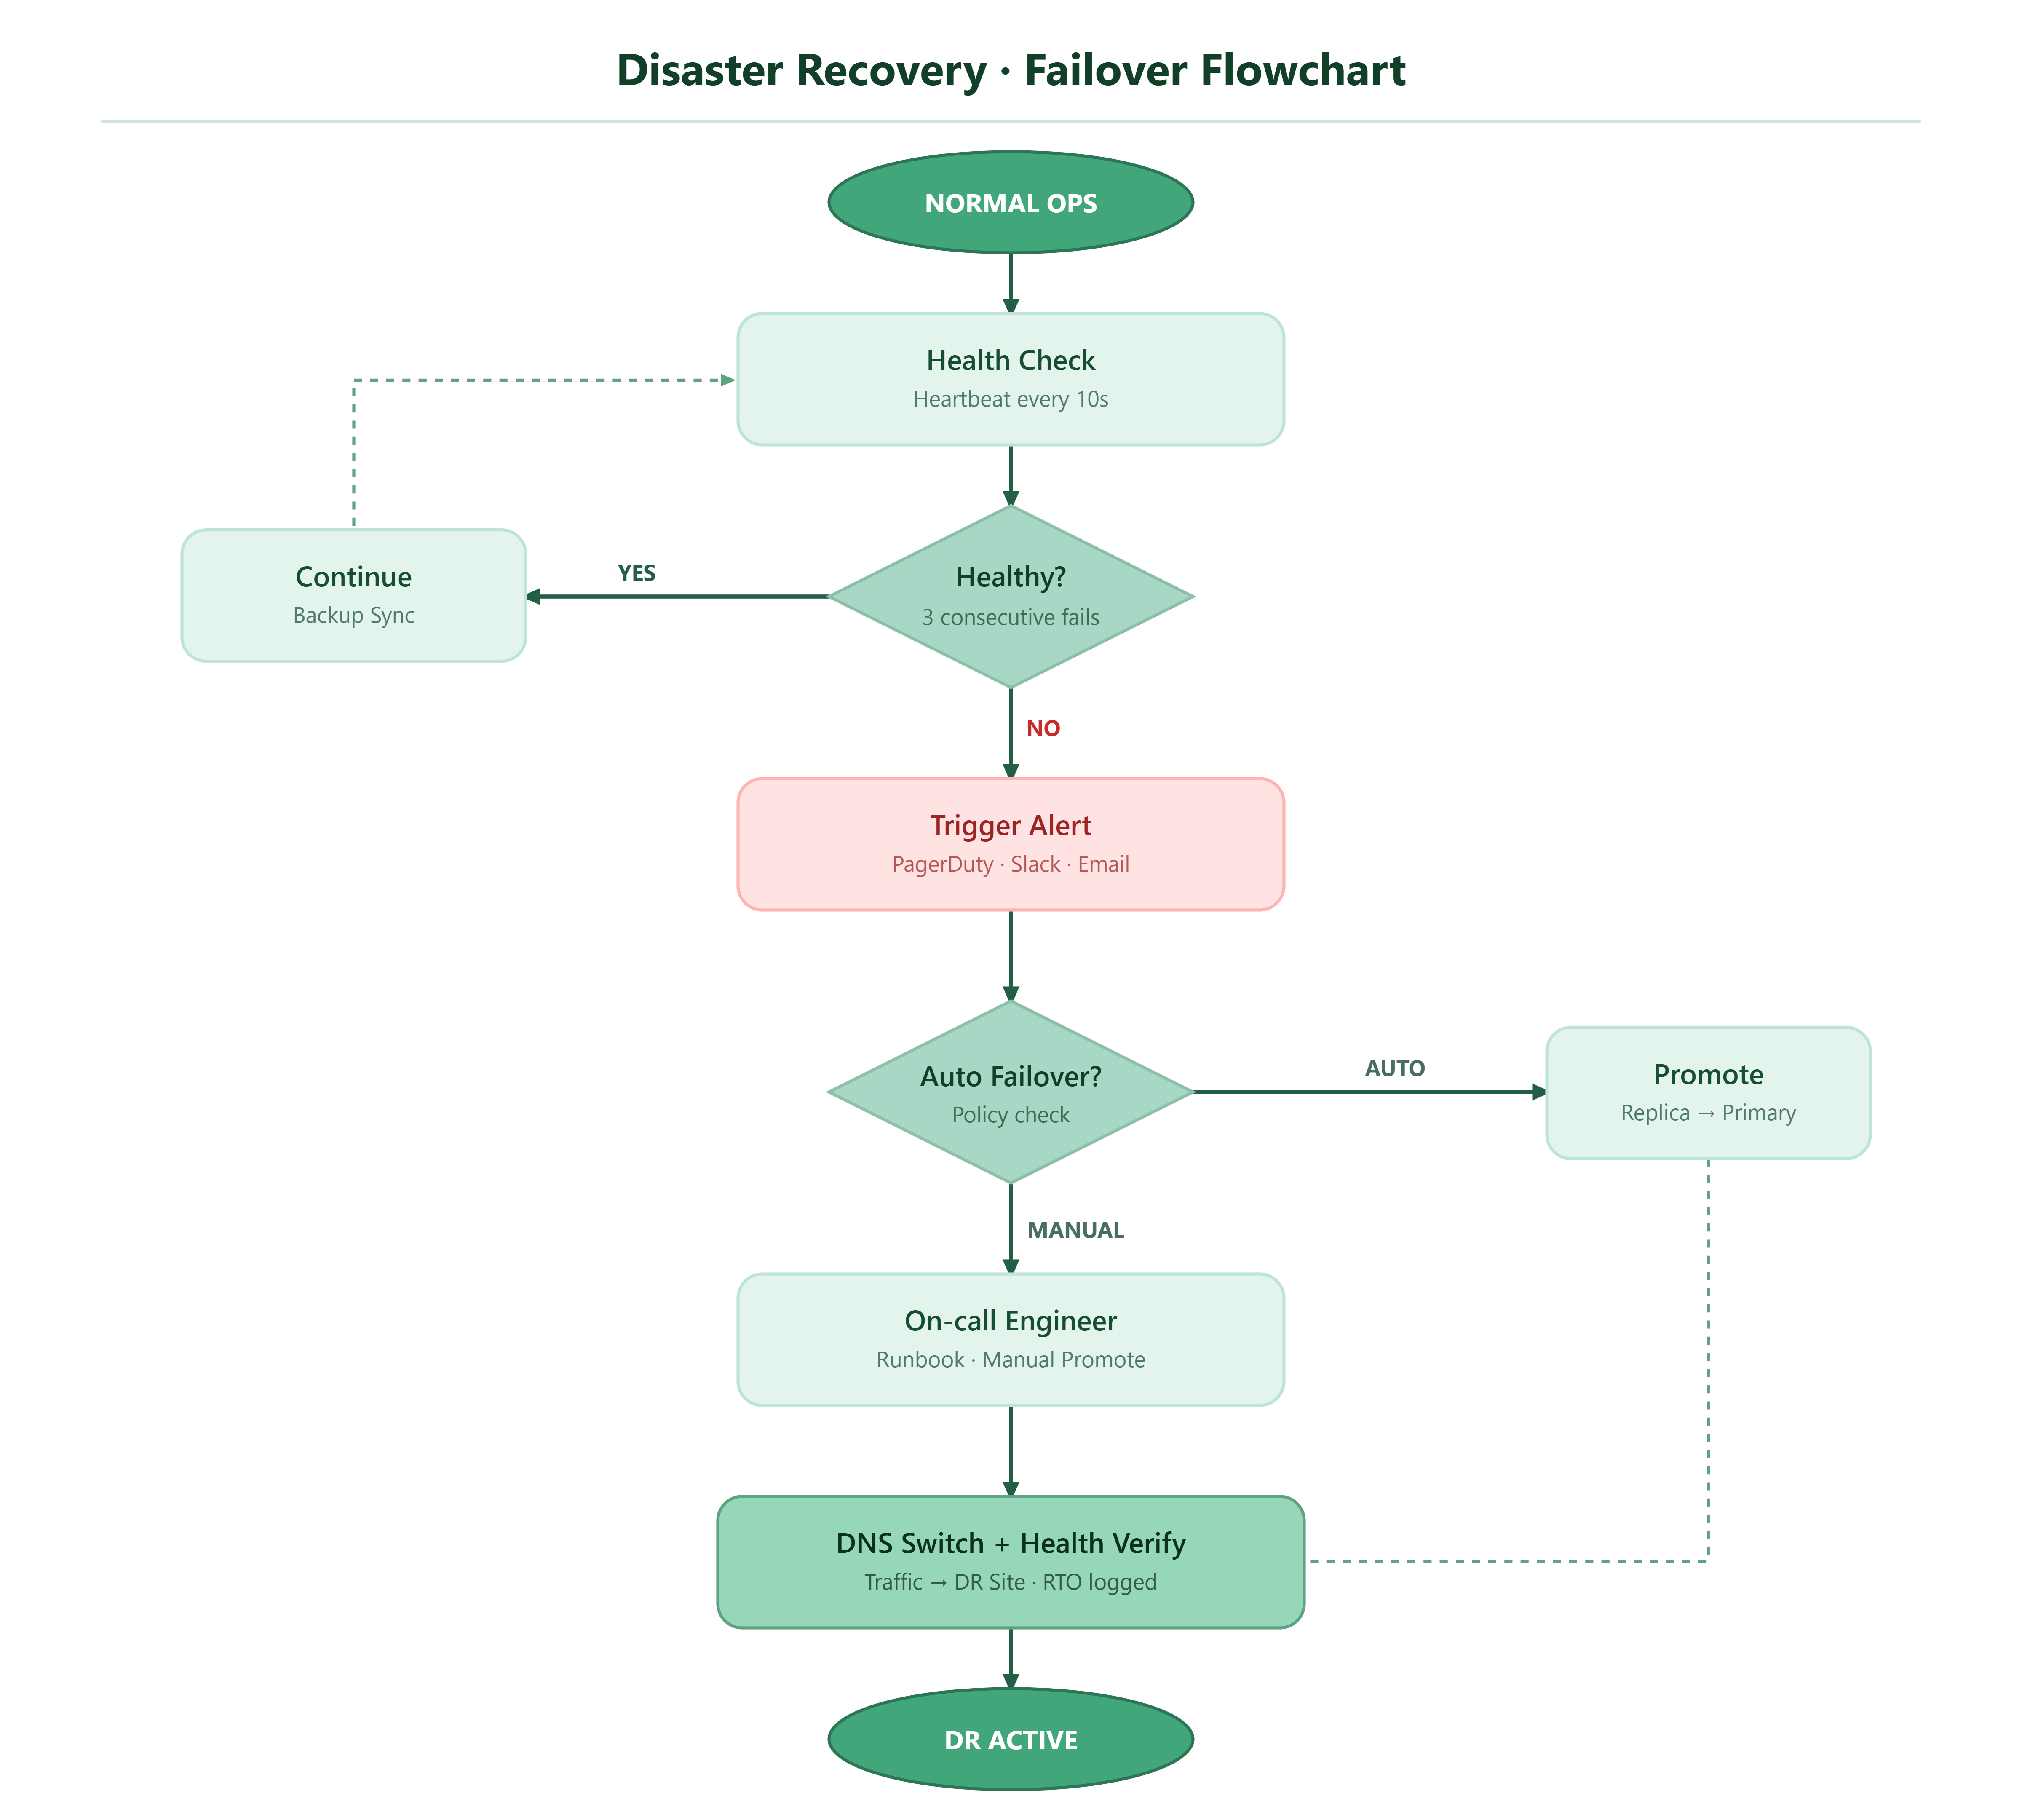
The monitor runs a tight loop: HTTP GET to the primary’s health endpoint every 10 seconds. Three consecutive failures flip the internal state machine from OPERATIONAL → DEGRADED → FAILOVER_INITIATED.
The Failover Controller then:
Issues
SELECT pg_promote()against the replicaWaits for
pg_is_in_recovery()to returnfalse(confirms promotion)Updates the service’s DNS record (or routing config) to point at the DR site
Logs the failover timestamp for RTO calculation
Fires a notification to the alert channel
This is the most underbuilt component in most real systems — and the most critical. A DR plan you’ve never tested is a hypothesis, not a guarantee.
The tester operates in two modes:
Chaos Mode — Deliberately kills the primary process, starts a timer, waits for the Health Monitor to detect failure, and measures the full time to service restoration at the DR site. This is your measured RTO.
Data Integrity Mode — Writes a known set of records to the primary just before simulating failure, then queries the DR site after promotion and verifies every record is present. The gap between “last write” and “earliest recoverable write at DR” is your measured RPO.
Both modes log results to a dr_test_results table and surface them on the dashboard.
Runbooks are only useful if engineers can find them at 3am. The BCP module stores runbooks as structured JSON documents in PostgreSQL, versioned and searchable. The API exposes /api/runbooks and /api/runbooks/{incident_type} so the dashboard can surface the right playbook the moment an alert fires.
Each runbook has: incident_type, severity, steps[], estimated_rto_minutes, owner, and last_tested_at. The last field matters — it’s how you prove the runbook isn’t stale.
The UI mirrors what you’d see in a real-time incident tool like PagerDuty or Grafana’s alerting view:
Status banner — green/amber/red based on current system state
RTO/RPO gauges — dials showing current measurements vs targets
Backup timeline — shows last N backup events with sizes and durations
Test results table — history of every recovery drill with pass/fail and measured RTO
Runbook panel — context-sensitive playbooks that appear when state is not OPERATIONAL
Failover trigger button — manual override with confirmation dialog
https://github.com/sysdr/infrawatch-fullstack-p/tree/main/day145/day145-dr
Day 144 observability stack running (or standalone PostgreSQL + Docker available)
Docker + Docker Compose installed
Python 3.11+, Node 20+
The start.sh script handles everything. Here is what it does and what you should see at each step.
Expected output (first 30 seconds):
The engine uses two threads:
WAL Thread — PostgreSQL’s archive_command is set to python3 /app/wal_archive.py %p %f. Every time Postgres finishes writing a WAL segment, it calls this command. The script uploads the file to MinIO bucket wal-archive.
Snapshot Thread — Every 3600 seconds (configurable via SNAPSHOT_INTERVAL_SECONDS env var), calls pg_basebackup -Ft -z -P and streams the tarball to MinIO bucket snapshots.
To verify WAL archiving is working:
Expected output:
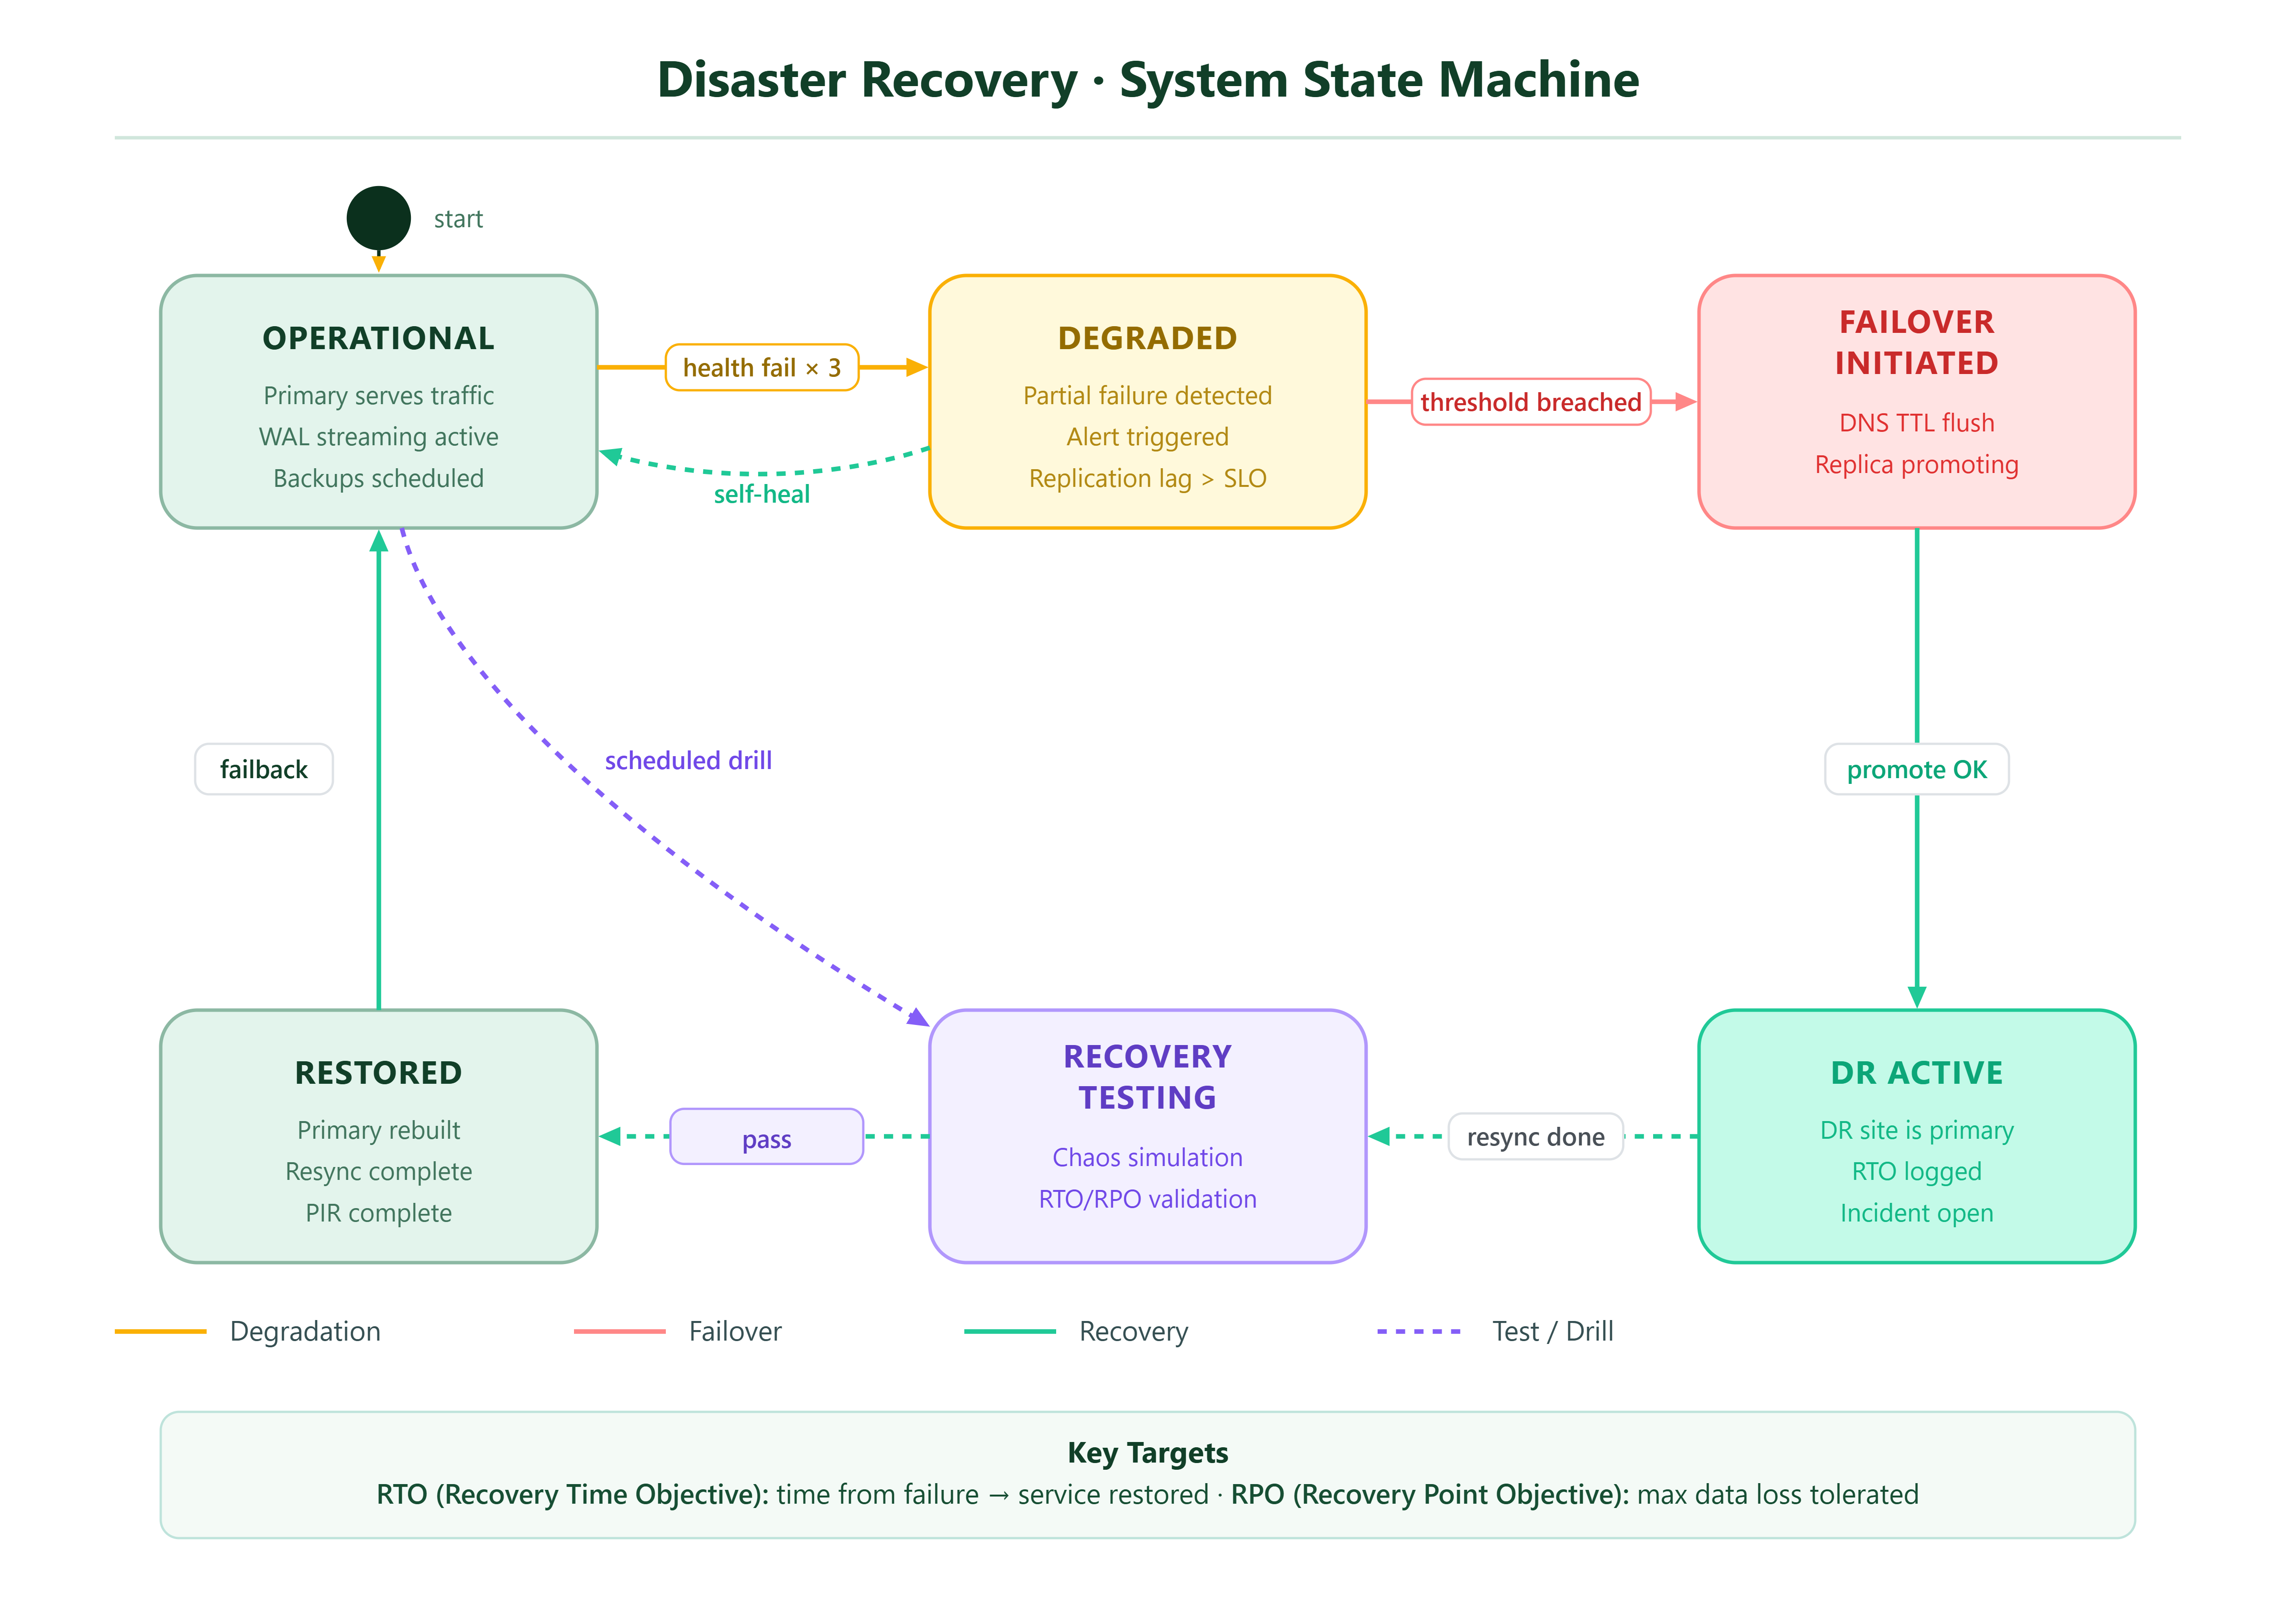
The monitor maintains an in-memory state machine with these transitions:
OPERATIONAL→ checks pass every 10sDEGRADED→ 1–2 consecutive failures; alert fired but no failoverFAILOVER_INITIATED→ 3rd consecutive failure; automatic promotion beginsDR_ACTIVE→ promotion confirmed; metrics loggedRESTORED→ primary rebuilt and resync complete; failback done
State is persisted to the system_state table so the dashboard survives restarts.
The tester does NOT use mocks. It:
Inserts 100 test rows into
recovery_test_datatable on the primaryRecords the timestamp of the last insert (
write_watermark)Calls
docker stop primary_postgres(or sends SIGTERM to the process)Starts a timer
Polls the DR endpoint until it returns HTTP 200
Queries
recovery_test_dataat DR site and counts matching rowsCalculates:
rto = time_to_200 - failure_detected_at,rpo = write_watermark - latest_row_at_dr
Expected: Frontend on http://localhost:5173, API on http://localhost:8000
Expected output:
Expected:
Watch real-time progress:
Expected state progression:
Open
http://localhost:3000
:
Status Banner — Should show green “OPERATIONAL” with uptime counter
RTO/RPO Gauges — Circular dials; RTO target 60s, RPO target 30s. After test run, actual values appear.
Backup Timeline — Table showing last 10 WAL archives and snapshots with sizes (should see rows within 60 seconds of startup)
Run DR Test button — Click “Run Chaos Test”. Watch the banner turn amber, then red during failover, then green with “DR ACTIVE” label.
Test Results — After test completes, a row appears in the history table with measured RTO, RPO, and pass/fail against your SLOs.
Runbook Panel — When system is not OPERATIONAL, the relevant runbook auto-loads in the side panel.
Expected:
Symptom Cause Fix Replica not streaming pg_hba.conf missing replication entry start.sh patches this automatically MinIO 403 on upload Bucket policy Script creates buckets with mc mb on startup Failover not triggering Health endpoint returning cached 200 Check HEALTH_CHECK_CACHE_TTL=0 env var RTO > 60s DNS TTL too high Script sets TTL to 5 seconds via nginx upstream reload
Endpoint Method Description /api/system/state GET Current DR state machine state /api/backups GET List of backup events /api/replication/status GET Real-time replication lag /api/recovery/run-test POST Trigger chaos or integrity test /api/recovery/results GET History of all test runs /api/runbooks GET All BCP runbooks /api/runbooks/{type} GET Runbook for specific incident type /api/failover/trigger POST Manual failover with auth token
No posts
Comments
Nothing yet. Say the first thing.
Sign in to join the conversation.