
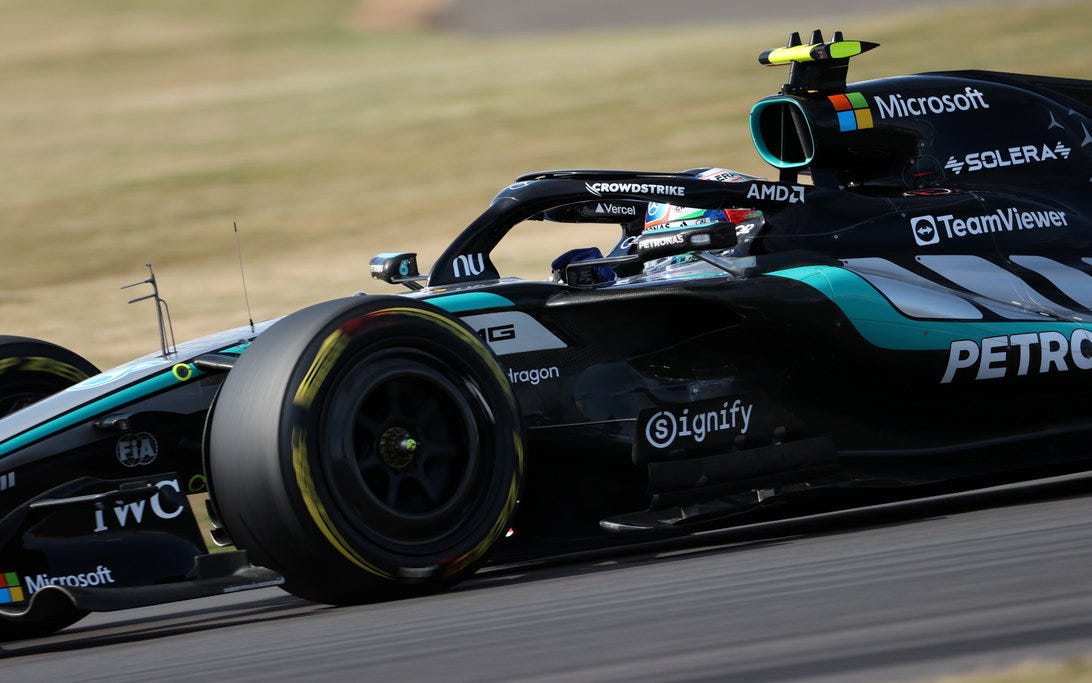
F1 drivers experience roughly 2 to 3G during normal 2026 racing laps, with braking events averaging 2.0 to 2.3G across the heaviest stops of the season. Spa produced the hardest braking zone measured so far, at 2.34G. The 2026 cars generate lower peaks than the 6G-plus figures quoted for the previous generation, because they run lighter and carry less downforce.
Spa-Francorchamps produced the hardest braking of the 2026 season so far. The top five qualifiers there averaged 2.34G through the entire braking zone into the Bus Stop chicane, slowing from 275 km/h to 93 km/h in 2.08 seconds.
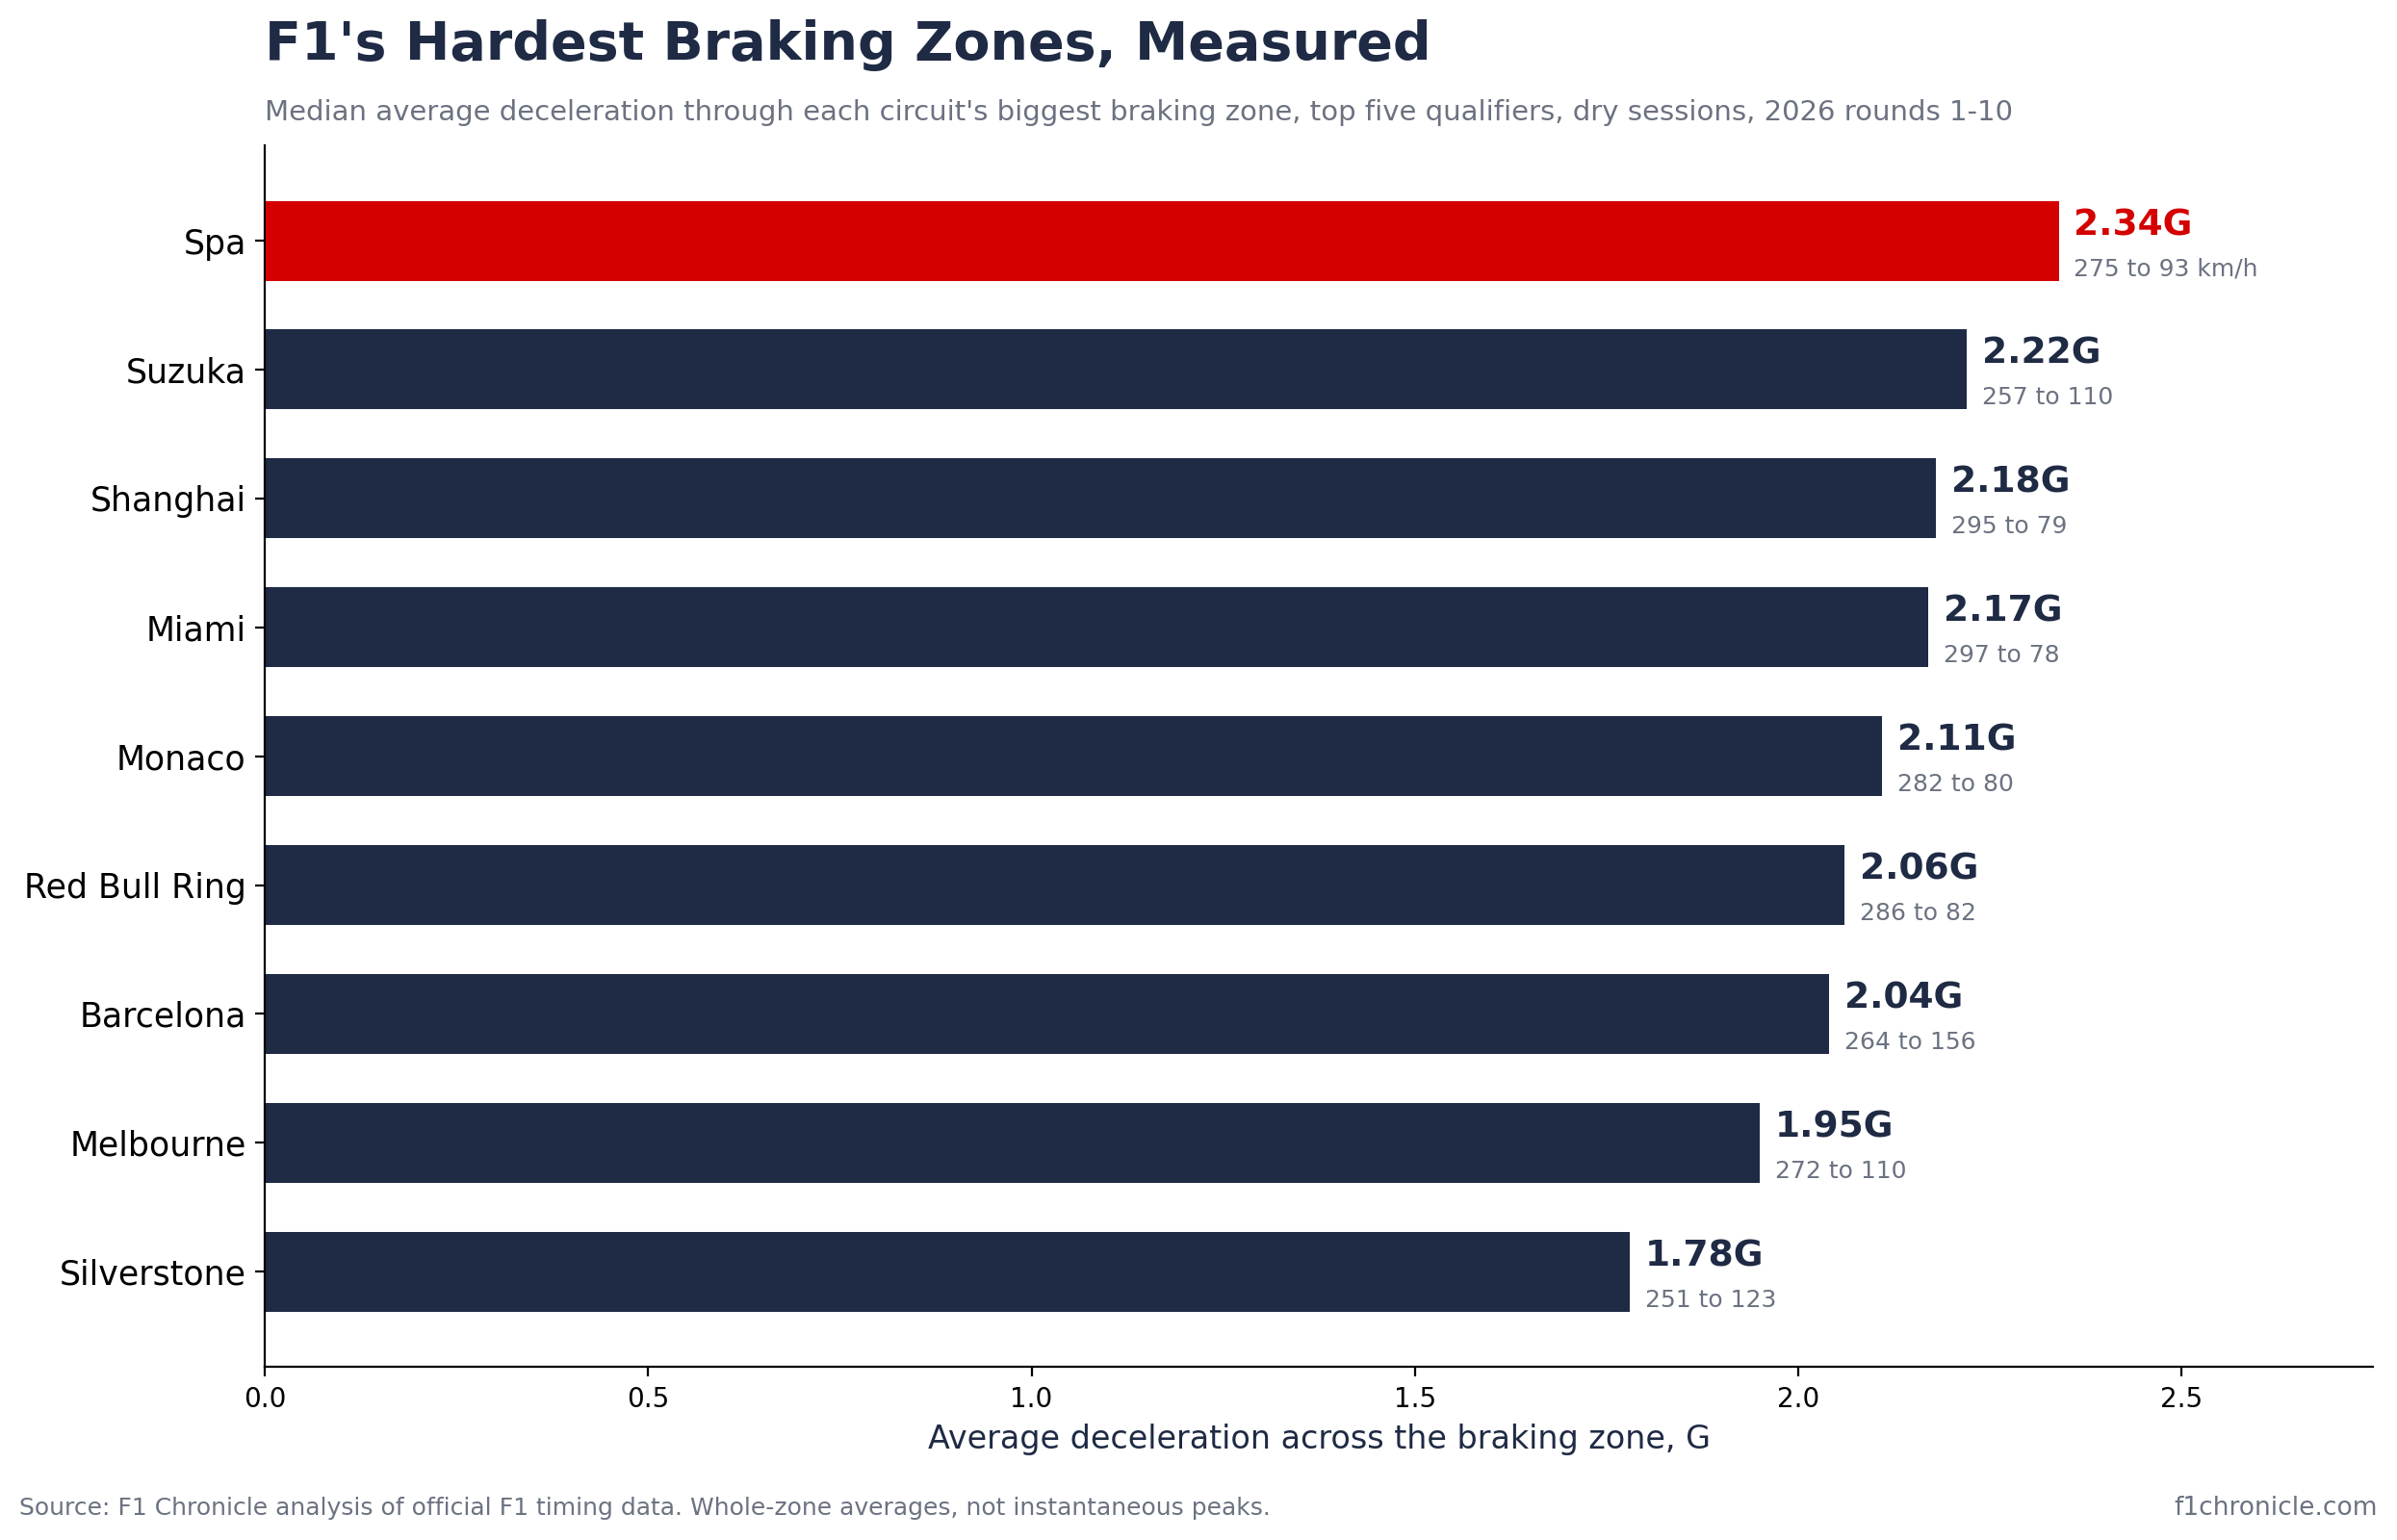
Every figure in that graphic comes from F1 Chronicle’s analysis of official F1 timing data for the 2026 season: the median deceleration across the full braking zone for the top five qualifiers at each round, taken from dry sessions across rounds one to ten. That whole-zone average is a deliberate choice, and it explains why these numbers read lower than the peak figures quoted elsewhere. Instantaneous peak deceleration spikes higher for a fraction of a second at the sharpest point of a stop, but qualifying telemetry of this kind cannot responsibly be used to claim a specific peak. The averages here are lower because they measure something different, not because they are less accurate.
G-force measures acceleration against the pull of gravity. One G equals the force a stationary body feels at rest on Earth; braking, cornering or accelerating at 2G means the body is being pushed with twice its own weight. A road car braking hard at a red light pulls about 1G. An F1 car under braking pulls more than double that.
F1 generates such high g-force because of downforce. The front and rear wings, floor and diffuser press the car onto the track at speed, which lets the tyres generate far more grip than a road car’s. More grip means the car can brake later, corner faster and accelerate harder, and every one of those forces registers as g on the driver’s body and neck.
Belgian Grand Prix standing-start telemetry from the top five finishers shows a 2026 car accelerating at 1.0G on average from 0-100 km/h, rising to 1.4G from 100-200 km/h. That climb is the counterintuitive part. A road car’s hardest acceleration comes off the line, when the engine’s torque advantage is greatest, and there is nothing left to give as speed builds. An F1 car does the opposite. Downforce grows with speed, and grip grows with it, so a 2026 car accelerates harder at 150 km/h than it does leaving the grid, even though the engine produces roughly the same power throughout. F1 Chronicle’s breakdown of how much horsepower an F1 car has covers where that power comes from; this is what the car does with it once the tyres have grip to use.
Spa sits at the top of the list at 2.34G, with Suzuka close behind at 2.22G and Shanghai at 2.18G. Miami (2.17G), Monaco (2.11G) and the Red Bull Ring (2.06G) fill the middle of the field, followed by Barcelona at 2.04G and Melbourne at 1.95G. Silverstone produced the gentlest of the nine measured stops, at 1.78G, for its biggest braking zone of the lap.
Even Monaco, the slowest circuit on the calendar by average lap speed, produces a serious braking event: cars arrive at the chicane out of the tunnel at 282 km/h and shed most of that in a 2.11G stop. Canada does not appear on this list. That weekend fell outside the dry-session criteria this analysis uses, after rain affected track conditions.
The 2026 cars are lighter and carry less downforce than the generation they replaced, and both changes show up directly in the g-force numbers. The minimum weight for 2026 is 768kg, about 30kg lighter than under the previous regulations. Cornering downforce, in the cars’ highest-downforce Z-mode setting, runs roughly 30 percent below the best 2025-specification cars. The 2026 regulations also introduced active aerodynamics, with drivers switching the wings between a low-drag setting on straights and a high-downforce setting through corners, so the load on the car, and on the driver, changes constantly through a single lap rather than sitting at one fixed level.
None of this makes the figures quoted for 2022-2025 cars wrong. Those cars were heavier, ran more downforce, and produced the higher peak numbers still repeated across the web. They are describing a car that no longer exists on the grid.
Race conditions push the numbers lower again. Drivers brake earlier and softer in the race than they do in qualifying, easing off sooner to harvest energy for the hybrid system rather than attacking the limit on every lap. F1 Chronicle’s Belgian Grand Prix telemetry analysis measured lift-and-coast beginning around 50 metres earlier in the race than in qualifying across the lap’s braking zones, one of the reasons the g-force a driver feels on Sunday sits below even the qualifying averages used in this analysis.
Crash forces sit in a different category from racing g. They are a single violent spike rather than a sustained load, and the highest figures on record dwarf anything a driver feels in normal use of the car.
Romain Grosjean’s fireball crash at the 2020 Bahrain Grand Prix remains the highest confirmed figure in modern F1. The FIA’s investigation into the accident found Grosjean experienced a peak of 67G when his car struck the barrier. Max Verstappen’s high-speed crash at the 2021 British Grand Prix, after contact with Lewis Hamilton on the opening lap, registered 51G.
Further back, David Purley survived an estimated 179.8G in a 1977 crash at Silverstone, decelerating from 173 km/h to a complete stop in just 66 centimetres after his throttle stuck open, among the highest g-loads a person has ever survived in a recorded incident. Jules Bianchi’s fatal crash at the 2014 Japanese Grand Prix has no official g-force figure attached to it. The FIA’s ten-person accident panel found instead that his car struck a 6,500kg recovery vehicle at around 126 km/h, an impact so severe the panel concluded no realistic safety structure could have prevented what it called non-survivable decelerations.
These numbers explain why F1 keeps investing in cockpit safety even as racing g stays flat or falls. A car only needs to protect a driver from 2 to 3G for 300 kilometres of racing. It has to protect them from more than 60G in the fraction of a second when everything goes wrong.
Neck and core strength are non-negotiable for an F1 driver, because sustained cornering and braking repeatedly pull the head and helmet sideways and forward for the length of a race. Drivers build that strength through rowing, cable work and isometric neck training, alongside the cardio base needed to keep those muscles firing deep into a two-hour race. Many teams also use G-force simulators and centrifuge-style rigs so drivers get used to the physical sensation of sustained lateral load before they ever feel it in the car.
The HANS device, short for head and neck support, is the piece of safety equipment that makes the sport’s crash forces survivable at all. It secures the helmet to a collar worn around the driver’s shoulders, so that in an impact the head is restrained rather than snapping forward on the neck alone. Every driver on the 2026 grid wears one, a direct response to exactly the kind of forces measured in the Grosjean and Purley crashes above.
Roughly 2 to 3G in normal racing, rising to about 2.34G under the hardest braking measured in the 2026 season, at Spa.
The highest confirmed figure is 67G, from Romain Grosjean’s 2020 Bahrain crash, per the FIA’s investigation. That is a crash impact, not a sustained racing load.
It depends on the duration and direction of the force. David Purley survived an estimated 179.8G in a 1977 Silverstone crash lasting a fraction of a second. Grosjean’s 67G in 2020 and Verstappen’s 51G at Silverstone in 2021 both sit well below that figure but far above anything a driver feels in normal racing.
No. Fighter pilots sustain higher g-force in manoeuvres, up to around 9G with a G-suit and training, compared with the 2 to 3G F1 drivers pull in normal racing. F1’s forces are higher only in a crash, where impacts can exceed even a fighter jet’s structural limits.
Sources
Romain Grosjean accident findings published by FIA with fiery Bahrain GP crash measured at 67G – Sky Sports
Martin Brundle: Analysing and explaining the Lewis Hamilton, Max Verstappen British GP collision – Sky Sports
Jules Bianchi: Key findings from FIA’s crash report – BBC Sport
David Purley: The fighter – Motor Sport Magazine
Canadian GP: Rain set to cause ‘chaos’ in Sunday’s race – Sky Sports
Want more F1Chronicle.com coverage? Add us as a preferred source on Google to your favourites list for the best F1 news and analysis on the internet.
For more F1 news and videos, follow us on Microsoft Start.
New to Formula 1? Check out our Glossary of F1 Terms, and our Beginners Guide to Formula 1 to fast-track your F1 knowledge.
No posts
Comments
Nothing yet. Say the first thing.
Sign in to join the conversation.