
I postponed writing this post for a long time as I wanted to get everything right and didn’t want to miss out on any important detail. But as the project is now in a satisfying state and has proven to be valuable for our team for quite some time now, the time is right to write about how I vibe-coded a dashboard to track our first KPI for our internal design system.
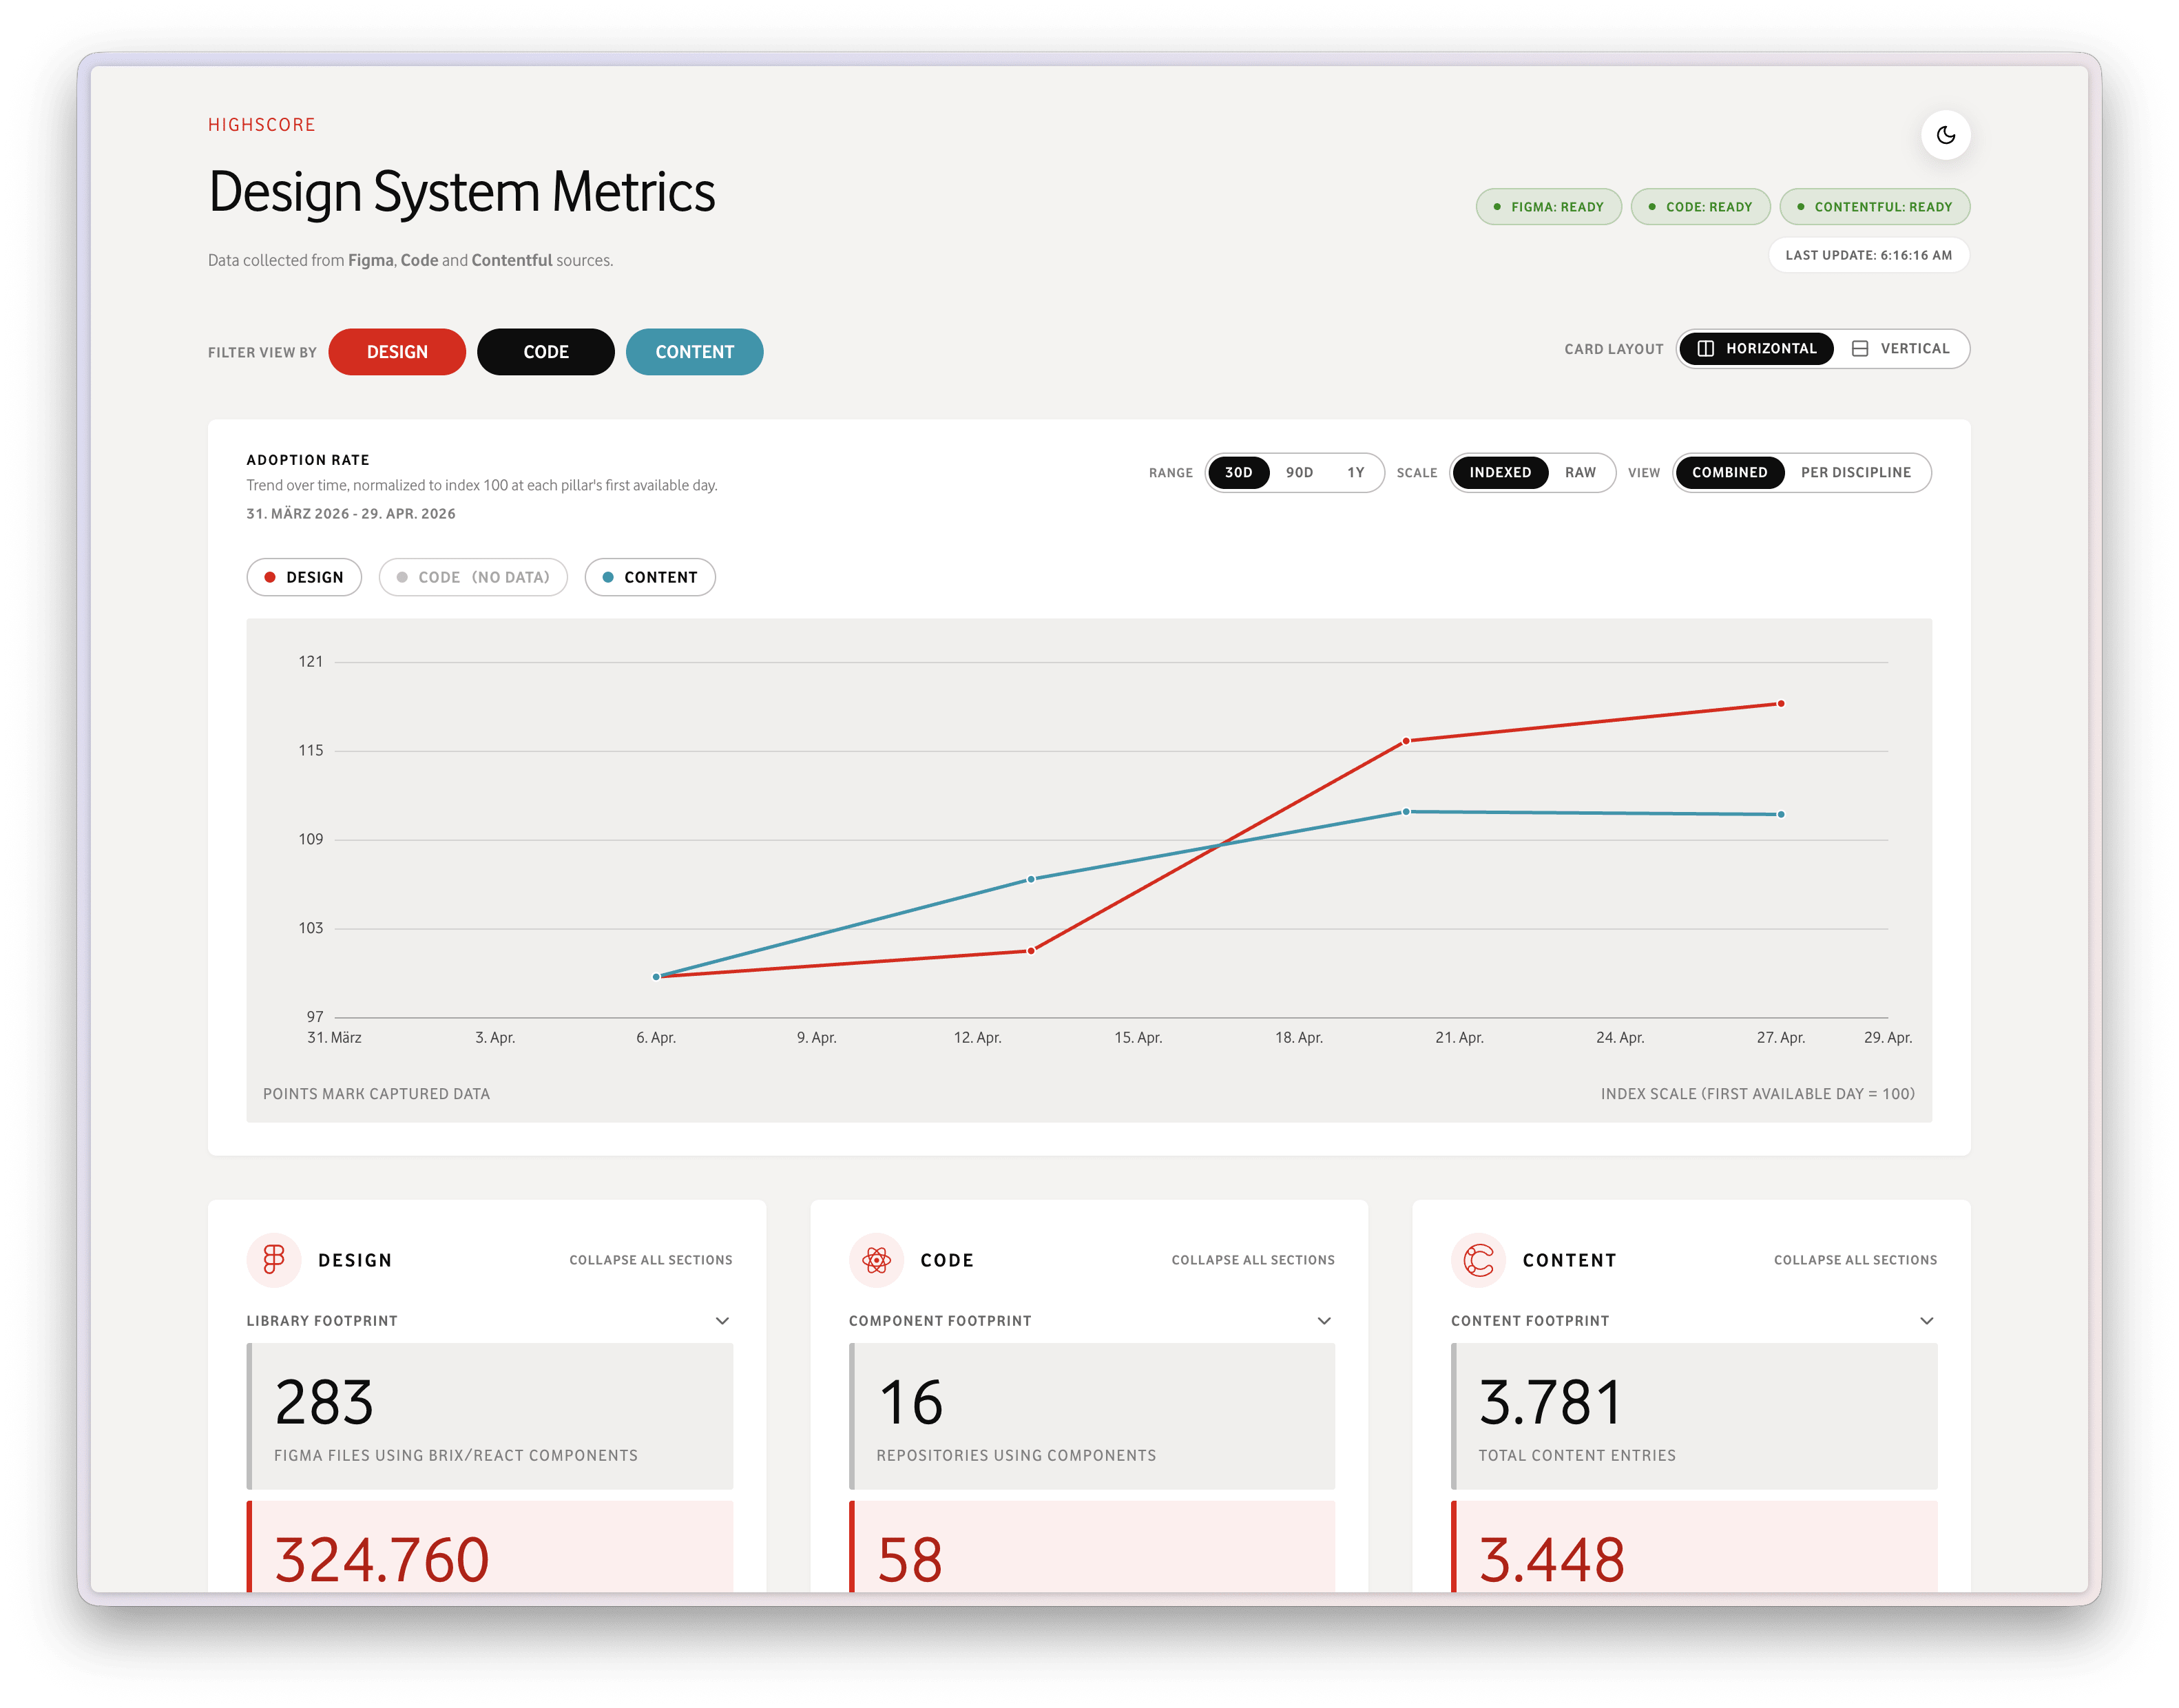
I don’t want to share the URL publicly as it is an internal tool, but what I do want to share is how I arrived at this point and why it was so much fun to get there.
This was the first serious project I created with the help of AI.
On our team’s roadmap was the request to track our KPI with regard to adoption rate and consumption of our new design system. Initially we planned for each discipline to tackle its own area: Design, Dev and Content Management. But as resources were scarce – since we were in the middle of moving to a React tech stack and Contentful as our new CMS at the same time – tracking our KPIs suddenly became a side quest.
I then took the opportunity to initially build a prototype in code to see how we could display the different numbers that we ideally wanted to aggregate from our distinct sources: Figma, GitHub or live code and Contentful.
Thanks for reading Everything ⚡️ Now! This post is public so feel free to share it.
First I investigated and researched which API endpoints we would need to plug into, how to access them and whether we actually had the access to connect to those different sources.
With all that cleared up, I straight up downloaded and opened Codex because OpenAI had just released the Mac app and offered (and still offers?!) a generous free token allowance to get your first project started.
In my mind I still thought about building a prototype that I would hand over to dev as soon as I entered serious coding territory, but I had to use the right stack and tools from the start so the hand-off would be easier once more capacity became available.
With GPT-5.3 Codex as the newly released model, I told Codex to come up with a plan for a dashboard that could visualize our KPIs in the areas of design, development and content in a three column layout so we could ideally compare numbers across disciplines. It should be built in React, using Tailwind as a base framework (because our internal components are not yet machine-readable) and draw on our branding and design by referencing our Figma component library and foundations via MCP.
I quickly got a compelling first draft which ignited a spark in me to investigate on my own how to implement the connection to the Figma REST/Library Analytics and Contentful Content Management API; and the project grew from a basic visual prototype to a standalone and fully deployed web app with real data in a data base, cron jobs and state management on Vercel.
While the first version was almost exclusively developed in Codex, Terminal and Visual Studio Code, I later let Anthropic’s Claude Code run over the project – with its better frontend-design plugin/skill – to polish the project in the home stretch.
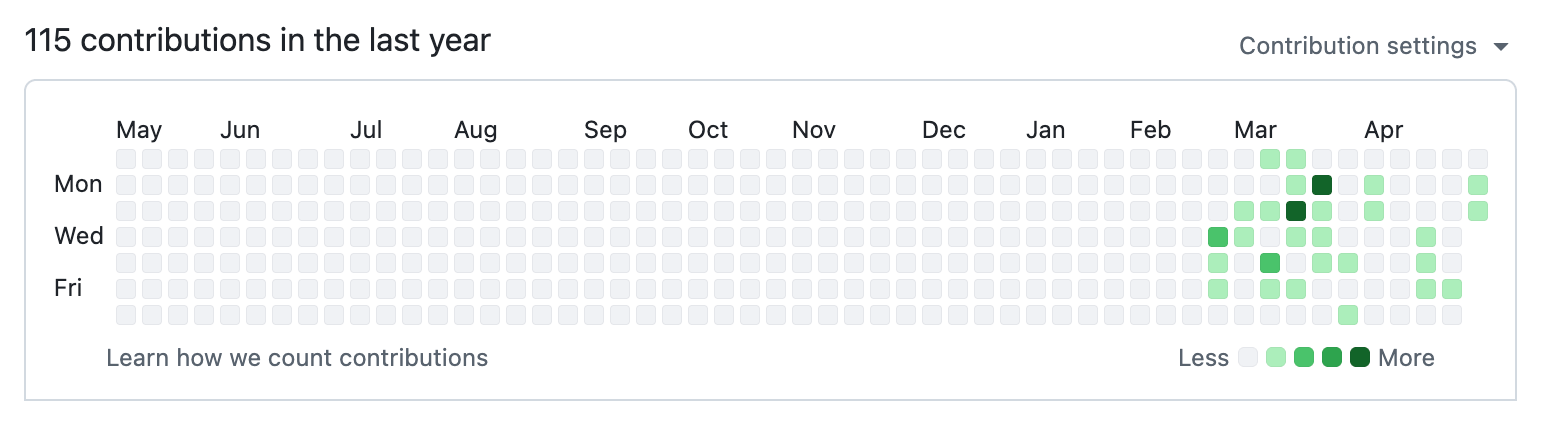
Planned as a few days of exploration and prototyping, it ended up as a week-long pet project with so much fun and personal learning and growth – I can highly recommend trying it yourself.
AI is only a tool – use your ideas and skills to give it a purpose.
Let me know in the comments or via reply if you want to dig deeper into the topic or if there is anything you feel is missing, and I will be happy to help.
Comments
Nothing yet. Say the first thing.
Sign in to join the conversation.