
A lot happened in the energy world this week. PJM’s latest capacity auction results were released, Lazard released its latest Levelized Cost of Energy Report, and New York imposed a one-year moratorium on data centers. While these are interesting events, there is plenty of time to write about them in the future.
This week, we want to turn our attention to something more timely.
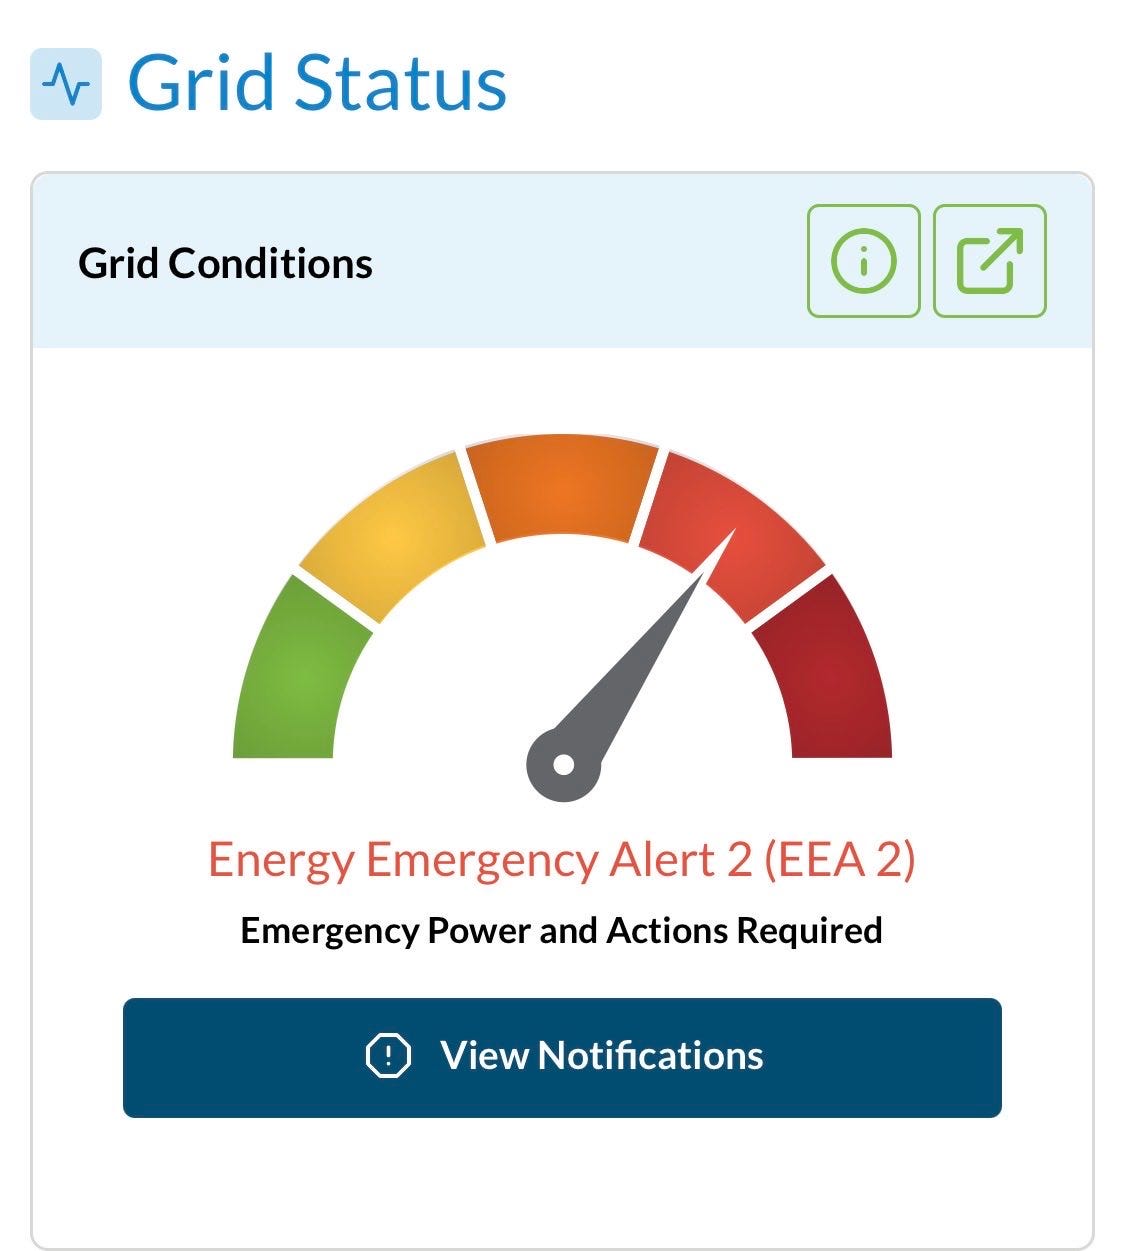
As if to welcome the nation’s utility regulators to Minneapolis for the National Association of Regulatory Commissioners (NARUC) summer meeting next week, MISO declared an Energy Emergency Alert Level 2 on Wednesday, July 15th, citing forced generation outages, above-normal temperatures, and higher-than-forecasted load.
Interestingly, MISO conveniently forgot to mention that its wind resources, which constitute 33,687 megawatts (MW) of installed capacity and 15.6 percent of the region’s total nameplate capacity, produced almost nothing (a mere 5 percent of their potential output) when demand was highest.
In this edition of Energy Bad Boys, we dive into wind’s disappearing act and some more interesting findings from MISO’s exciting Wednesday afternoon. And if you’ll be around for NARUC, Isaac will be there, so respond to this email if you’d like to catch up if you’re in town.
A quick note: This piece is free, but if you’ve found value in our work, please consider becoming a paid subscriber. Your support helps us reach our goal of reaching the Top 10 on the leaderboard.
Before we get into the major points, it helps to know that Energy Emergency Alerts, or EEAs, are declared when MISO expects or experiences operating reserves to be lower than necessary to maintain normal operations.
MISO has mercifully streamlined its emergency classifications, and the graphic below illustrates the steps taken at each EEA level, from curtailing exports to committing emergency demand response and making emergency energy purchases, ultimately culminating in load shedding in the event of an EEA3.
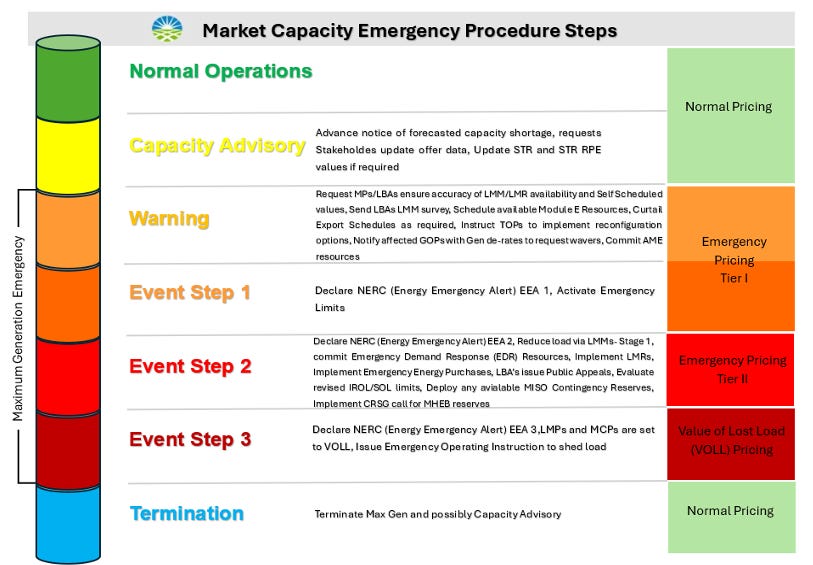
These emergency tiers also affect electricity prices, but that is a complex topic we will address at a later date.
In a surprise to exactly none of our readers, the data show nuclear, coal, and natural gas punched above their weight during the heat wave, and wind and solar punched below it.
The primary y-axis in the graph below shows the installed capacity of each resource as a percentage of the total installed capacity in MISO, per the May 2026 EIA Form 860m release. The secondary y-axis shows the percentage of MISO’s energy that the resources accounted for from July 9th through July 15th, using MISO generation data.
We determined that nuclear accounts for just 5.8 percent of the total installed capacity in MISO but provided 12.3 percent of the energy consumed during this time. Coal and natural gas account for 21.6 percent and 39.3 percent of installed capacity, respectively, and produced 27.6 percent and 44.1 percent of the region’s energy needs.
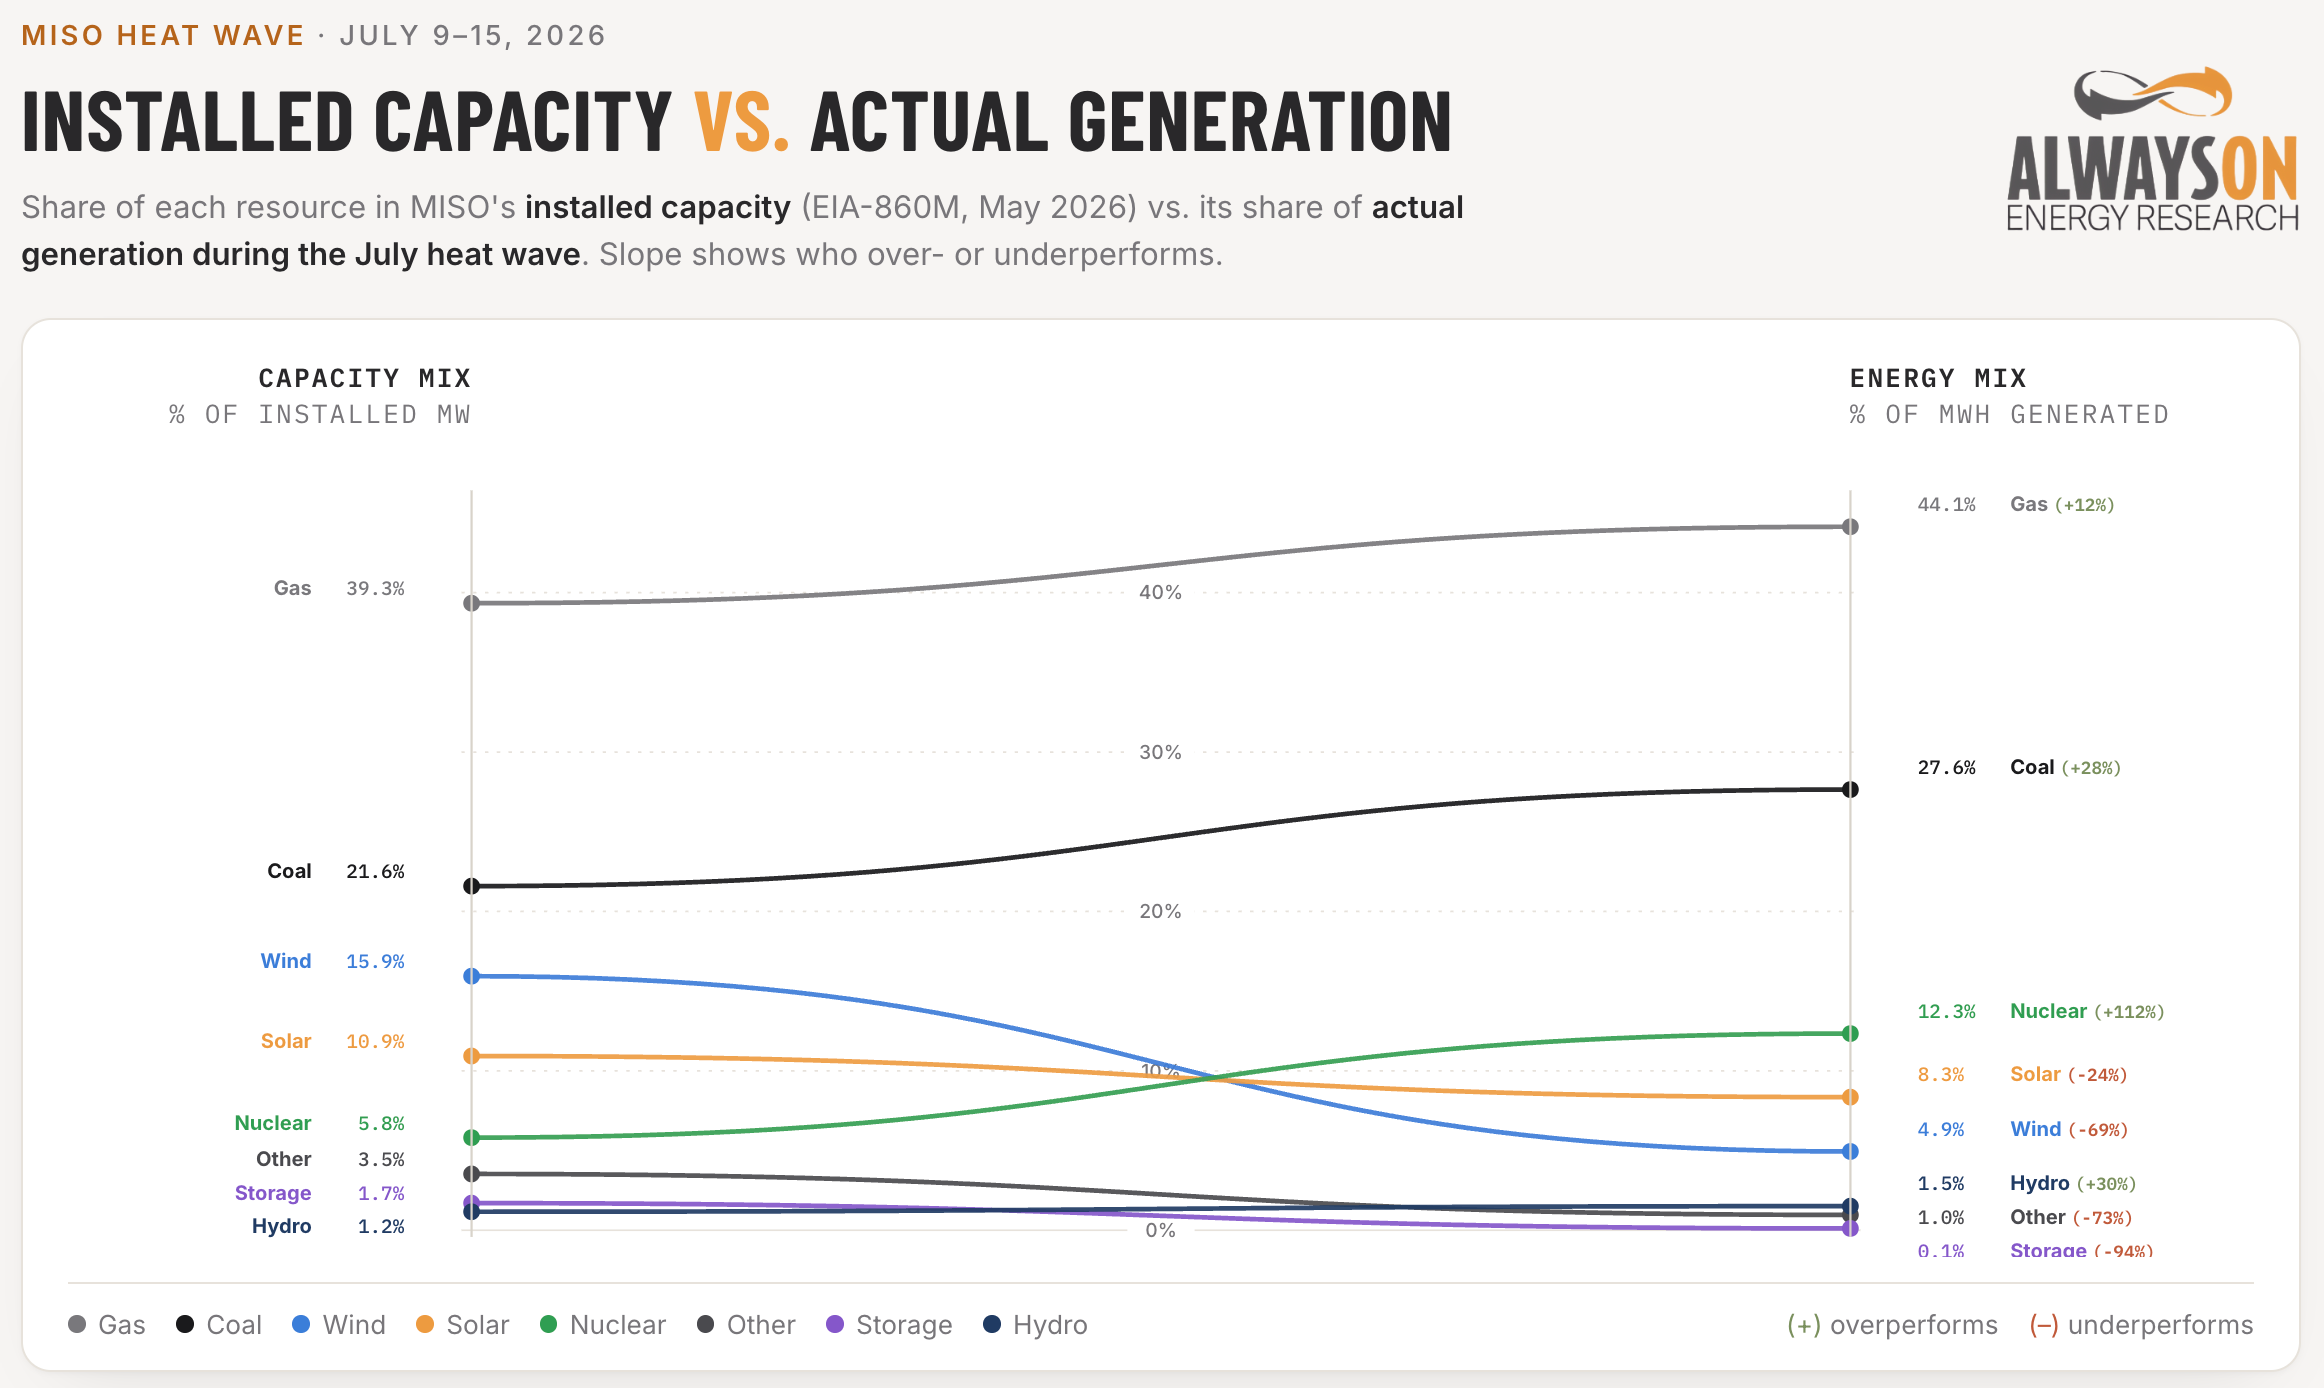
On the other hand, while wind accounts for 15.9 percent of installed capacity, it produced just 4.9 percent of the energy consumed during the heatwave. Solar fared better, producing 8.3 percent of the energy while making up 10.9 percent of capacity.
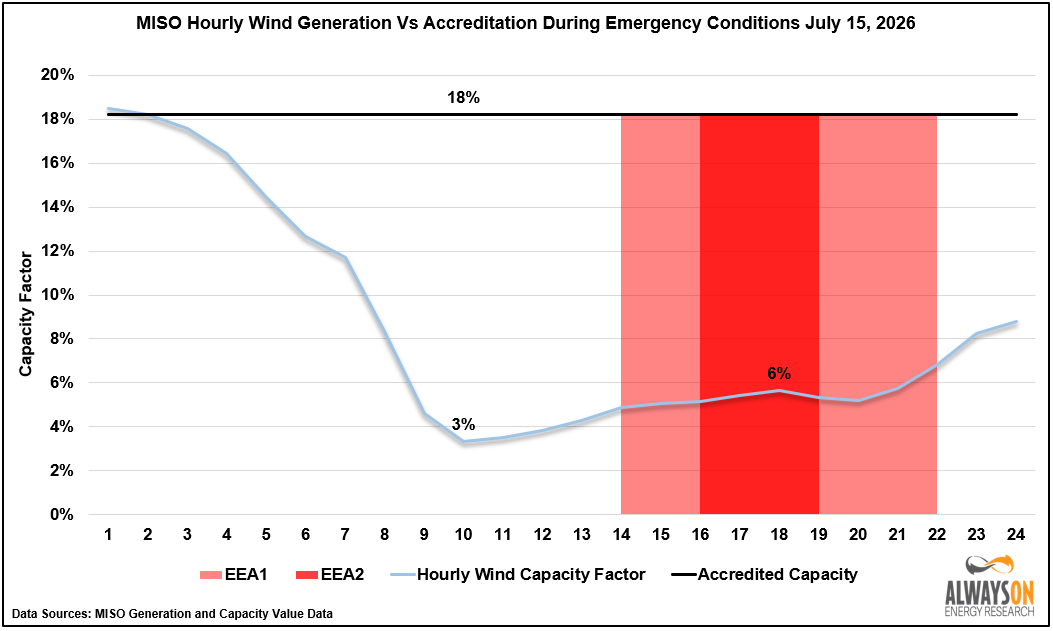
Not only did wind perform very poorly during the heatwave from an energy standpoint, but it also performed poorly during the maximum generation periods relative to its accredited capacity.
According to the MISO Planning Year 2026-2027 Loss of Load Expectation Study Final Report, wind had an estimated summer effective load-carrying capacity of 18.2 percent.
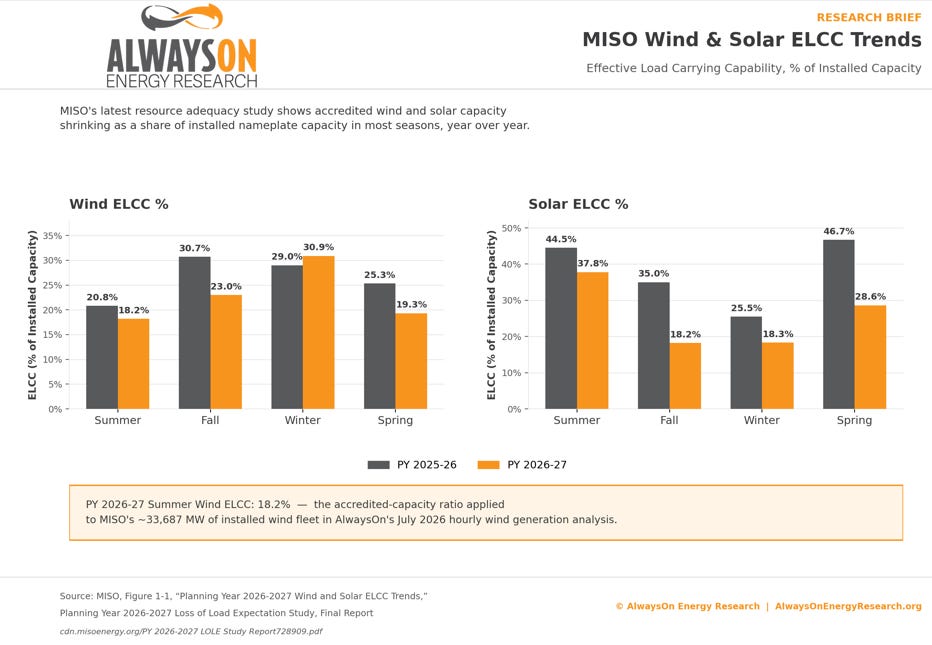
We think this value is too high and argued for a peak accreditation of 7.1 percent and a net-peak accreditation of 5.8 percent in a 2023 report we conducted for the North Dakota Transmission Authority, but we digress.
Using EIA Form 860M and MISO generation data, we plotted hourly wind capacity factors against accredited capacity. As you can see, it was far below its capacity value for nearly the entire day. At one point, it bottomed out at 3 percent capacity factor, meaning the wind turbines on the system were 97 percent worthless.
During the EEA2, wind generation maxed out at 6 percent (a substantial improvement from 3 percent), but it was still operating at just one-third of its capacity accreditation.
This is your quarterly reminder that EPA data show that forest fires emit more small particulates than the entire power sector. The photo below, provided by our friend Rep. Dave Prestin, shows the reliable, affordable J.H. Campbell plant, owned by Consumers Energy in Michigan.
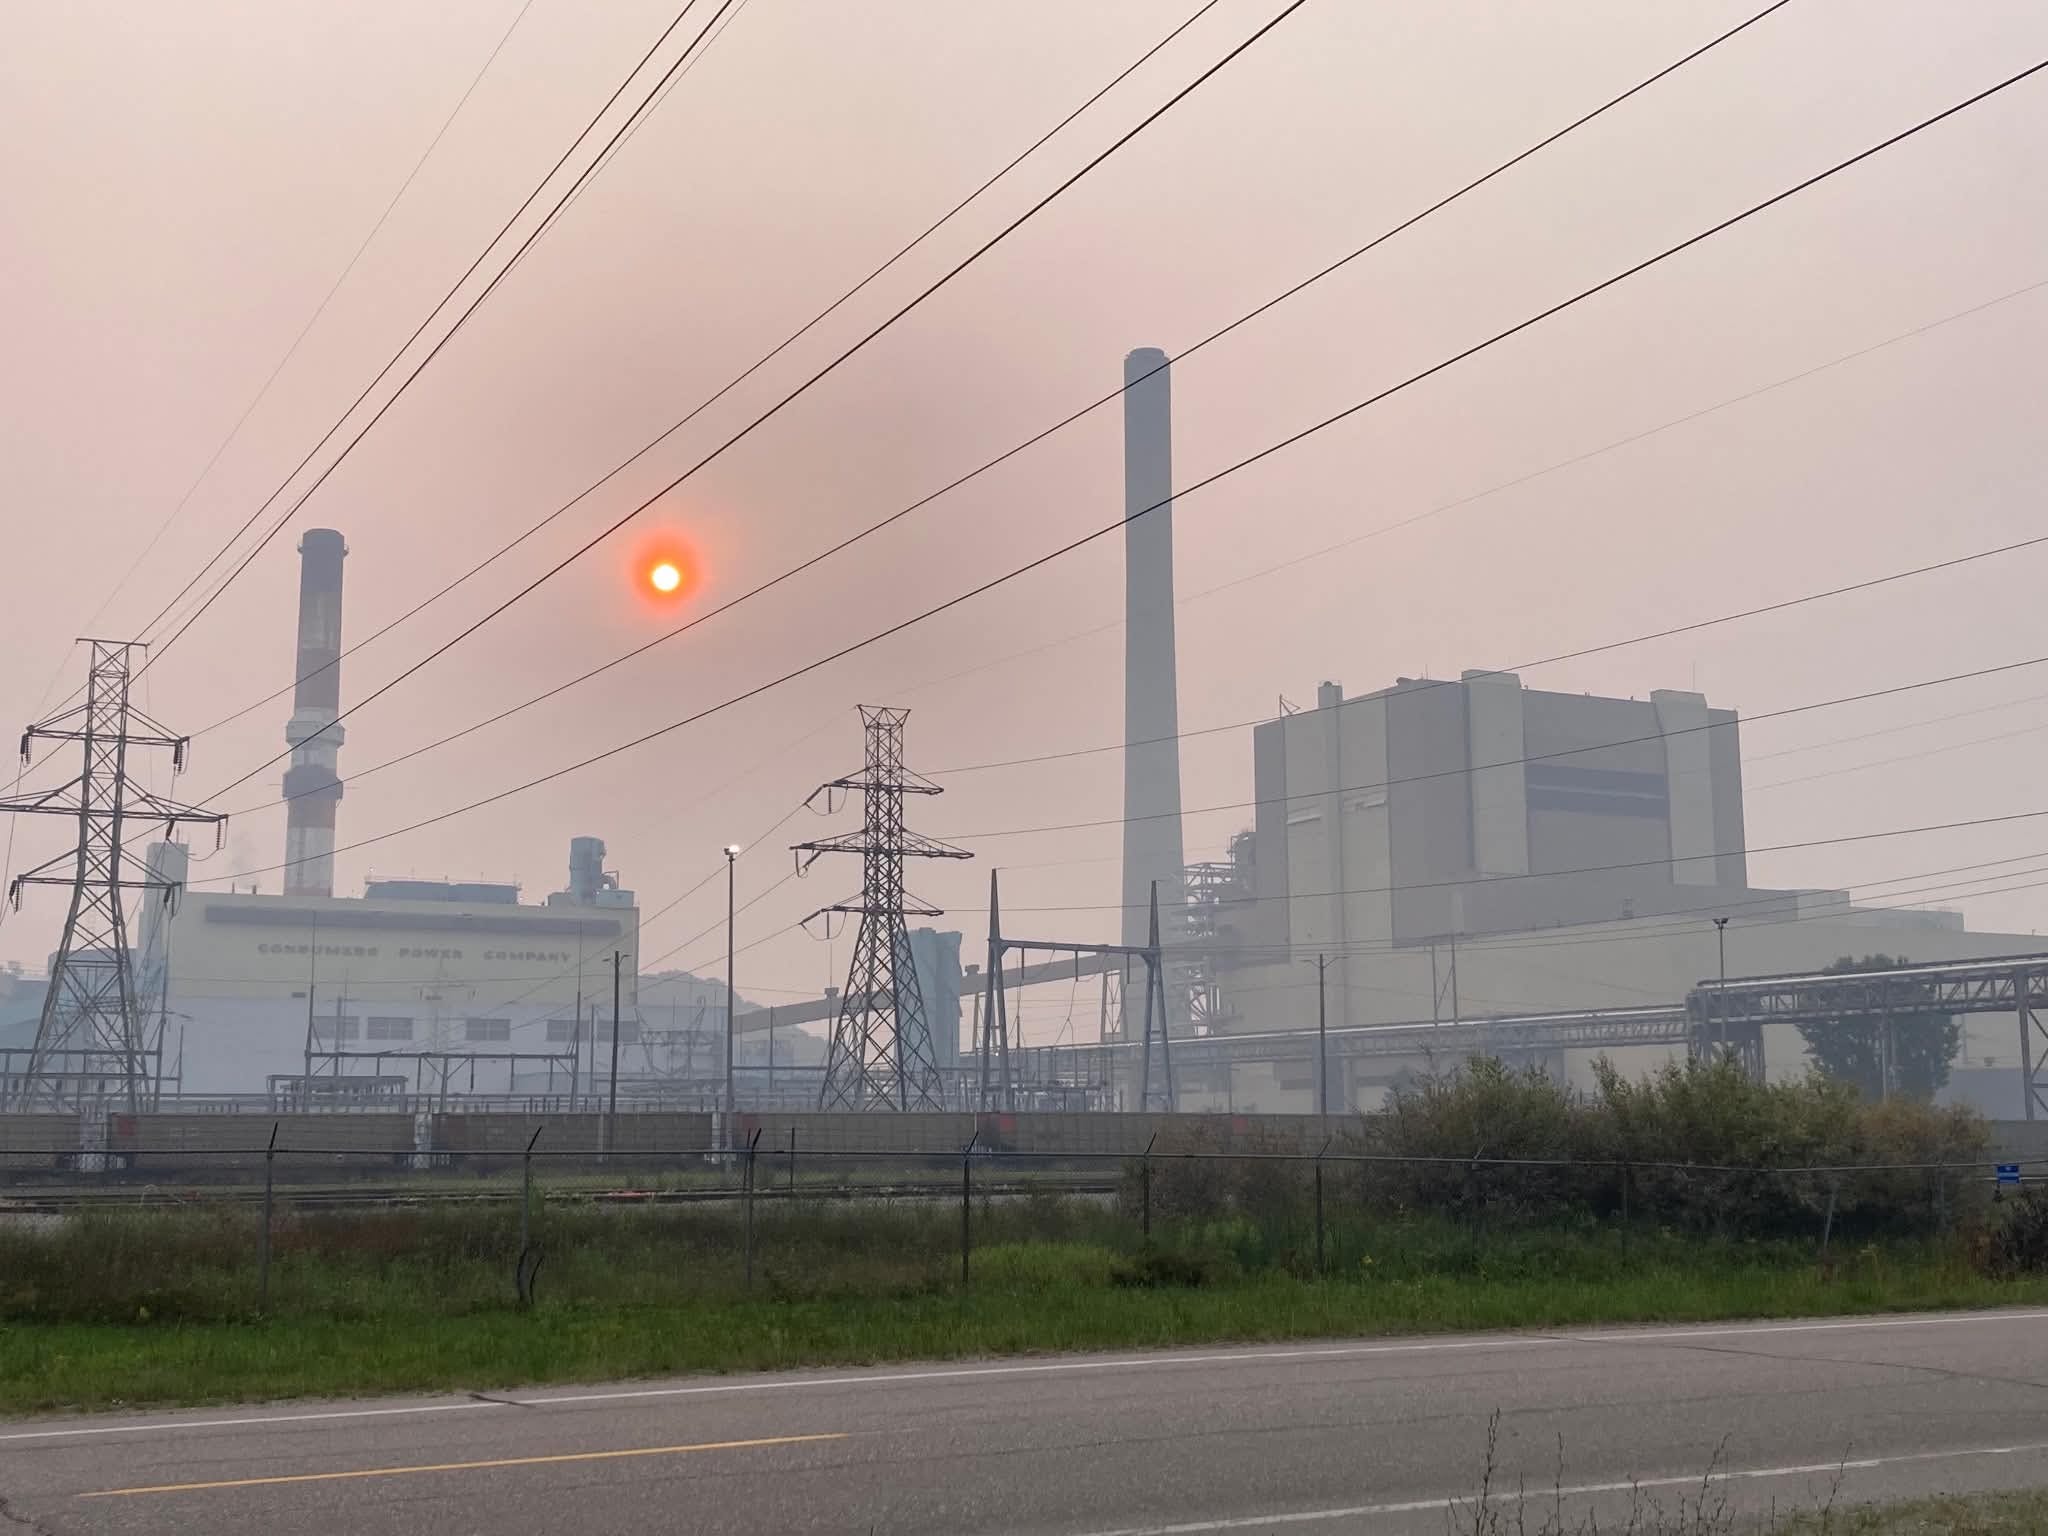
As we have recently detailed, even though the plant is one of the lowest-cost coal plants in America, the plant was slated for closure on May 31st, 2025, due to Consumers’ “sweeping proposal” to eliminate coal as a fuel for electricity by 2025.
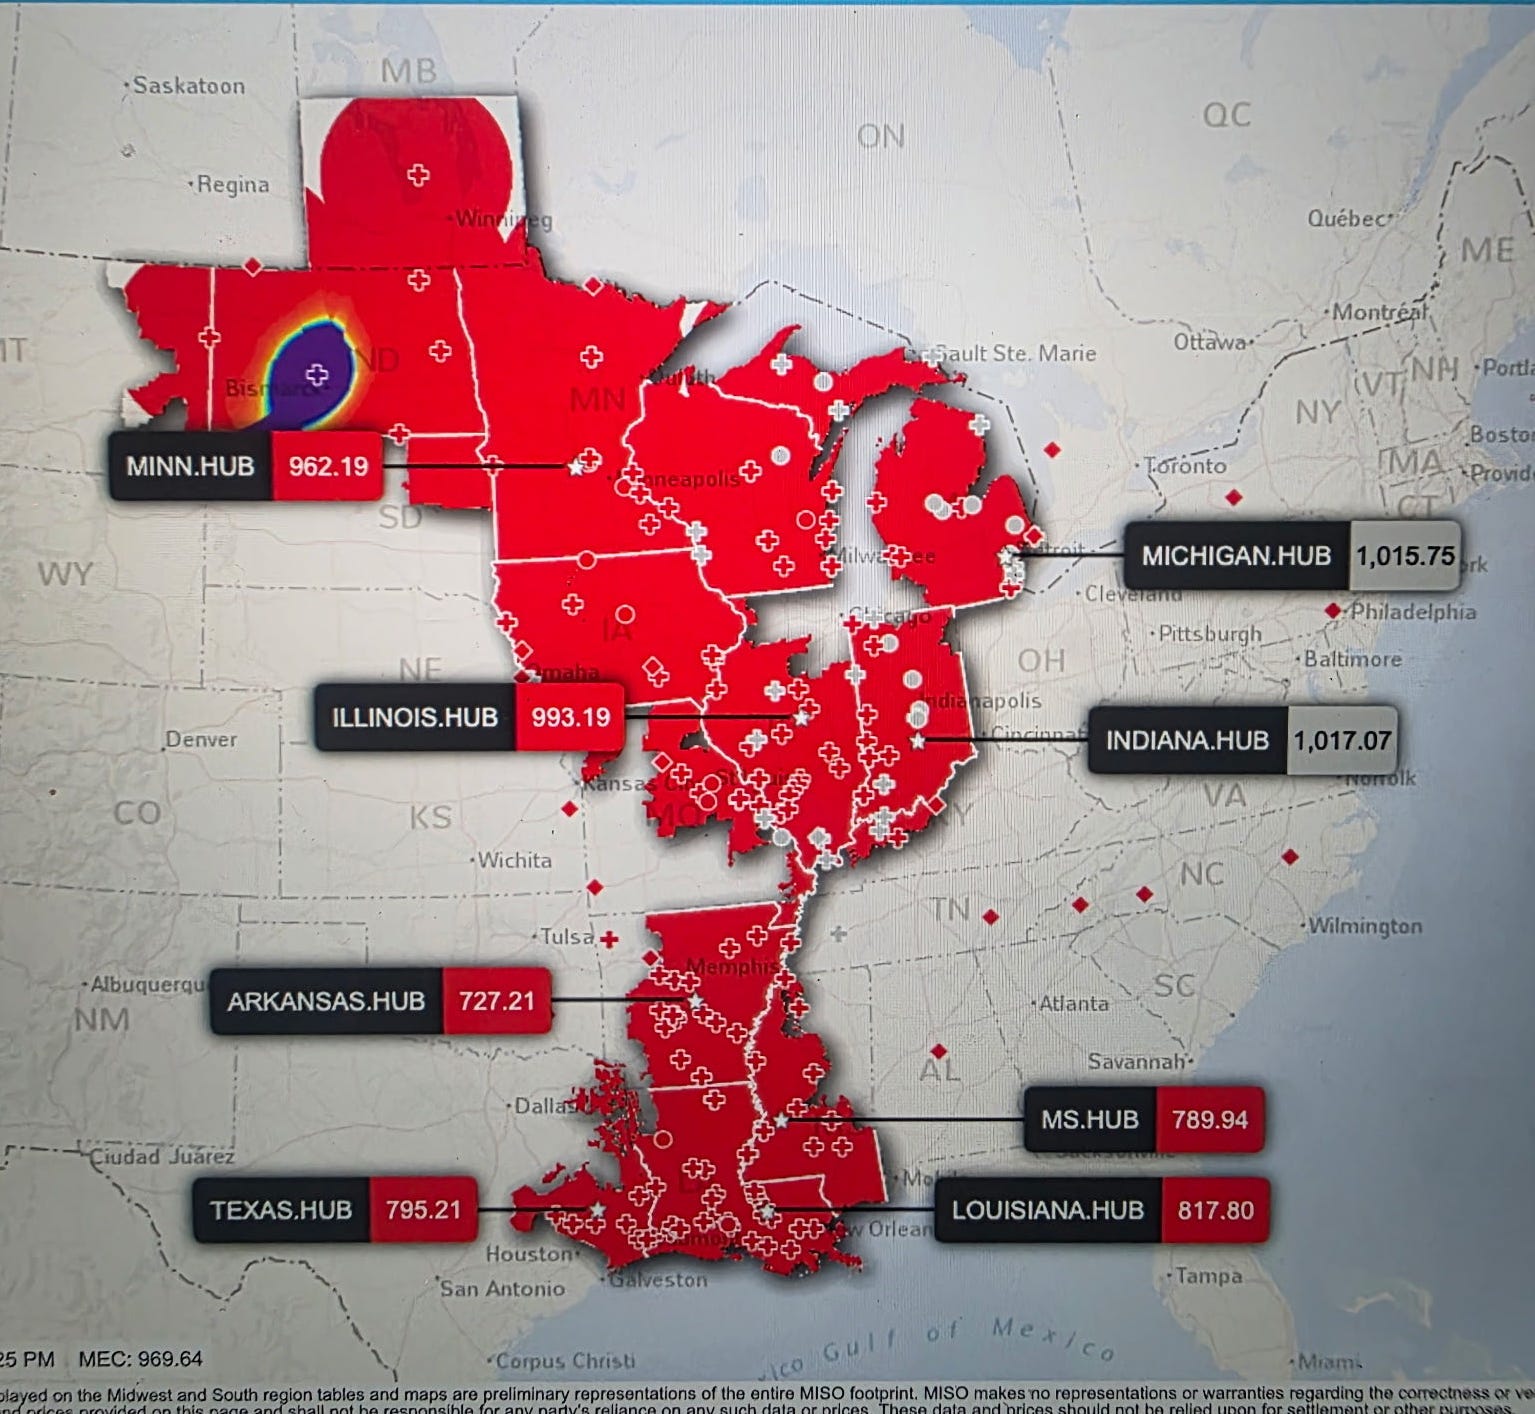
We doubt Consumers would ever admit it, but we would wager the company was probably relieved that the Trump administration issued the 202(C) order preventing the company from shutting the plant down, as locational marginal prices (LMPs) at the Michigan Hub exceeded $1,000 per megawatt hour (MWh) during the periods of peak grid stress.
Just for fun, if the Campbell plant were operating at its full Summer Net Capacity of 1,330 MW during the heatwave, it would have outproduced the entire MISO wind fleet, which totals 33,676 MW, for three hours on July 15th.
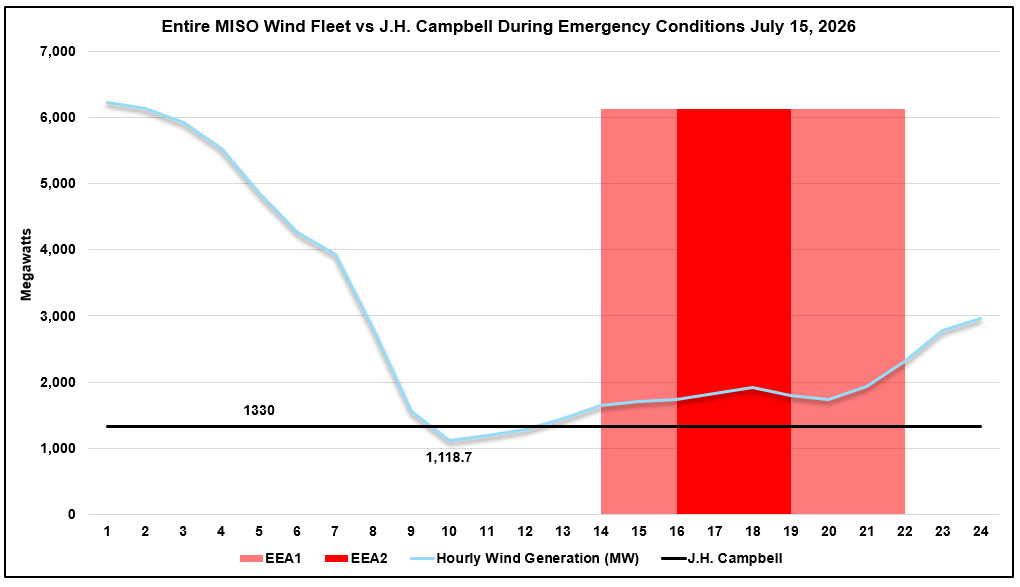
The entire wind fleet’s inability to consistently outproduce one coal plant during periods of peak system stress validates the industry-wide vibe shift toward building more dispatchable power plants to meet rising demand.
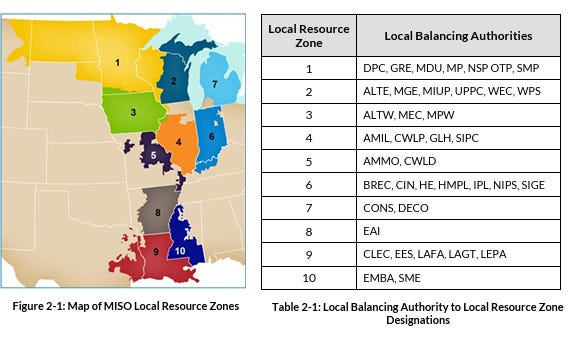
It’s worth noting that wind was underperforming even though MISO is the largest RTO in the country in terms of geographical footprint, spanning from Canada to Louisiana. And while almost all of the wind resources are in the north and central regions, the wind fleet still covers an area double the size of PJM.
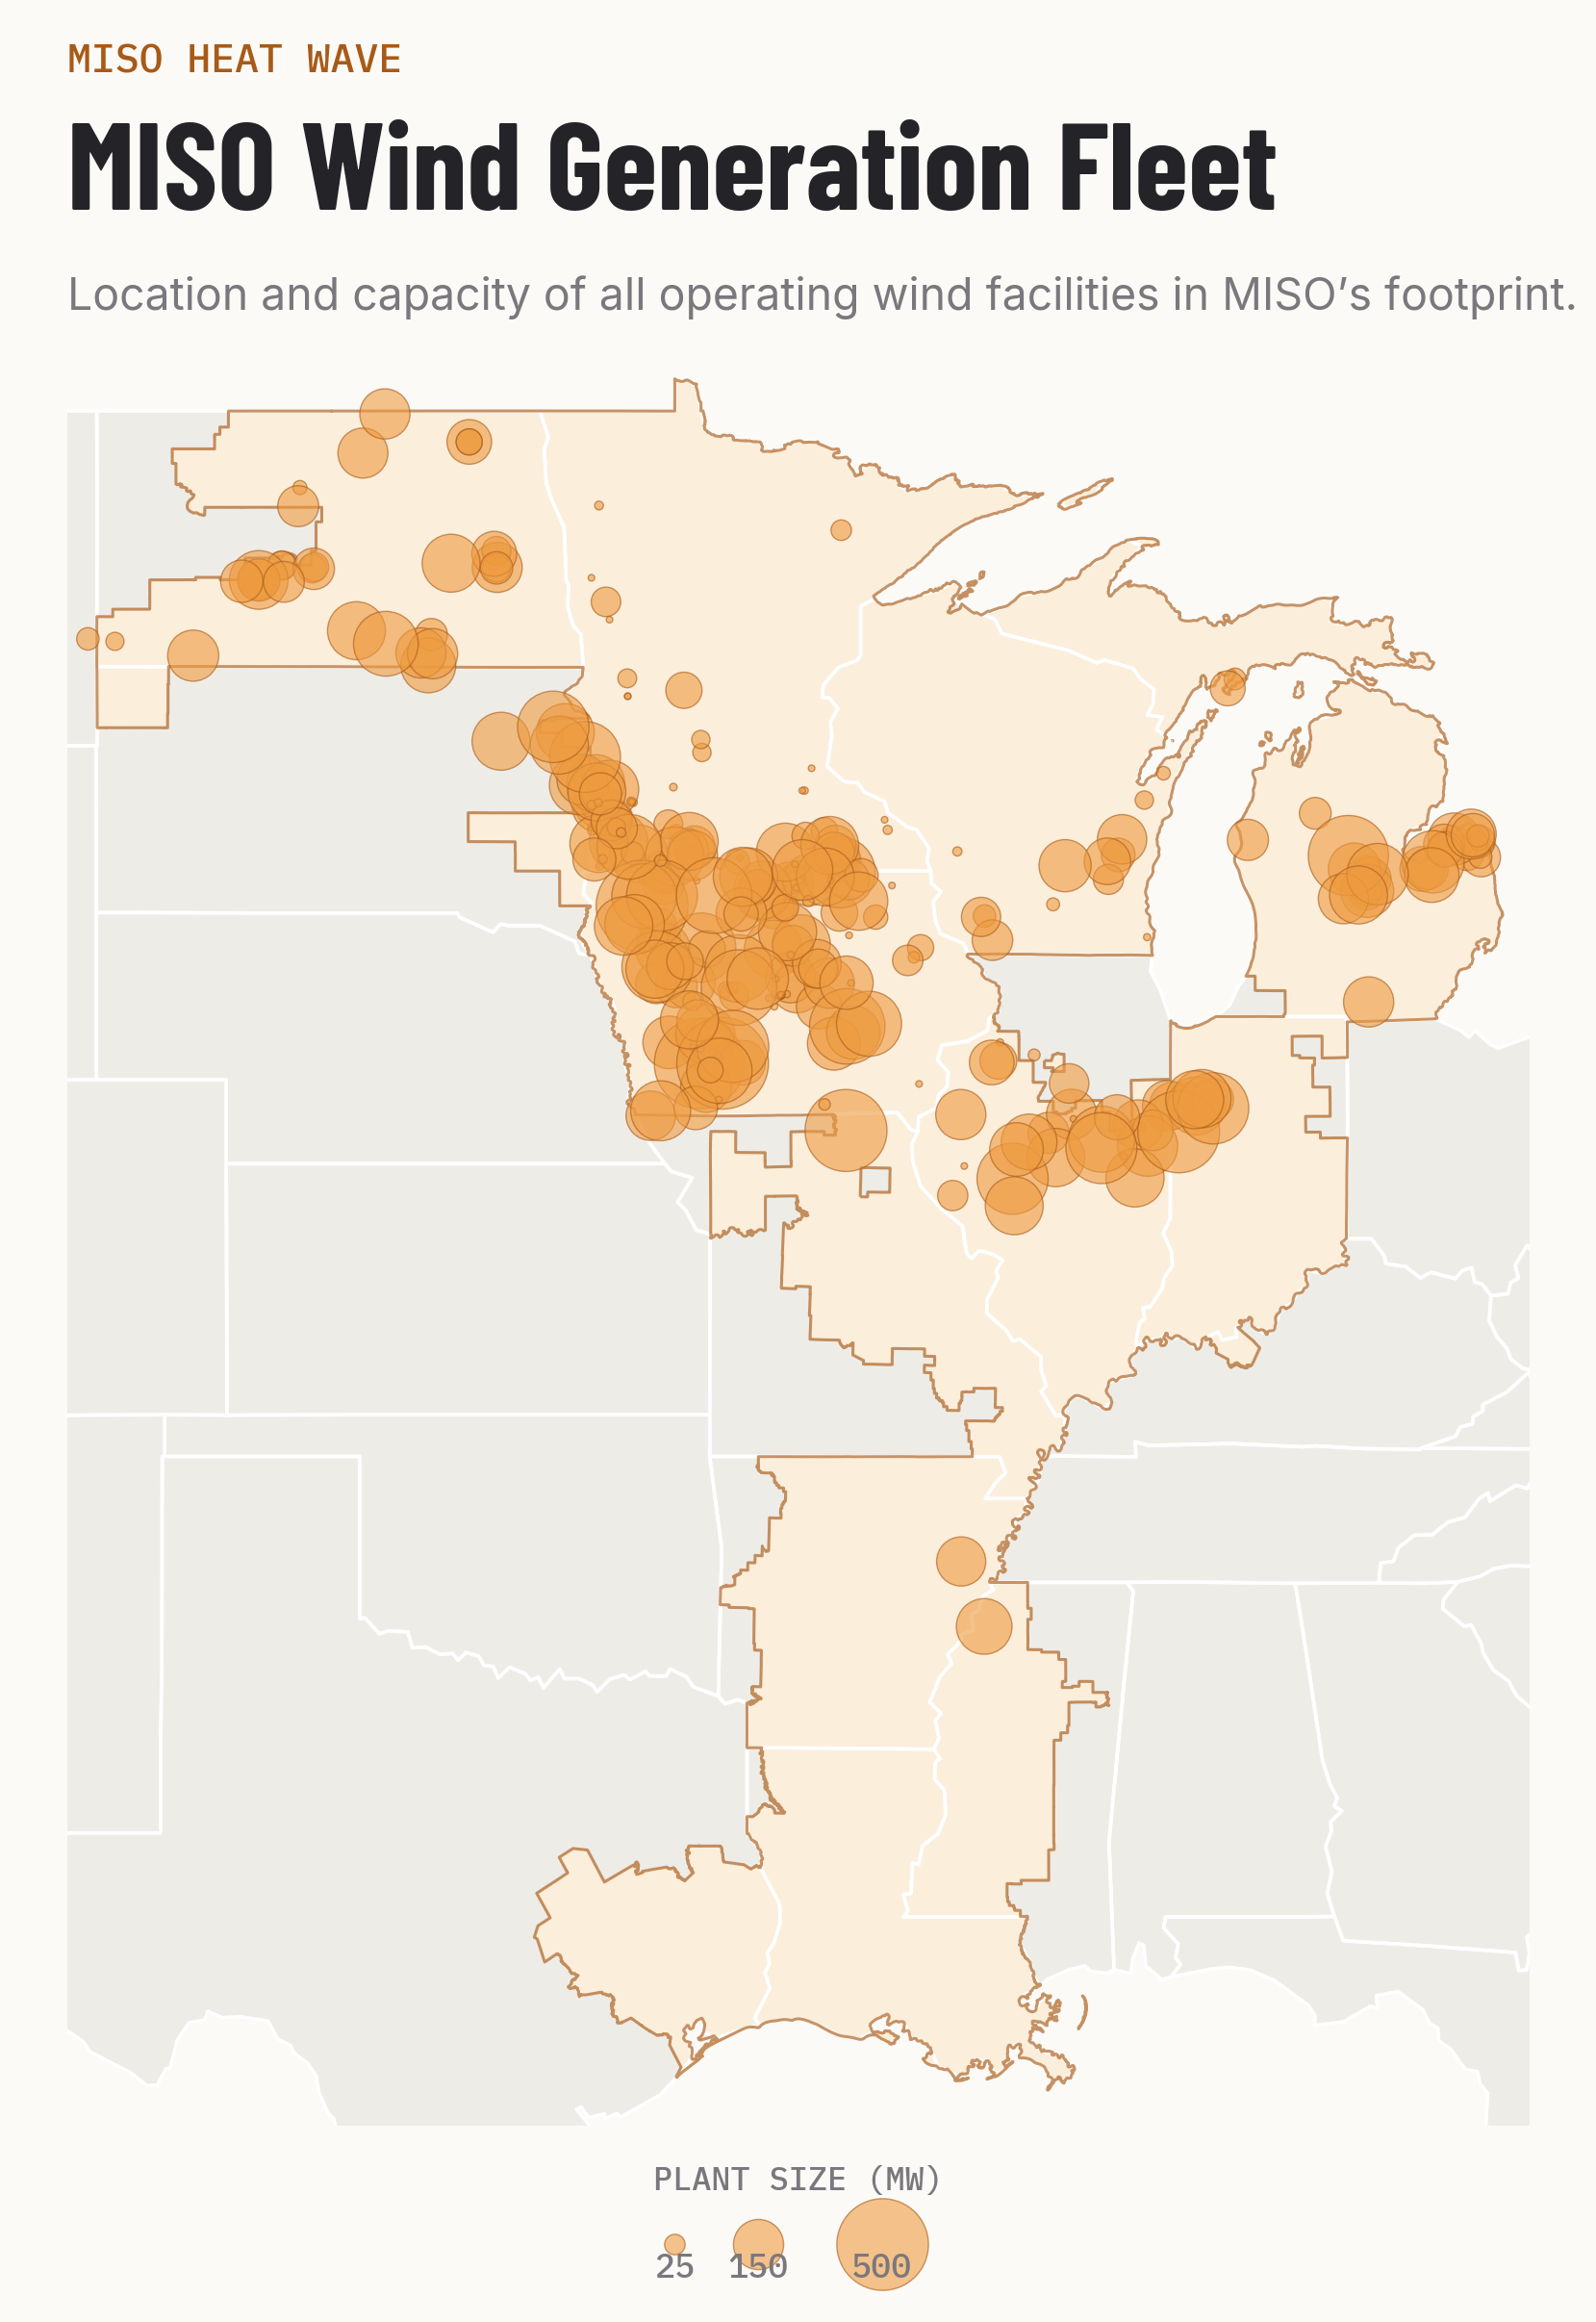
This challenges the idea that “the wind is blowing somewhere” and that if we simply build more transmission lines, we can connect these resources to Americans across the country. This would be true if the foundation for the argument was accurate to begin with. But it’s not.
The truth is that widespread wind droughts are very common, and longer transmission lines for wind resources are meaningless when the wind isn’t blowing anywhere—which happened to be the case in MISO during this latest heatwave.
Based on their performances during the heatwave and peak demand, we made a scorecard to show the rankings of each resource in MISO.
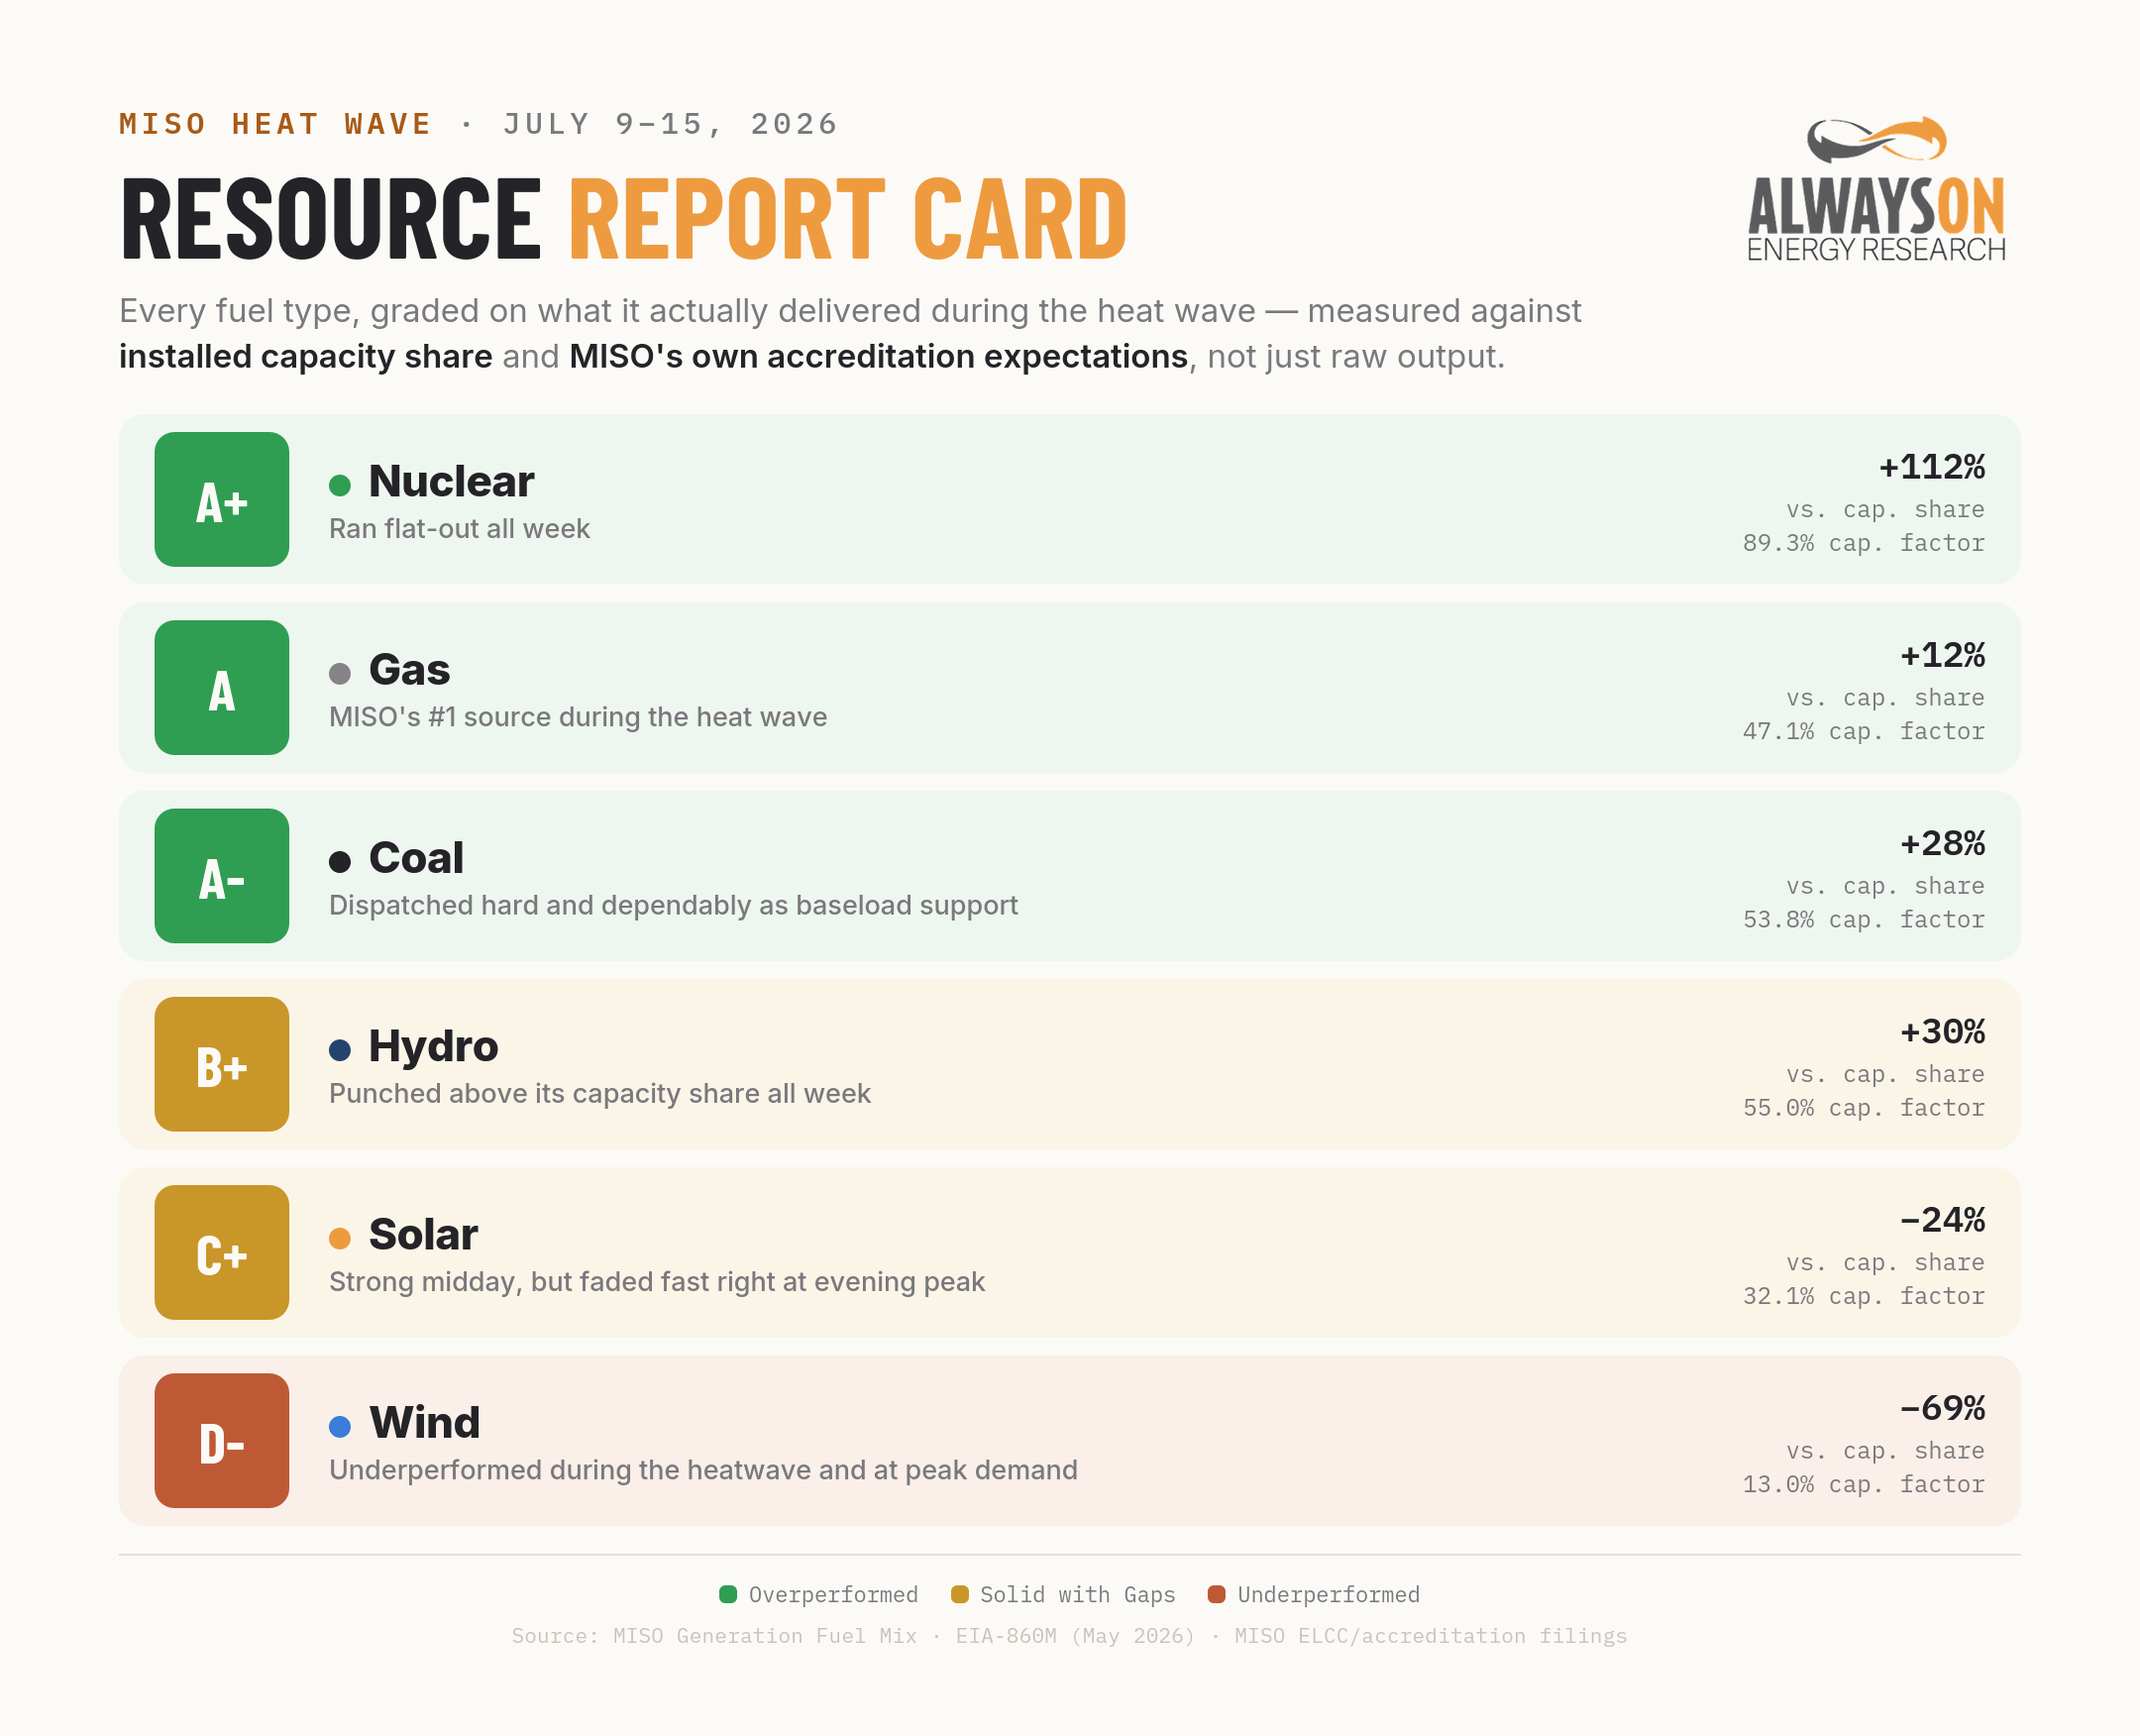
Nuclear was the unquestioned leader, running near full-blast throughout the entire heatwave. Natural gas was the #1 resource in MISO throughout, and therefore it deserves one of the highest rankings, followed closely by coal. Hydro, while an insignificant resource in MISO, still performed decently.
Solar performed fairly well during the day, but MISO had to deal with the entire fleet dropping off the grid during the evening peaks. This provides challenges on any day, but it is especially challenging during periods of high-stress. Natural gas served as the primary backup resource that kept the lights on.
Wind was the clear loser, providing very little energy and almost no reliability value whatsoever. If nothing else, it was at least consistent…(ly low).
For much of the heatwave, there was a noticeable difference between MISO regions in the North compared to the South. As you can see below, prices in the South were consistently lower.
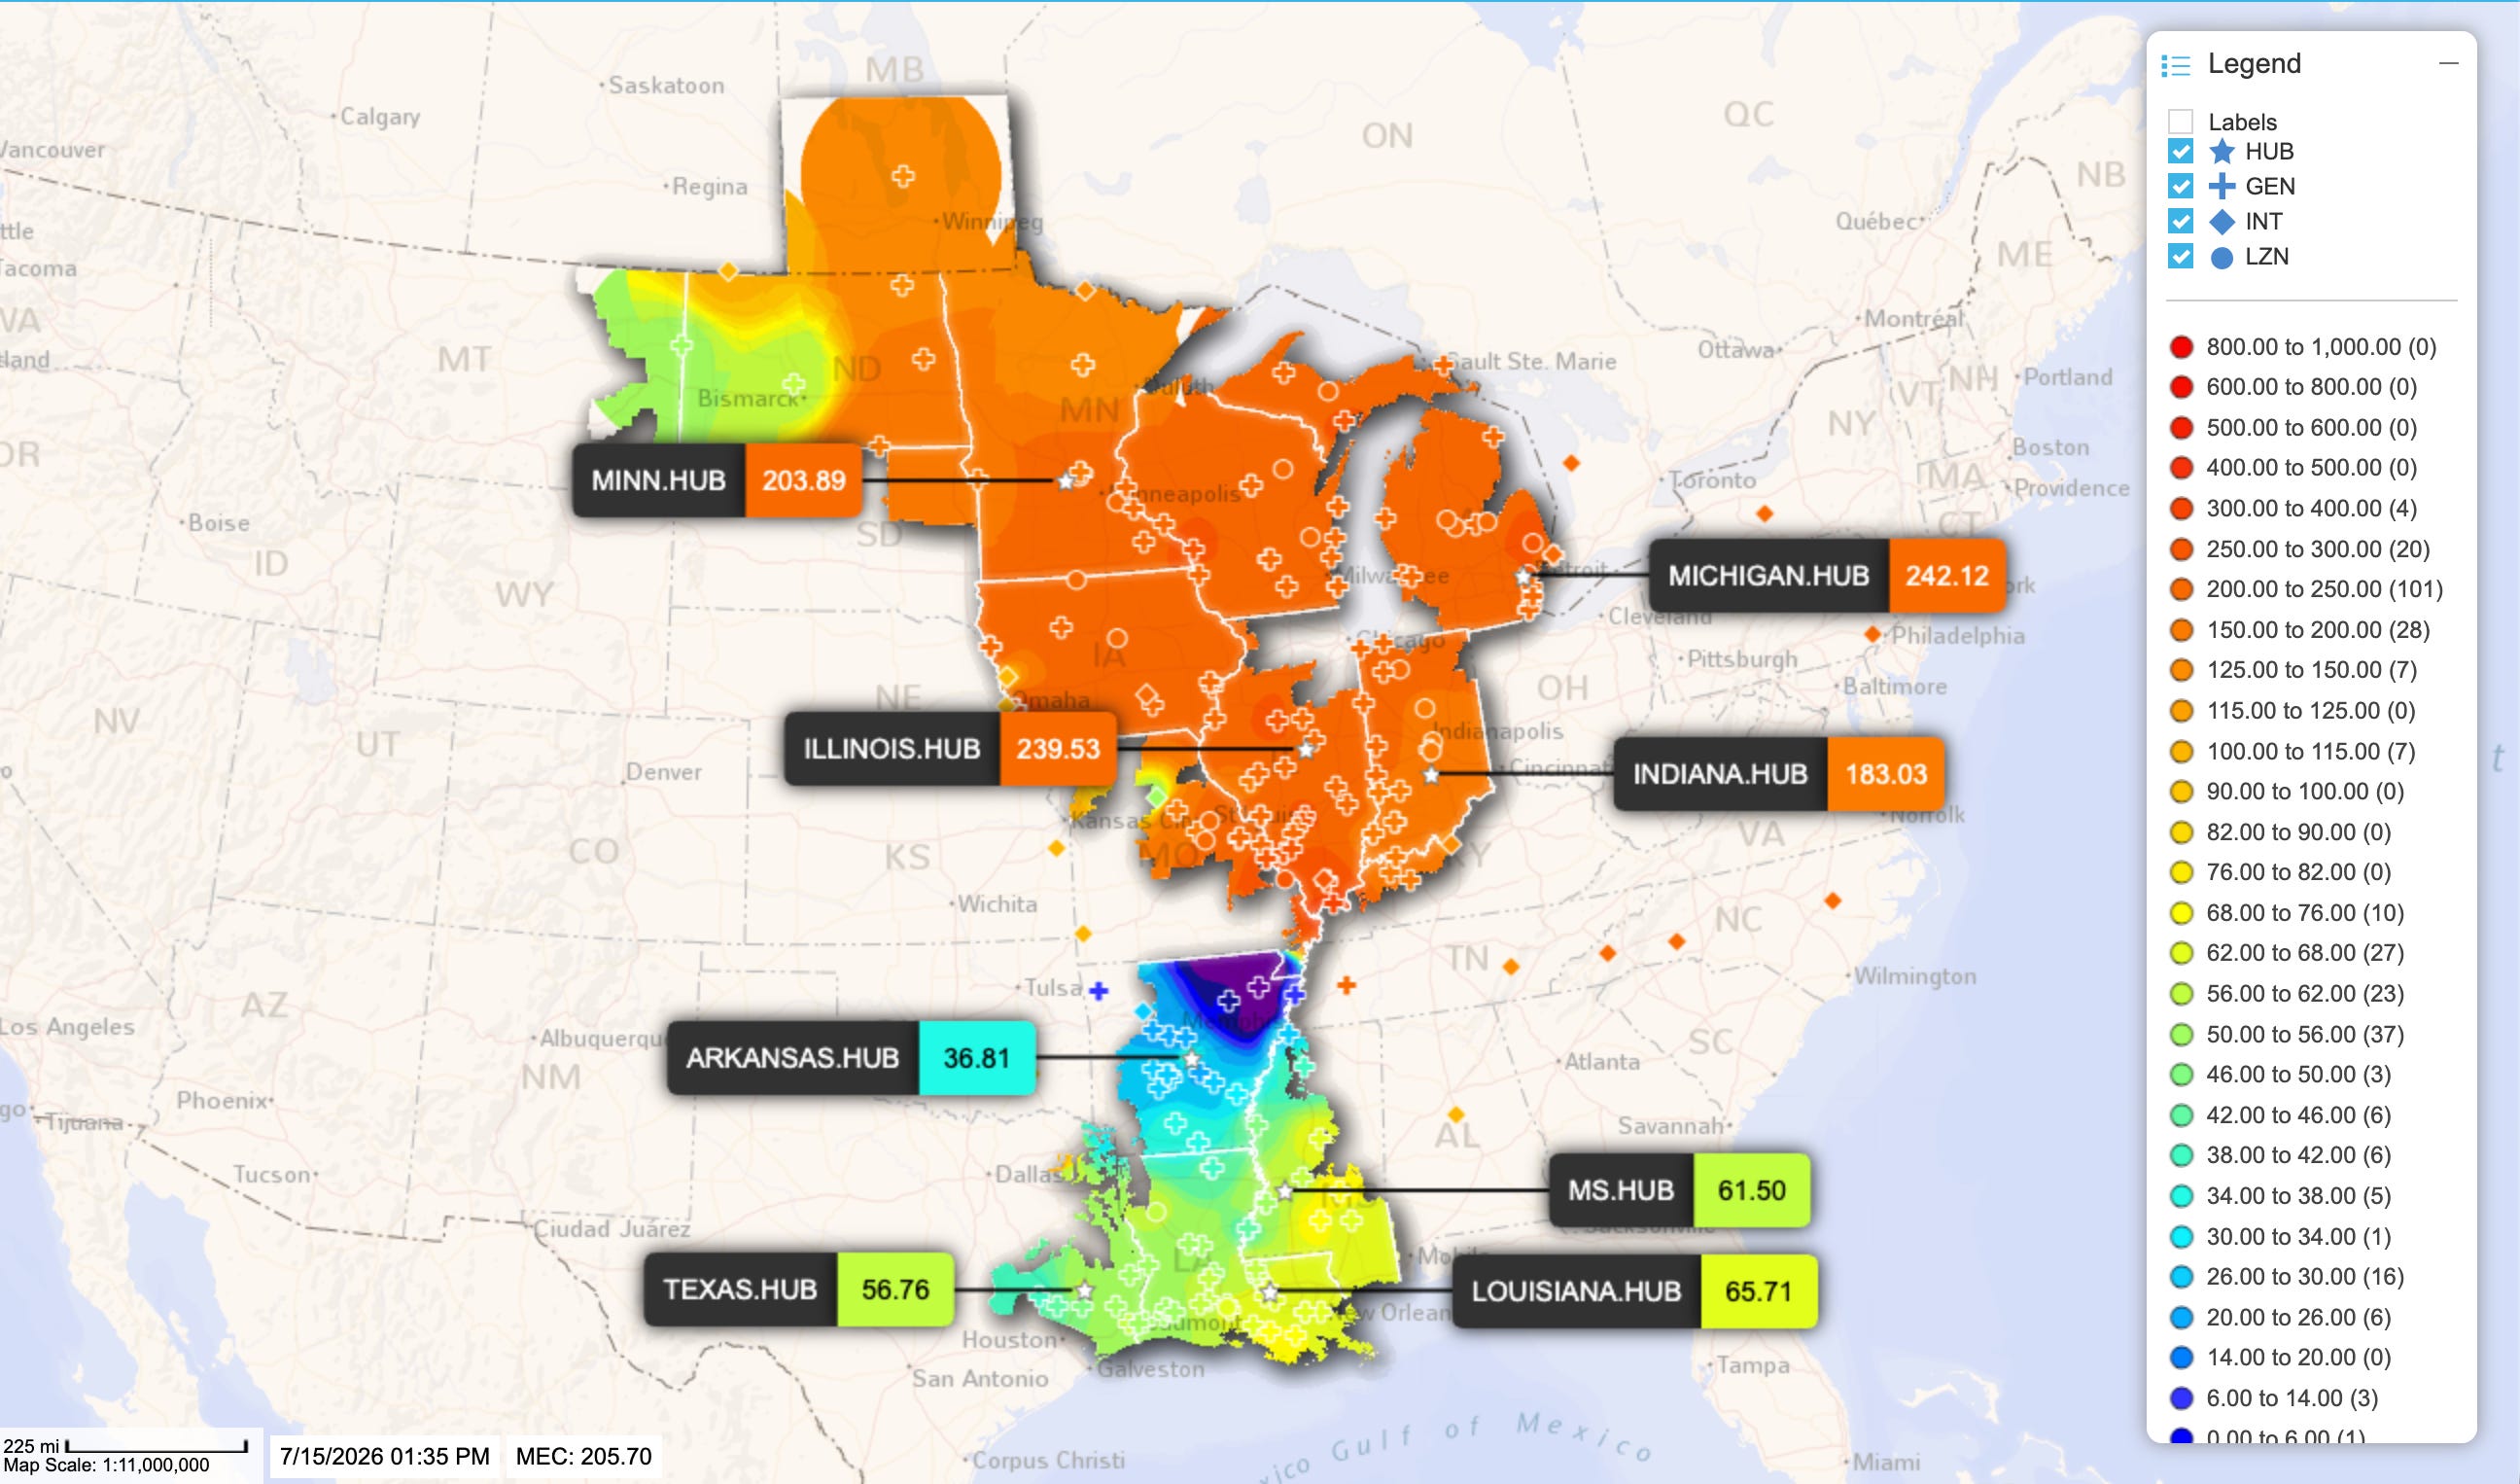
But the states in MISO South are also not pursuing resource portfolios that are heavily dependent on wind, solar, and storage. Thus, their prices are much more stable than those experienced in MISO North and Central.
For the last decade, we were told we needed to build lots of transmission to export or wheel wind and solar across the country during times of peak system stress. But it turns out that maybe the transmission was to connect the weather-dependent regions to distant coal and gas resources all along.
Imports played an important role in keeping the lights on Wednesday evening. According to MISO, the region was importing a massive 17,873 MW at 8:30 pm, accounting for about 16 percent of total demand.
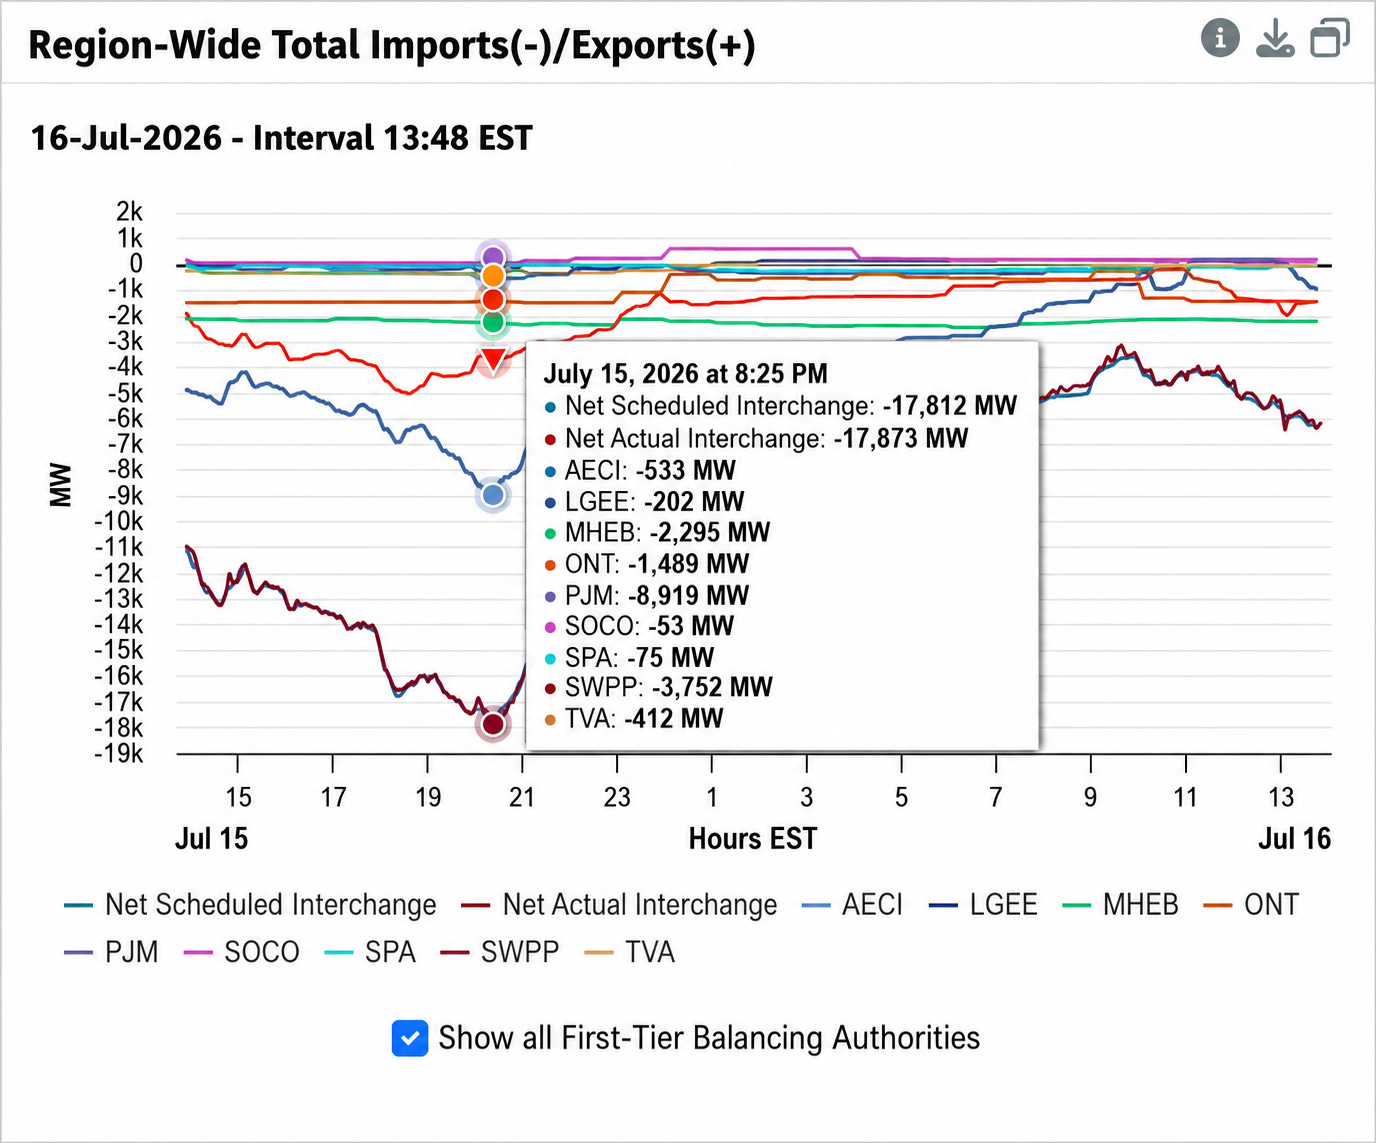
For context, 17,812 MW is nearly the size of the projected peak demand margin for MISO Region 1, which has a peak demand of 18,927 MW.
The imports came largely from PJM and Southwest Power Pool, with significant contributions from Ontario and Manitoba, as well.
This brings up several hard realities for grid planners and NARUC attendees moving forward, as they increasingly rely on imports to ensure reliability. Imports will become harder to come by during peak periods as load continues to grow and conditions become tighter nationwide due to reliance on variable generation.
MISO, specifically, needs to be asking—what happens if PJM imports are no longer available during these tight conditions? PJM’s latest auction resulted in a nearly 7 GW capacity shortfall, continuing the trend from the auction before it that came up short for the first time in RTO’s history. And it’s no wonder, considering that dispatchable capacity in region has been on the decline for years, load is on the rise, and the current trend of building intermittent resources to shore up the gaps simply has no way of keeping up. (A recent report that Mitch co-authored with Jonathan Lesser at the National Center of Energy Analytics noted this trend).
The lights stayed on in MISO this week, but the emergency declaration should give the NARUC attendees plenty to discuss regarding reliability next week, supplementing the almost certain focus on affordability that is the soup-de-jour of the electricity sector.
The years-long practice of taking these factors for granted as policy shifted toward decarbonization is now rearing its ugly head.
Like this piece if you’ll be at NARUC
Like this piece even if you won’t be at NARUC
Come on, man, just like and share the piece

Ten more states went up at BlueStatesHighRates.com. Did your state make the grade?
Colorado’s renewables milestone looks more like subtracting coal than adding wind and solar by Sarah Montalbano
Comments
Nothing yet. Say the first thing.
Sign in to join the conversation.