
Yields are slamming everyone and there is hope today for some respite finally.
But currently, mortgages rates (for new mortgages) are at record highs. Car loans are dragging down car purchases. Delinquencies are rising and deals are slowing. Commercial real estate is getting pounded. (Rates dropped today and all of these sectors are up).
The impact is hitting the economy from all angles. Readers have been asking me about yields and how they impact the markets. We will cover that in a follow-up post.
First, it is helpful to understand what the news and market pros mean by rates. Rates is not a single number but a larger concept that impact every aspect of our lives going forward.
Given the importance here, a concise but complete review is appropriate. This is a yield curve primer to make sense of the economy, the news, and your money.
The yield curve in the United States, like in many other countries, is a graphical representation of the yields (interest rates) on government bonds of different maturities, typically ranging from short-term to long-term. The most commonly discussed tenors or maturities on the yield curve are 2-year, 5-year, 10-year, and 30-year. However, there are other tenors as well.
The significance of these different tenors lies in what they can tell us about the overall state of the economy, expectations for future interest rates, and investor sentiment. Here's what each tenor can signify:
📈 2-Year Yield: As a bridge between short and long-term rates, the 2-year yield helps gauge market sentiment. It's sensitive to changes in economic conditions and monetary policy, making it a valuable indicator for investors and policymakers alike.
📈 5-Year Yield: The 5-year yield is often seen as a benchmark for the "neutral" interest rate, where the economy is in equilibrium. It reflects medium-term economic expectations and can signal shifts in economic growth and inflation.
📈 10-Year Yield: The 10-year yield is a widely watched barometer of the economy. It's used to assess long-term borrowing costs for both governments and businesses. Changes here can indicate shifts in inflation expectations and investor confidence.
📈 30-Year Yield: The 30-year yield represents the longest maturities. It's a key indicator for the housing market, as it influences long-term mortgage rates. Investors closely monitor this tenor for insights into long-term economic stability and inflation expectations.
The federal funds rate (FFR) is the rate at which the Federal Reserve lends money to commercial banks in the United States. It is used as a benchmark for interest rates across the country and affects borrowing costs for consumers and businesses. The FFR is determined by the Federal Open Market Committee and has a target range set by the Federal Reserve, which can change as needed based on economic conditions.
The rate is one of the economic levers that Fed has available to steer the economy toward long term stability (with short term instability). Other tools include emergency loans, buying/selling bonds and other assets from banks, and open market operations. For this article we will focus on setting rates.
The current FFR target range is 5.5%.
The market expects/forecasts the future interest rate over a variety of tenors by marrying today’s cost of money with investor demand for money and credit. The drivers of these expectations and the unique purchasers of debt at different tenors determines future interest rates. The drivers of different tenors were listed above.
For example, foreign governments are worried about the future globally investing opportunities and are investing excess reserves in the long term (30 year) US bonds. This demand will keep bond rates on the 30 year lower. This view is not unique to foreign governments. Other investors could also feel the same.
Although the absolute level of interest rates have an impact, the shape of the curve sends signals about the economy and can significantly impact economic and investing opportunities.
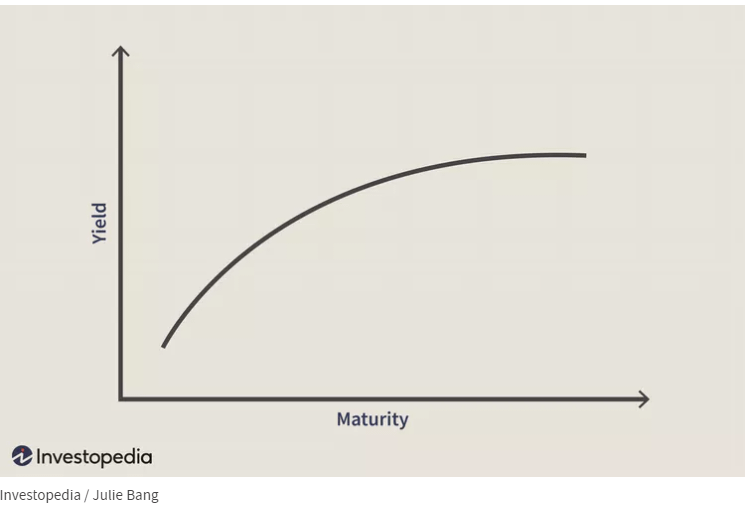
A “normal” yield curve is shaped like this. Investors want to get paid more for locking in their money for longer periods - in other words higher interest for higher duration bonds.
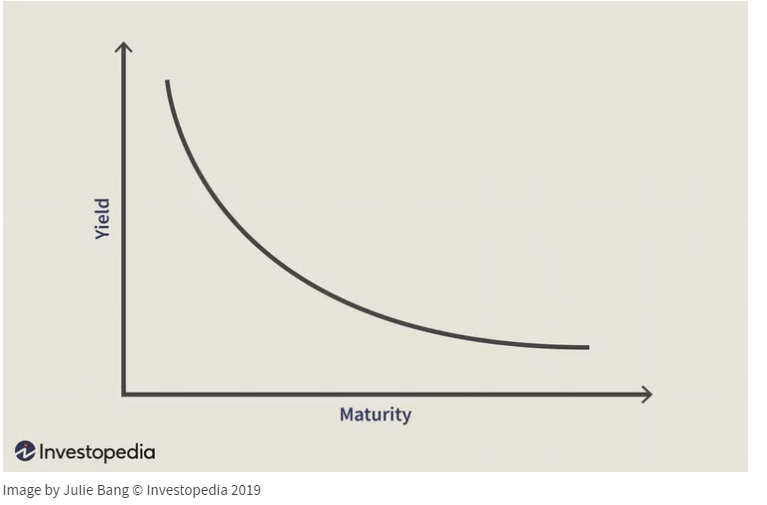
In times of fear or economic upheaval (recession for example), investors want safety not yield. They prefer to protect their money by purchasing more longer-dated bonds over short-dated bonds, bidding up the price of longer bonds and driving down their yield.
The yield curve looked like this on 11/10 (blue line). The red line is the shape of the curve on 10/26.
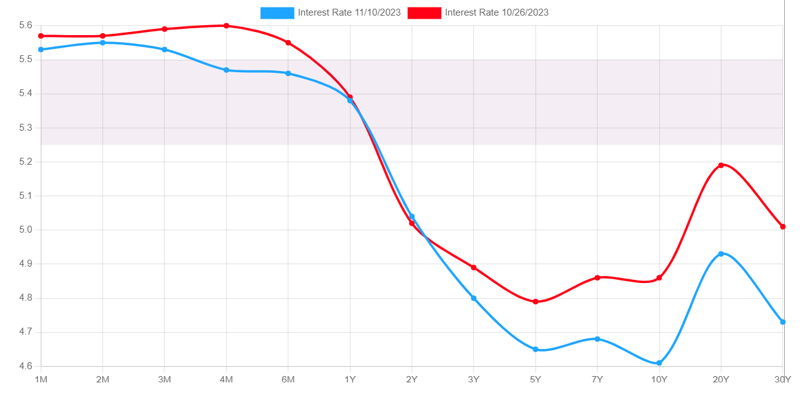
Here are what investors are looking at in this chart:
The long end of the curve is very high in October, as deficits and fiscal spending concerns were worrying investors of long term US debt (so the rates went up).
Some of those fears have subsided and long term rates (10, 20, and 30 year) have come down. This is a relief for everyone. Car loans, mortgages, acquisitions, capital equipment purchases, and numerous transactions are benchmarked to these rates.
The shape of the curve is very inverted. This is feeding fears of a recession over the next year (but we have not had one yet for a variety of reasons I discussed here).
For current savers this is a huge opportunity since near term rates are so high. A savings account has not paid this much in over 20 years.
The good news. When and if a recession hits, the Fed will need to reduce rates. Historical this has happened every time in WW2 America. The bad news. A recession has eventually arrived every time when rates were hiked as quickly as they were in 2020 (grey bar in chart below).
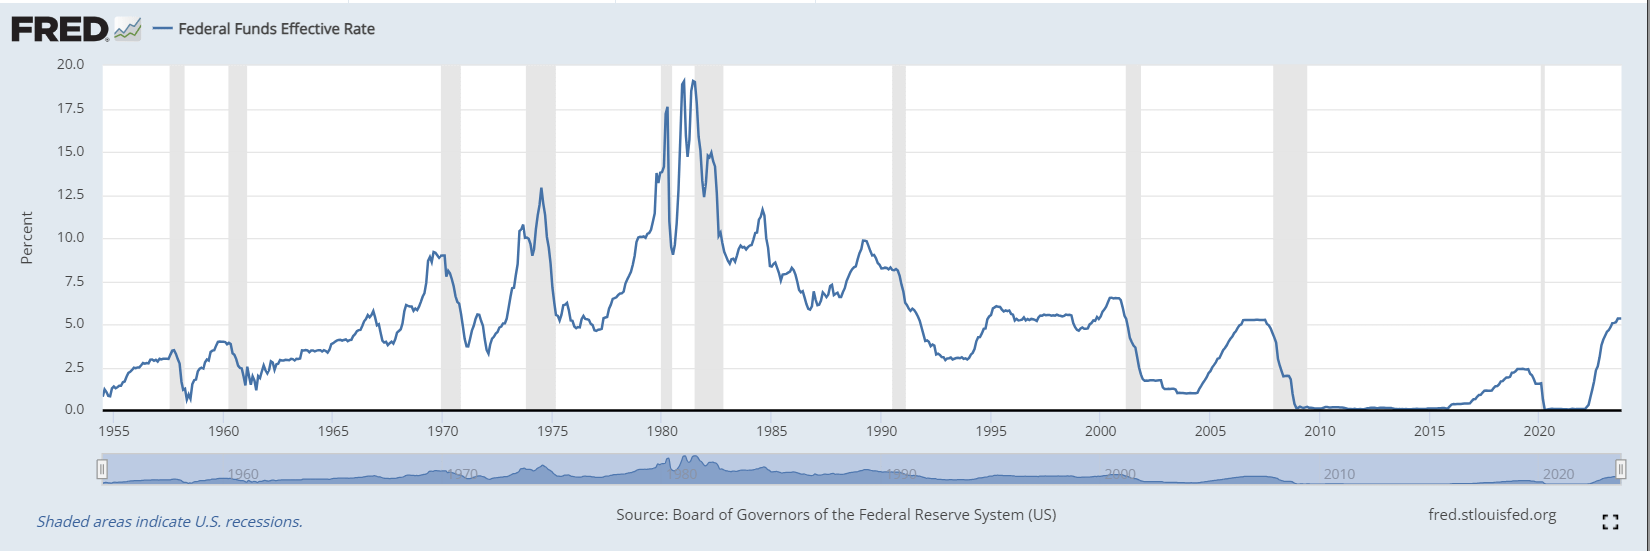
As I write this, the market has blasted higher today. Rates across all tenors have come down with a weaker inflation report. Lower inflation means the sooner the Fed can start to cut rates. More in a future post.
Interest Rates impact by the Fed: Here
10 Year Treasuries: Here
Brookings Explains Rates: Here
Fed Rate History: https://fred.stlouisfed.org/series/FEDFUNDS
If you have any questions, leave a comment. Thanks for reading Embrace the Chaos! Sharing perspective that makes sense.
Much effort and research went into making this 9-minute read. If you found it valuable, please help me out by clicking the like button and sharing this article.
- Vikas Kalra, CFA
Comments
Nothing yet. Say the first thing.
Sign in to join the conversation.