
Welcome, subscribers!
This week, we pulled together ten new pitches spanning payments, media, financial infrastructure, healthcare, banking, travel, biotech, and restaurants.
A recurring theme is the gap between current market perception and underlying earnings power. Several of this week’s ideas involve businesses where disruption fears, cyclical weakness, execution concerns, or near-term uncertainty have weighed on valuations despite durable competitive positions or improving fundamentals, while a few others offer more asymmetric upside tied to turnarounds or company-specific catalysts.
If you know someone who enjoys investor letters and discovering new ideas, feel free to forward. 📬
Some of the ideas this week include:
A financial data and benchmarks franchise where AI disruption fears may be overshadowing the strength of its core businesses.
A highly moated exchange and financial infrastructure company trading at a compressed valuation amid concerns over AI and new trading products.
A leading healthcare business with opportunities for margin expansion, new product growth, and upside from a potentially valuable drug pipeline.
A cash-generative vacation ownership company trading at a low free-cash-flow multiple while aggressively repurchasing shares.
A clinical-stage biotech with two major shots on goal and potentially asymmetric upside from upcoming trial results.
A heavily shorted restaurant turnaround where new leadership, improving sales trends, and a repaired balance sheet could change the narrative.
A fast-growing California community bank generating strong returns on equity while trading at a surprisingly low earnings multiple.
Disclaimer: Nothing here constitutes professional and/or financial advice. You alone assume any risk with the use of any information contained herein. We may own positions in the securities listed. Please do your own due diligence.
To the investment managers who read this, you can send us your letters at elevatorpitches@substack.com or on Twitter (and Threads!) if you’d like to be included in a future issue.
Let’s get to it.
Private Bancorp of America (“PBAM”) is a community bank located in California that provides banking service to small and mid-sized businesses (“SMEs”) in the San Diego, Los Angeles and Santa Barbara county areas. PBAM is a large originator of SBA loans (about 30% of total originations). PBAM operates out of its headquarters in San Diego, California and nine locations in California. PBAM has grown by acquisition of a local banking team in Montecito, California. This is a low-cost way of acquisition growth as the buyer is not paying goodwill to acquire customers and deposits. This strategy has been successfully executed by ServisFirst (SFBS) in the South and Mission Bancorp in California for many years. The current President and CEO, Rich Sowers, was appointed CEO in February 2018. He was a bank officer for Manhattan Bancorp and Plaza Bank and joined PBAM in 2018 shortly after Plaza Bank was purchased by Pacific Premier Bank. Mr. Sowers grew up in the Los Angeles area.
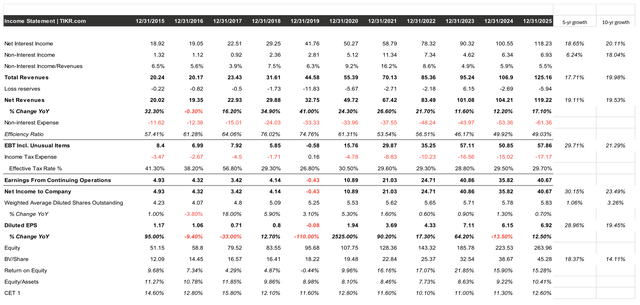
PBAM has grown EPS by almost 29% per year over the past five years and 19% over the past ten years. This growth is driven by providing commercial and industrial, commercial real estate and SBA loans which have grown by 19% per year over the past ten years and 16% per year over the past five years. PBAM’s lending franchise and loan purchase generates an average loan yield of 6.8% and has organically grown loans by 16% per year over the past five years. The strong loan growth is comprised of criticized plus watch list loans of 2.8%, non-performing loans (“NPAs”) of 1.60% and a loan loss reserve to NPAs of 88%. PBAM finances its loans through non-interest bearing and interest-bearing deposits generating a low cost of funds of 1.7%. The resulting net interest margin (“NIM”) is 5.2% and is sustainable as funding costs will decline with declining loan yields. PBAM’s largest shareholder is its management, which holds 29% of its common stock. Historically, PBAM has generated on average high single digit percentage of its revenue from non-interest bearing or spread activities. From 2013 to 2025, PBAM realized operational leverage from its loan growth over a slower growing fixed cost base.
PBAM was founded in 2006 in La Jolla, California to provide banking services to the Southern California region. In 2018, PBAM hired its new CEO, Rick Sowers. In 2025, PBAM hired a banking team from Montecito, California. From 2015 to 2025, PBAM’s book value plus dividends increased by 13% per year and EPS grew by 19% per year. From 2018, the year Richard Sowers became CEO, to 2025, PBAM’s book value plus dividends increased by 15% per year and EPS grew by 36% per year.
A bank productivity measure is the efficiency ratio, non-interest expense divided by total revenues. A good benchmark for efficiency is a 50% efficiency ratio. The average efficiency ratio for commercial banks in 2025 was 56%. PBAM’s efficiency ratio is 49% for 2025.
PBAM has generated on average returns on equity of 18% over the past five years. This has been an increase from an average of 6% in the previous five year period. The average incremental return on equity over the past five years has been 23%, see the calculation below. The ability to generate these returns is the result of increased efficiency (lower efficiency ratio), expansion in existing and new markets and providing new services. Loan growth has been robust with 20% per year growth from 2013 to 2018 to 17% per year growth from 2019 to 2023. Below is a return on incremental equity capital (“RoIEC”) analysis for PBAM:
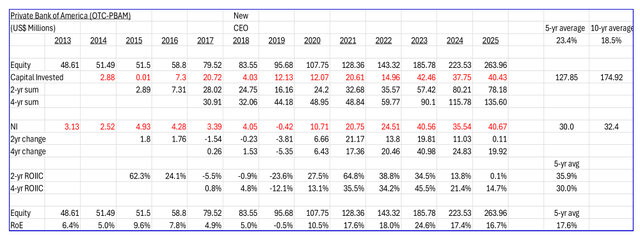
PBAM has four levers for earnings growth: 1) expansion into new markets; 2) new services; 3) increased efficiency; and 4) distributing excess cash by buying back shares.
PBAM has economies of scale in the service markets it currently or historically competed in (small business and real estate collateral loans). They also have scale based upon the volume of the loans they originate and branch lite strategy they implement; so as they grow, they should become more efficient.
PBAM competes in California’s San Diego, South Central Coast and the Los Angeles area banking markets. The table below illustrates the population, income and housing price growth over the past five and ten years in the three metropolitan statistical areas (“MSAs”) PBAM competes in:

These are healthy growth rates for PBAM to provide loans into. PBAM’s management feels it is servicing 5 to 10% of the addressable market (small business and real estate executives who value time/convenience over cost) in the San Diego, Los Angeles and Orange County regions. As PBAM expands geographically as it has with its recent Montecito team acquisition its target market will expand even further.
PBAM’s risks include both operational leverage and financial leverage. Operational leverage is based upon the fixed vs. variable costs of the operations. There are economies of scale related to some functions such as loan processing and cross-selling of banking services. For banks the amount of non-interest income can provide downside protection especially if this revenue is recurring as is the case for PBAM. Over the past five years, about 8% of PBAM’s revenues were from non-interest income.
PBAM’s balance sheet, as of December 31, 2025 is comprised of $305 million of cash, $234 million of securities and $1.226 billion of loans. The securities have a $26 million mark to market losses which should decline as the securities mature. The largest part of the loan portfolio includes: non-owner occupied commercial real estate loans (26% of loans), commercial and industrial loans (22% of loans), SBA secured by real estate loans (20% of loans), and owner occupied commercial real estate loans (11% of loans).
Financial leverage can be measured by the equity/assets and CET1 ratios. PBAM has higher equity/assets of 10.4% and CET1 of 12.6% than other niche lenders (like Northeast Bank, Merchants Bank of Indiana and FFB Bancorp). The historical financial performance for PBAM is illustrated below.
PBAM’s management originations are about 30% SBA loans and 20% if its total portfolio are SBA loans. PBAM has been awarded the Top 5% banks by American Banker, the #1 community bank SBA 504 lender and ranked the tenth best bank by Bank Director magazine.
Management compensation incentives are not disclosed by PBAM but overall efficiency (including management compensation) is reasonable at 49% during 2025. Board members have a significant
investment in PBAM. The board and management owns 1.670 million shares, about 29% of shares outstanding (116.9 million). Stock options provided to management and employees were equal to 0.4% per year of the shares outstanding over the past three years.
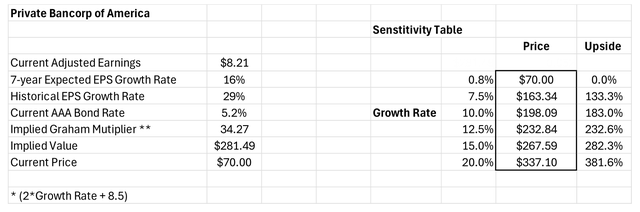
The key to the valuation of PBAM is the expected growth rate. The current valuation implies an earnings/FCF increase of 0.8% in perpetuity using the Graham formula ((8.5 + 2g)). The historical 5-year earnings per share growth has been 29% per year and the 5-year average return on equity of 17%.
A bottom-up analysis based upon PBAM’s market growth rates (California housing and business development loan markets) and historical growth rates results in an estimated 16% projected EPS growth rate driven by expected loan growth rates of 15-20% per year consistent with history. Historically, PBAM’s EPS growth rate was 29% per year driven by new service offerings and new customer relationships over ten years. Using a 16% expected growth rate, the resulting current multiple is 36x of earnings, while PBAM trades at an earnings multiple of about 8.5x. If we use a 3% growth rate, the implied multiple is 15x. If we apply 15x earnings to PBAM’s current earnings of $8.21, then we arrive at a value of $123 per share, which is a reasonable short-term target. If we use a 16% seven-year growth rate, then we arrive at a value of $281 per share. This results in a five-year IRR of 32%.
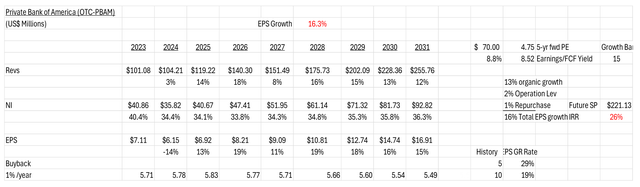
Another way to look at growth and the valuation of companies is to estimate the EPS five years into the future and see how much of today’s price incorporates this growth. We are also assuming about 10% of net income will be used for buy-backs. Using the same revenue described above results in a 2031 EPS of $16.91, or 4.8x the current price. If we assume a growth bank multiple of 15x, or $221 per share, lower than the five-year-forward valuation above of $281 per share.
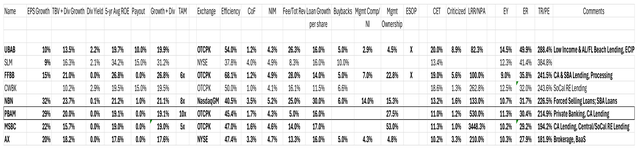
Below are the highest growth specialty banks firms located in the United States. Most of PBAM’s competitors are private banks. I have ranked the public banks by expected return as calculated as the sum of the earnings yield plus the earnings growth rate. Compared to the specialty banks, PBAM has one of the highest 5-year average return on equity and TBV plus dividends growth and the lowest criticized loan amounts.
The primary risks are:
• slower-than-expected market growth due to slower than expected loan growth;
• higher-than-expected efficiency ratios; and
• a lack of new investment opportunities (SBA and business development loans) and/or coupled with higher stock prices making buybacks less accretive.
The primary catalysts are:
• faster-than-expected SBA and business development loan growth; and
• lower than expected efficiency ratios due to economies of scale.
The short-term target is $123 per share, which is almost 57% above today’s stock price. If the continued service growth due to geographic expansion plays out over the next five years (with a resulting 16% earnings per year growth rate), then a value of $251, an average of $281 and $221 derived above, could be realized. This is a 29% IRR over the next five years.
Paid subscribers can keep reading for nine additional ideas, including two highly moated financial infrastructure companies facing disruption fears, a global healthcare leader with significant margin and pipeline upside, a cash-generative vacation ownership business aggressively repurchasing shares, a clinical-stage biotech approaching major catalysts, and a restaurant turnaround with new leadership and substantial operating leverage.
If you find value in seeing how professional investors frame new ideas, upgrade to keep reading all ten pitches and get access to the full archive.
Need a nudge? Many subscribers work in asset management, research, or corporate finance and expense it as a research tool. Here’s a quick script you can use.
Hi [Manager’s Name],
I’d like to expense a subscription to Elevator Pitches, a newsletter that curates stock ideas from professional investor letters, often highlighting overlooked opportunities and special situations.
With a paid subscription, I’d receive full access to every stock write-up they publish each week, which would support my ongoing market research and idea generation.
The cost is $90 for the full year. Given the depth and frequency of the analysis, I think it’s a cost-effective addition to my research toolkit.
Please let me know if this works.
Best,
[Your Name]
Comments
Nothing yet. Say the first thing.
Sign in to join the conversation.