
This weekly email has three parts: the Schedule of economic data for the following week, a Review of data for the previous week, and a brief Commentary on a current topic.
The key report this coming week is the July employment report.
----- Monday, August 10th -----
No major economic releases scheduled.
----- Tuesday, August 11th -----
6:00 AM ET: NFIB Small Business Optimism Index for July.
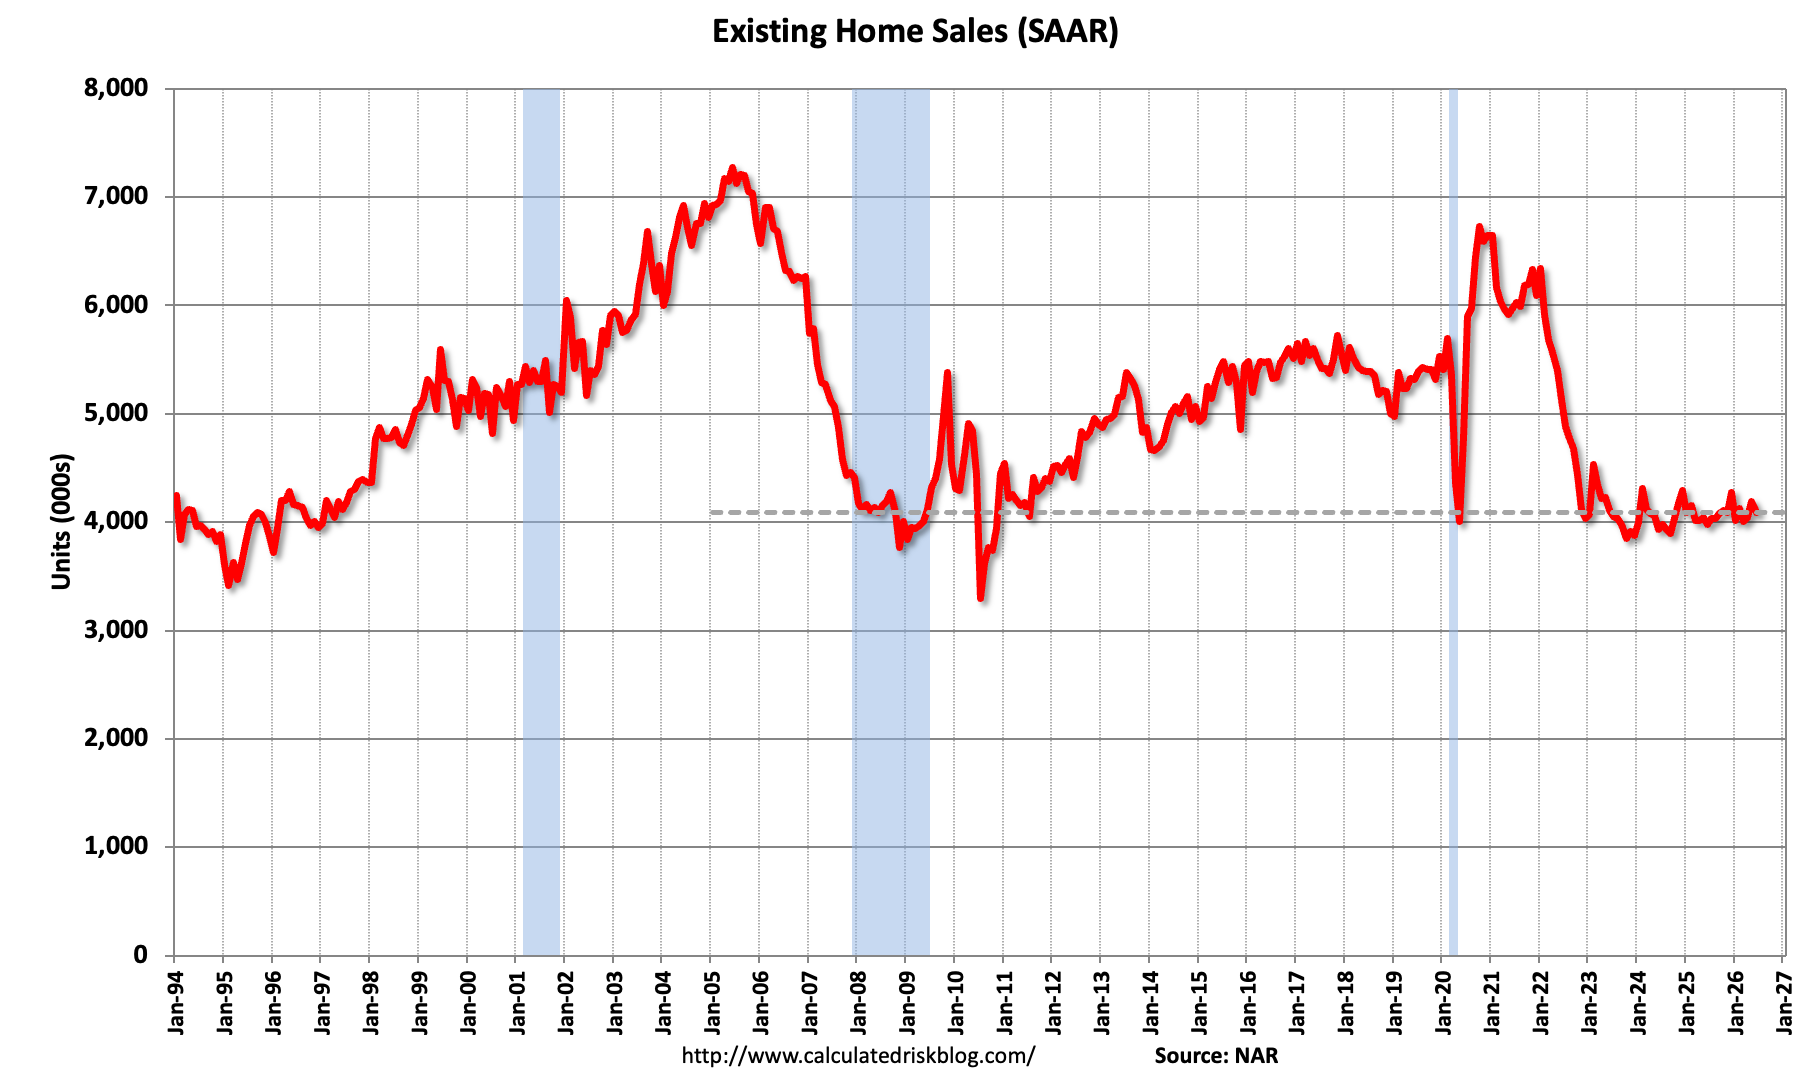
10:00 AM: Existing Home Sales for July from the National Association of Realtors (NAR). The consensus is for 4.07 million SAAR, down from 4.09 million in June. This graph shows existing home sales, on a Seasonally Adjusted Annual Rate (SAAR) basis since 1994.
11:00 AM: NY Fed: Q2 Quarterly Report on Household Debt and Credit
----- Wednesday, August 12th -----
7:00 AM: The Mortgage Bankers Association (MBA) will release the results for the mortgage purchase applications index.
8:30 AM: The Consumer Price Index for July from the BLS. The consensus is for a 0.1% increase in CPI, and a 0.2% increase in core CPI. The consensus is for CPI to be up 3.4% Year-over-year (YoY), and core CPI to be up 2.5% YoY.
----- Thursday, August 13th -----
8:30 AM: The initial weekly unemployment claims report will be released. The consensus is for initial claims to decrease to 198 thousand from 199 thousand last week.
8:30 AM: The Producer Price Index for July from the BLS. The consensus is for a 0.1% increase in PPI, and a 0.2% increase in core PPI.
----- Friday, August 14th -----
8:30 AM: Retail sales for July is scheduled to be released. The consensus is for a 0.2% increase in retail sales.
10:00 AM: University of Michigan's Consumer sentiment index (Preliminary for July).
• Freddie Mac House Price Index Increased in June; Up 2.1% Year-over-year
• Asking Rents Continue to Decline Year-over-year
• Early Look at Local Housing Markets in July
• Single Family Inventory Up Slightly Year-over-year
The data last week was mostly below expectations.
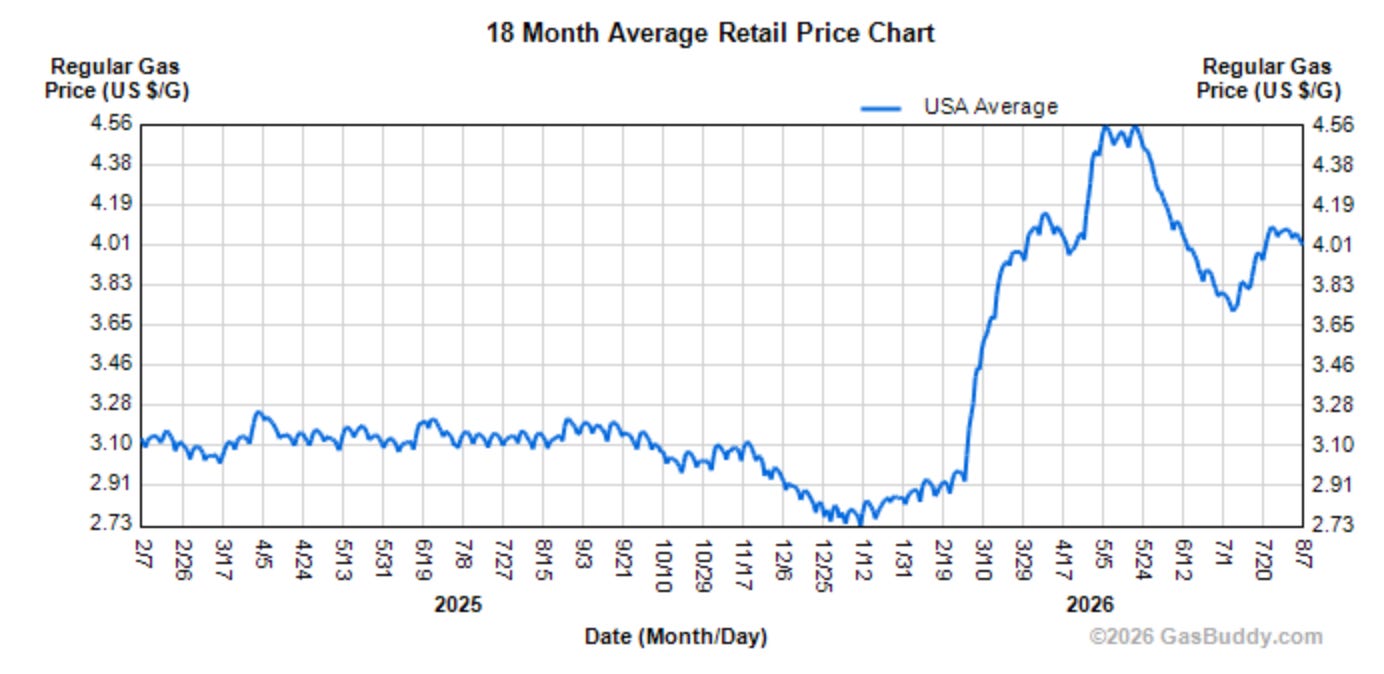
• Oil and Gas prices. WTI oil prices are at $77 per barrel as of this writing, up close to 20% since the start of the war (down from recent peak). The national average gasoline price is $4.03 per gallon, up 37% since the end of February, but down from the recent peak of $4.56 per gallon.
• Employment Report for July.
Both nonfarm payroll employment (-23,000) and the unemployment rate (4.1 percent) changed little in July
This was well below the consensus estimate and the previous two months were revised down sharply.
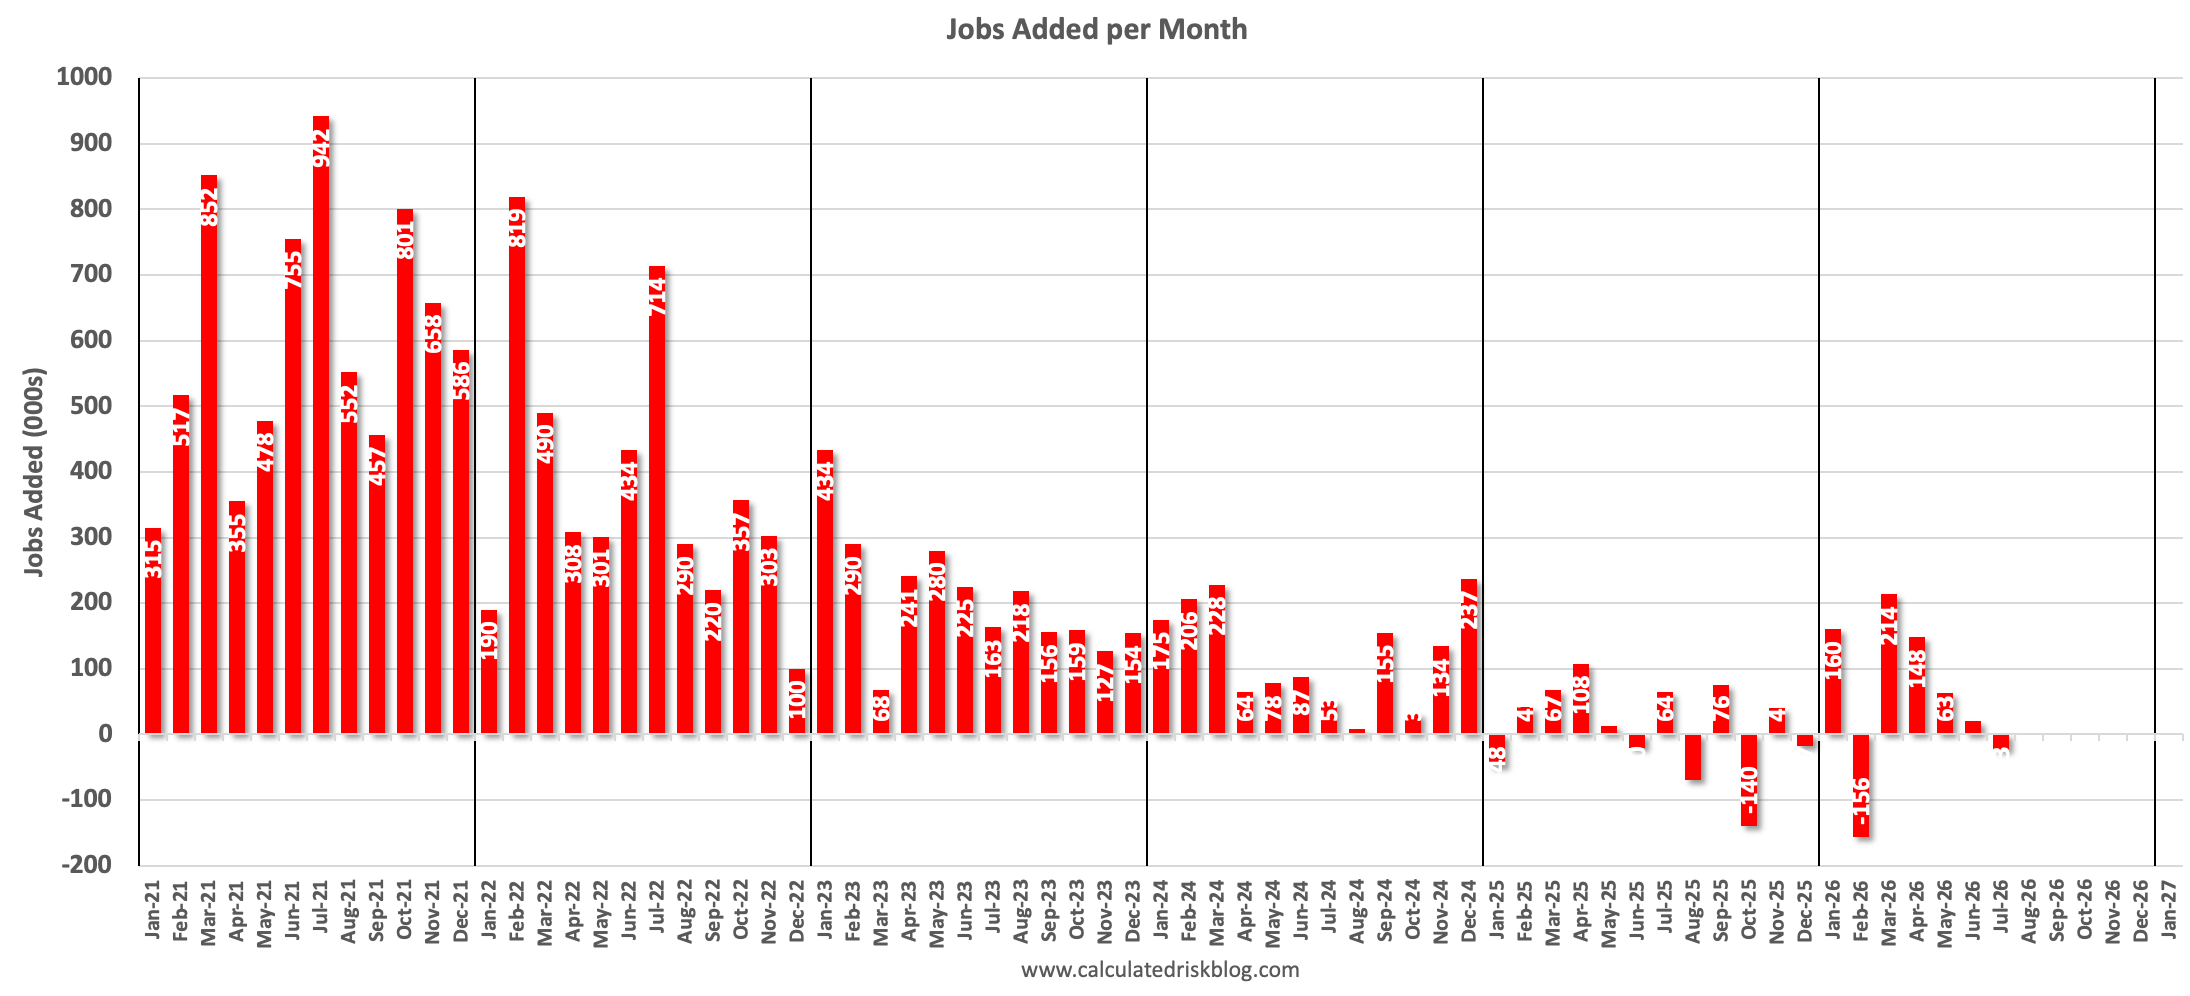
This graph shows the jobs added per month since January 2021. The economy has only added 316 thousand jobs over the last 12 months! The weak job market might keep the FOMC on hold in September.
• Construction Spending for June.
Construction spending during June 2026 was estimated at a seasonally adjusted annual rate of $2,166.5 billion, 0.1 percent (±0.8 percent)* below the revised May estimate of $2,168.5 billion. The June figure is 3.2 percent (±1.5 percent) below the June 2025 estimate of $2,237.7 billion.
This was below the consensus forecast of a 0.2% increase in construction spending.
• ISM Manufacturing Index for July.
“The Manufacturing PMI® registered 55.6 percent in July, 2.3 percentage points above the June figure and the highest reading since May 2022 (55.9 percent). … The Employment Index reading of 52.8 percent is up 3.1 percentage points from June’s figure of 49.7 percent, putting the index in expansion territory for the first time in 33 months,”
This was well above the consensus forecast of an increase to 54.0.
• Light vehicle sales for July.
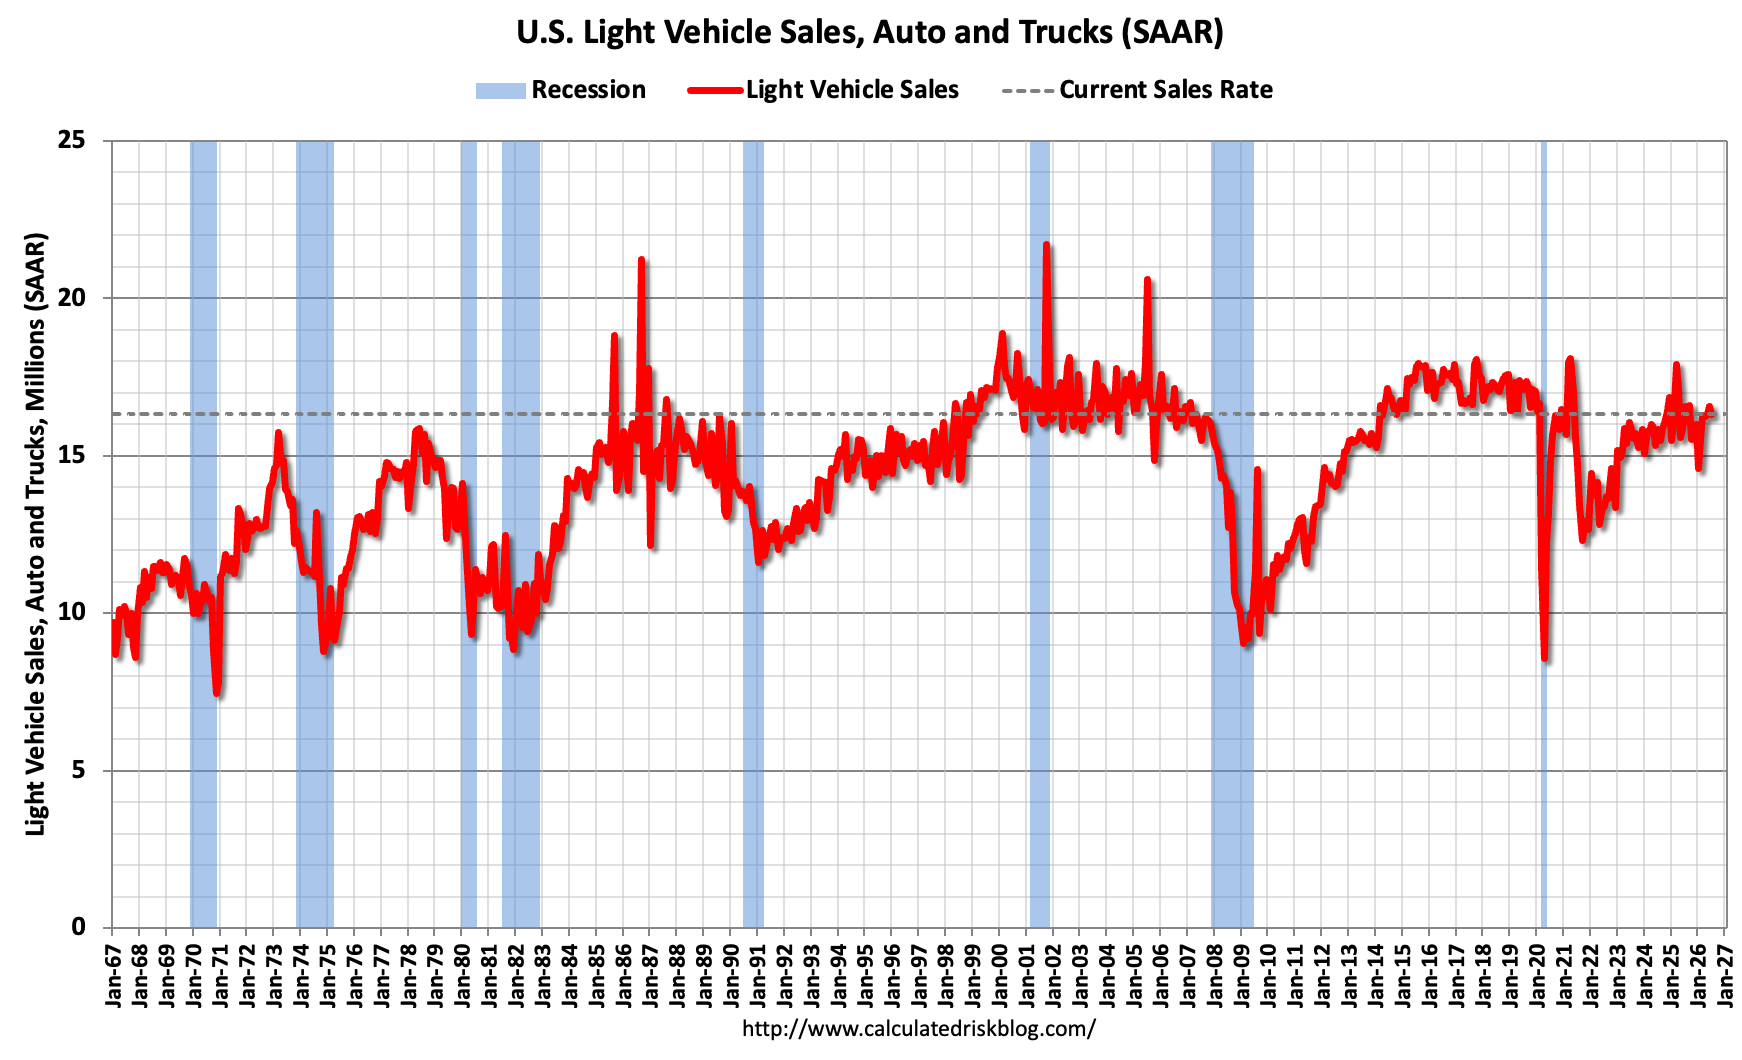
Light vehicle sales were at the consensus forecast of 16.3 million SAAR in July, down from 16.5 million SAAR in June.
• U.S. International Trade in Goods and Services for June
The U.S. Census Bureau and the U.S. Bureau of Economic Analysis announced today that the goods and services deficit was $73.3 billion in June, down $4.4 billion from $77.6 billion in May, revised.
This was close to the consensus forecast.
• Job Openings and Labor Turnover Survey for June
The number of job openings was little changed at 7.4 million in June, the U.S. Bureau of Labor Statistics reported today. Hires were unchanged at 5.3 million, while total separations changed little at 5.4 million. Within separations, quits (3.2 million) and layoffs and discharges (1.8 million) were unchanged.
About as expected.
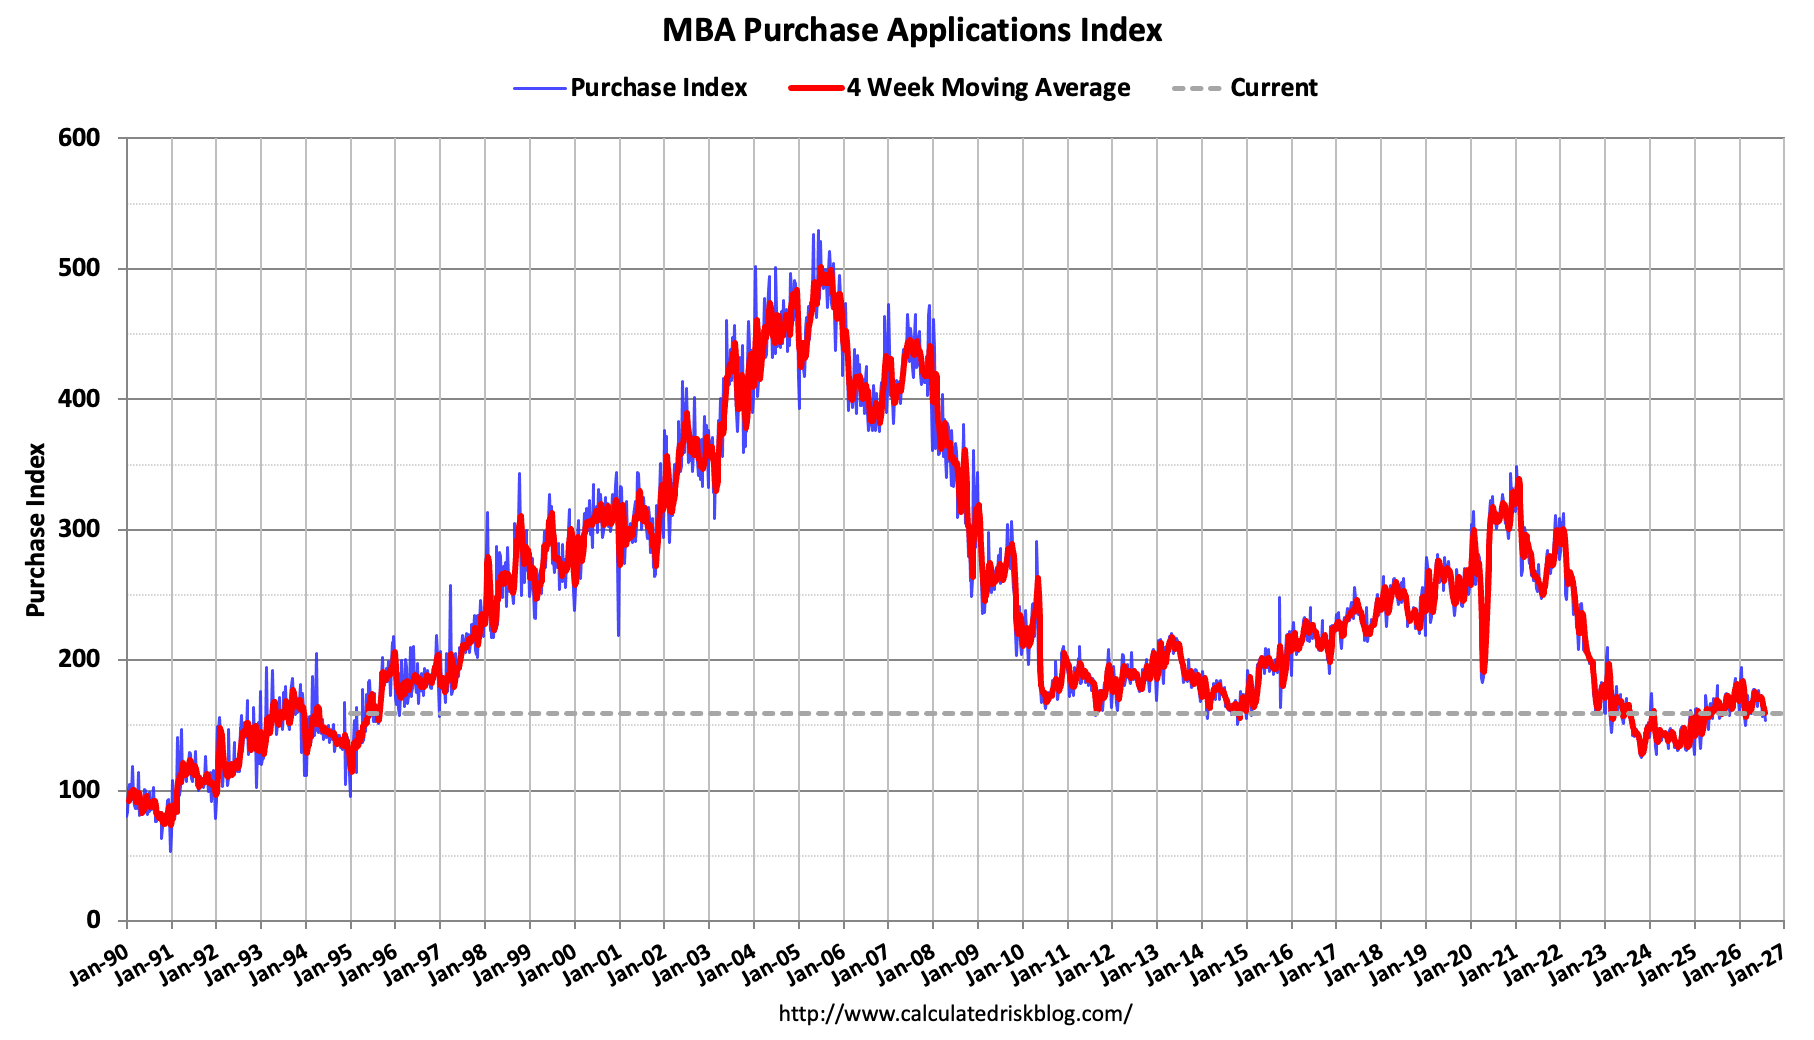
• The mortgage purchase applications index from the Mortgage Bankers Association (MBA).
The seasonally adjusted Purchase Index decreased 4 percent from one week earlier. The unadjusted Purchase Index decreased 4 percent compared with the previous week and was 3 percent lower than the same week one year ago.
This was down year-over-year and this index remains historically weak.
• The ADP Employment Report for July.
Private employers added 44,000 jobs in July
This was below the consensus forecast of 75,000 payroll jobs added in July.
• The ISM Services Index for July.
In July, the Services PMI® registered 54.1 percent, an increase of 0.1 percentage point compared to June’s figure of 54 percent. … The Employment Index returned to contraction territory after only one month in expansion with a reading of 47.4 percent, a 3.8-percentage point decrease from the 51.2 percent recorded in June.
This was slightly below the consensus forecast of 54.3. Employment was weak.
• The initial weekly unemployment claims report.
In the week ending August 1, the advance figure for seasonally adjusted initial claims was 199,000, an increase of 1,000 from the previous week’s revised level. The previous week’s level was revised up by 1,000 from 197,000 to 198,000.
This was lower than expected.
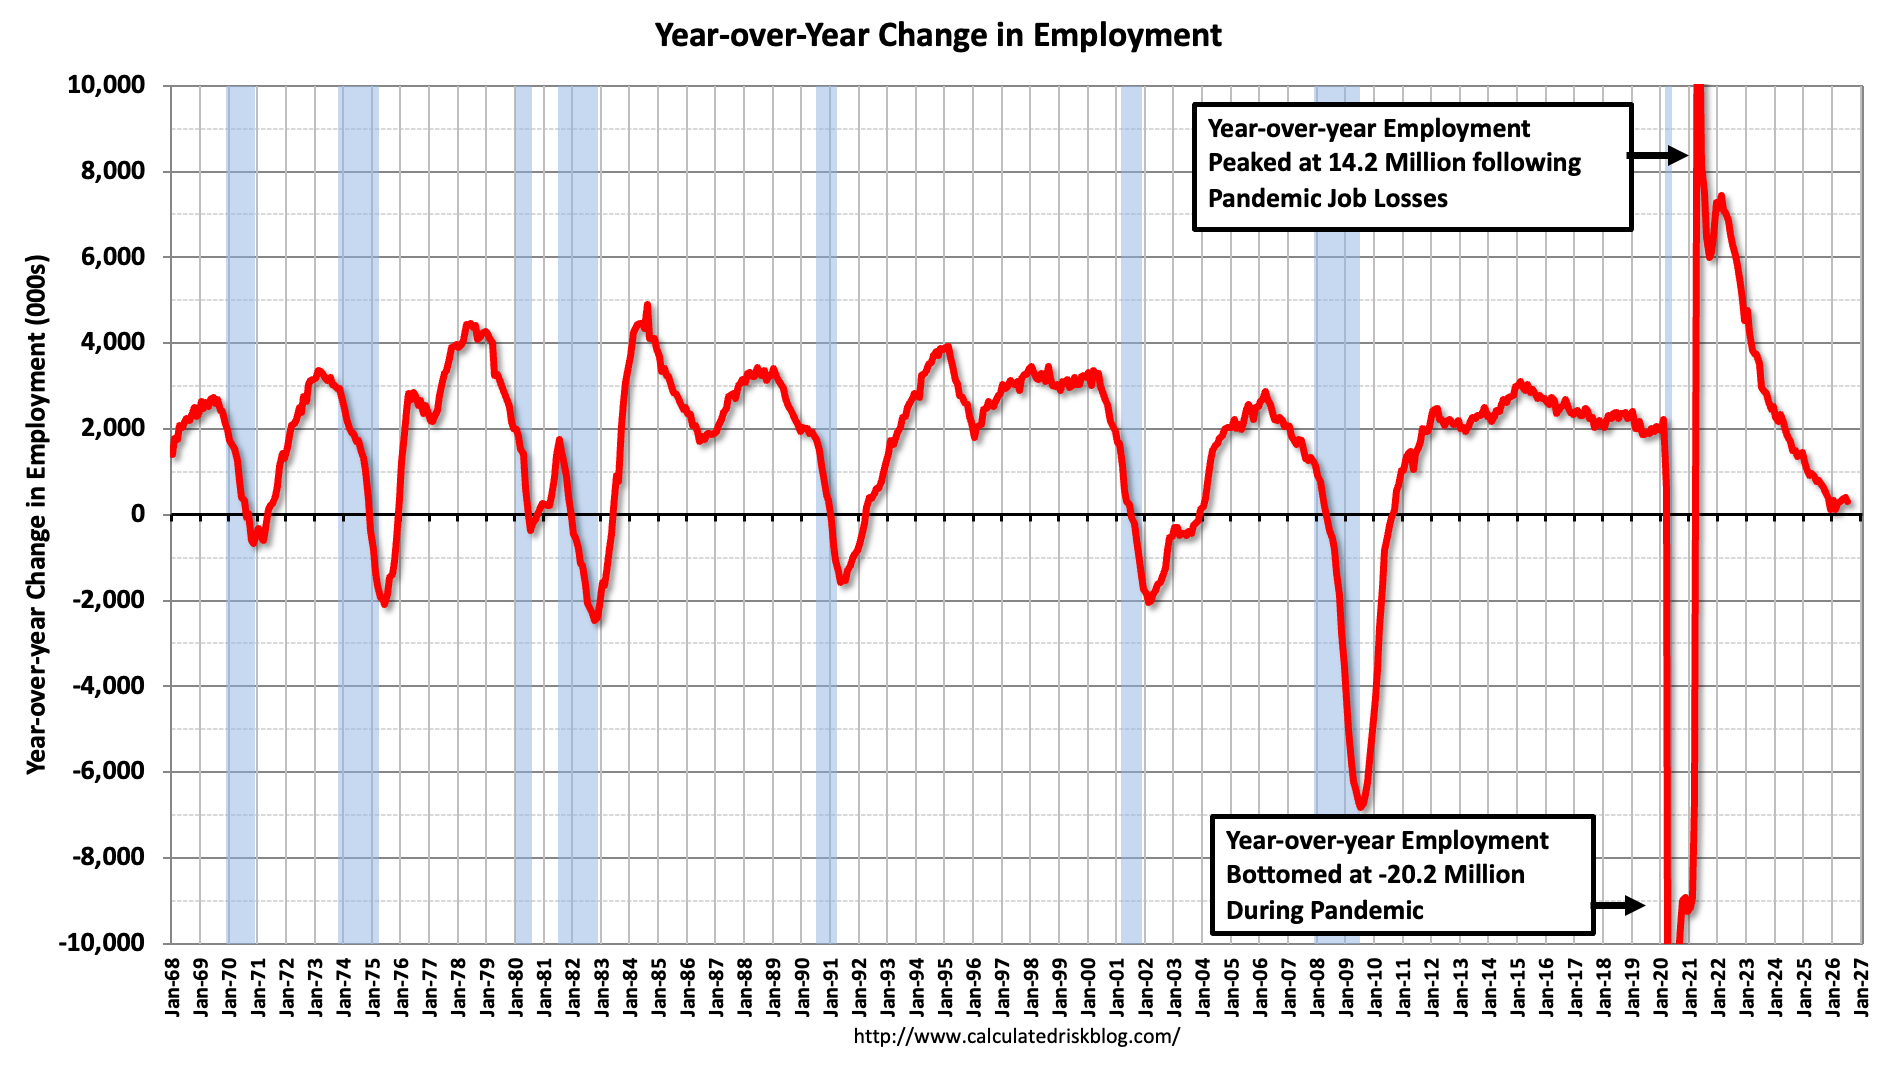
As I mentioned above, the July employment report was weak. Total payrolls decreased by 23 thousand in July. Private payrolls increased by 30 thousand, and public payrolls decreased 53 thousand (mostly local education that is likely a timing issue).
Payrolls for May and June were revised down by 169 thousand, combined. The economy has only added 316 thousand jobs over the last year.
The next graph shows the employment population ratio and the participation rate.
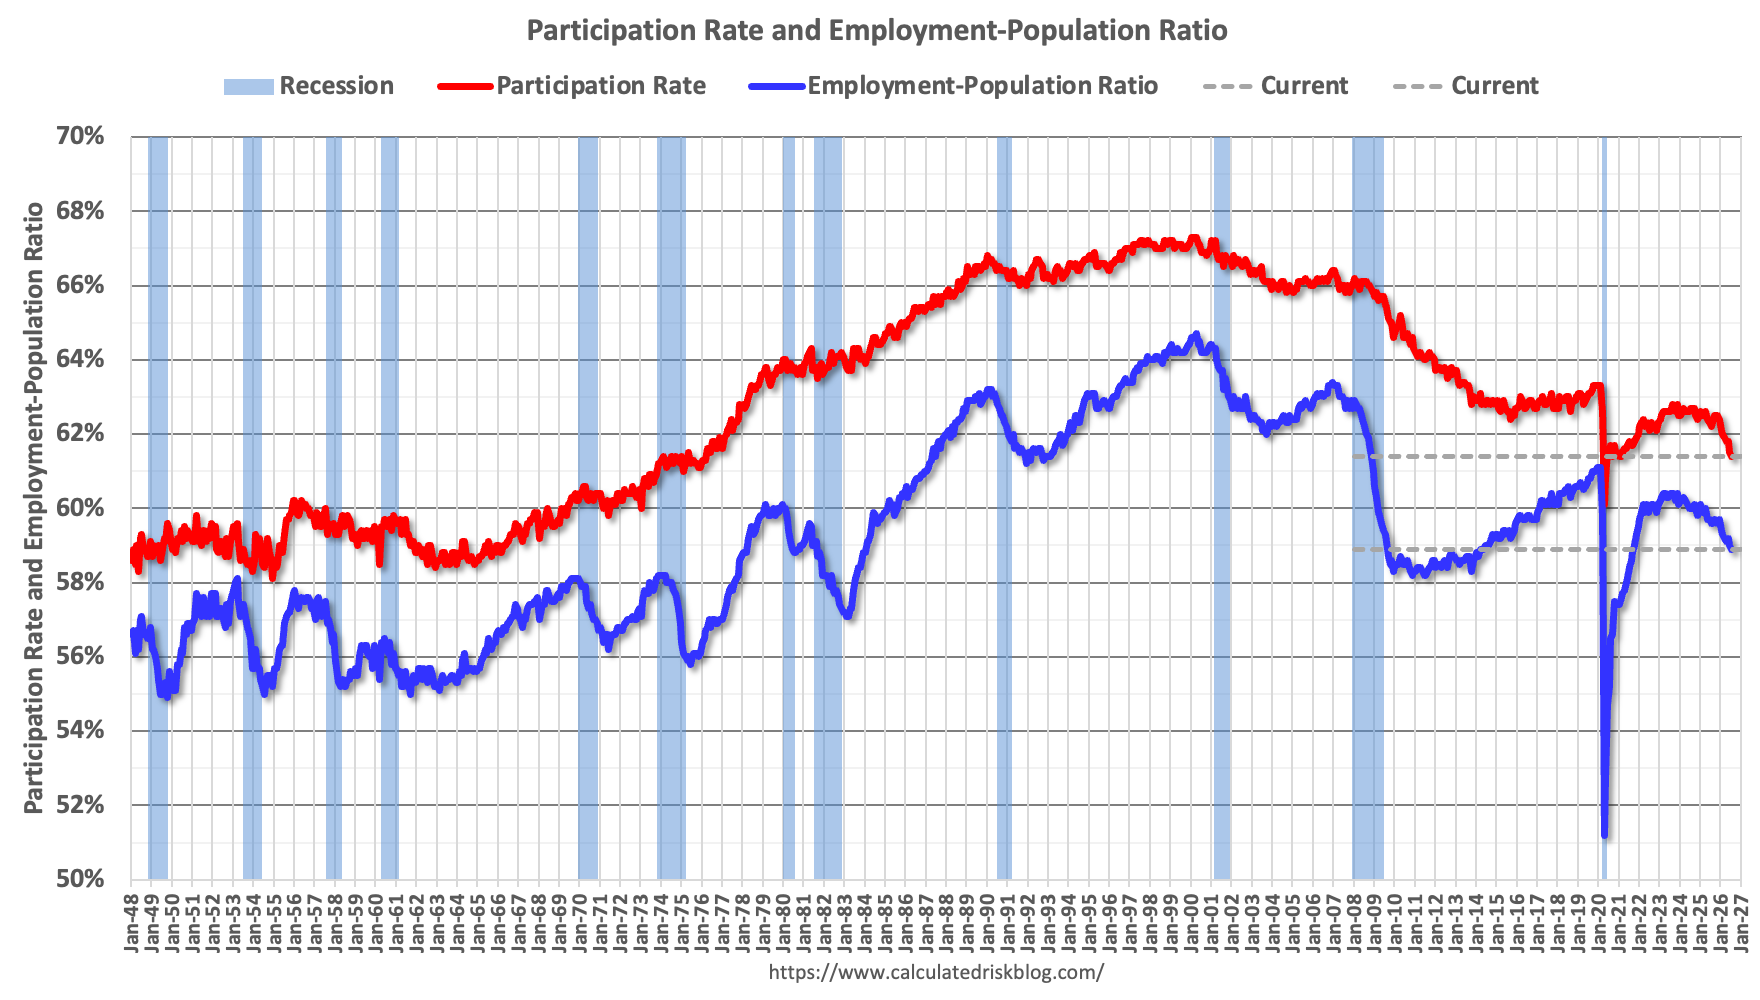
The Labor Force Participation Rate decreased to 61.4% in July, from 61.5% in June - and down from 62.2% in July 2025. This is the percentage of the working age population in the labor force. The Employment-Population ratio decreased to 58.9% from 59.0% in June (blue line).
The collapse in the participation rate is a significant story. Some of this is related to older workers retiring. I’ll have more on this in a future commentary.
Thanks for reading Economic Weekly! This post is public so feel free to share it.
No posts
Comments
Nothing yet. Say the first thing.
Sign in to join the conversation.