
This weekly email has three parts: the Schedule of economic data for the following week, a Review of data for the previous week, and a brief Commentary on a current topic.
The key reports this coming week are Q2 GDP, July Personal Income & Outlays, July New Home sales and June Case-Shiller house prices.
Fed Chairman Warsh speaks at the 2026 Jackson Hole Economic Policy Symposium on Friday.
----- Monday, August 24th -----
8:30 AM: Chicago Fed National Activity Index for July. This is a composite index of other data.
----- Tuesday, August 25th -----
9:00 AM: FHFA House Price Index for June.
9:00 AM: S&P/Case-Shiller House Price Index for June.
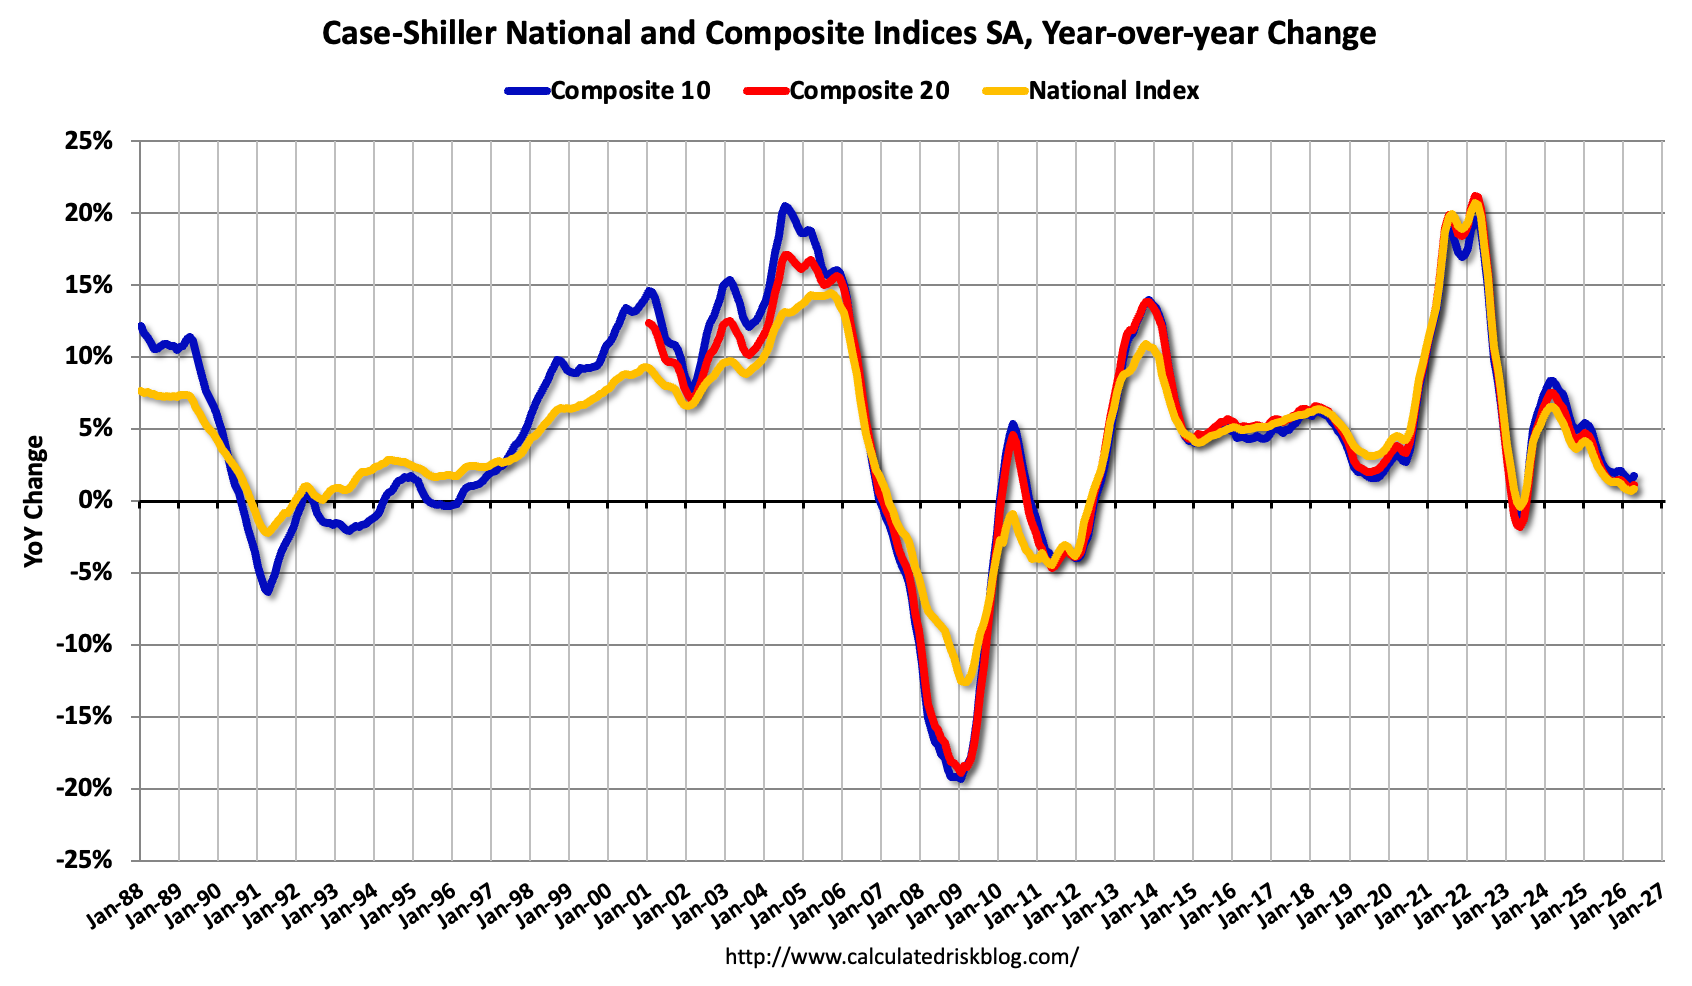
This graph shows the year-over-year change for the Case-Shiller National, Composite 10 and Composite 20 indexes, through the most recent report. The consensus is for a 1.3% year-over-year increase in the National index for June up from 1.1% in May.
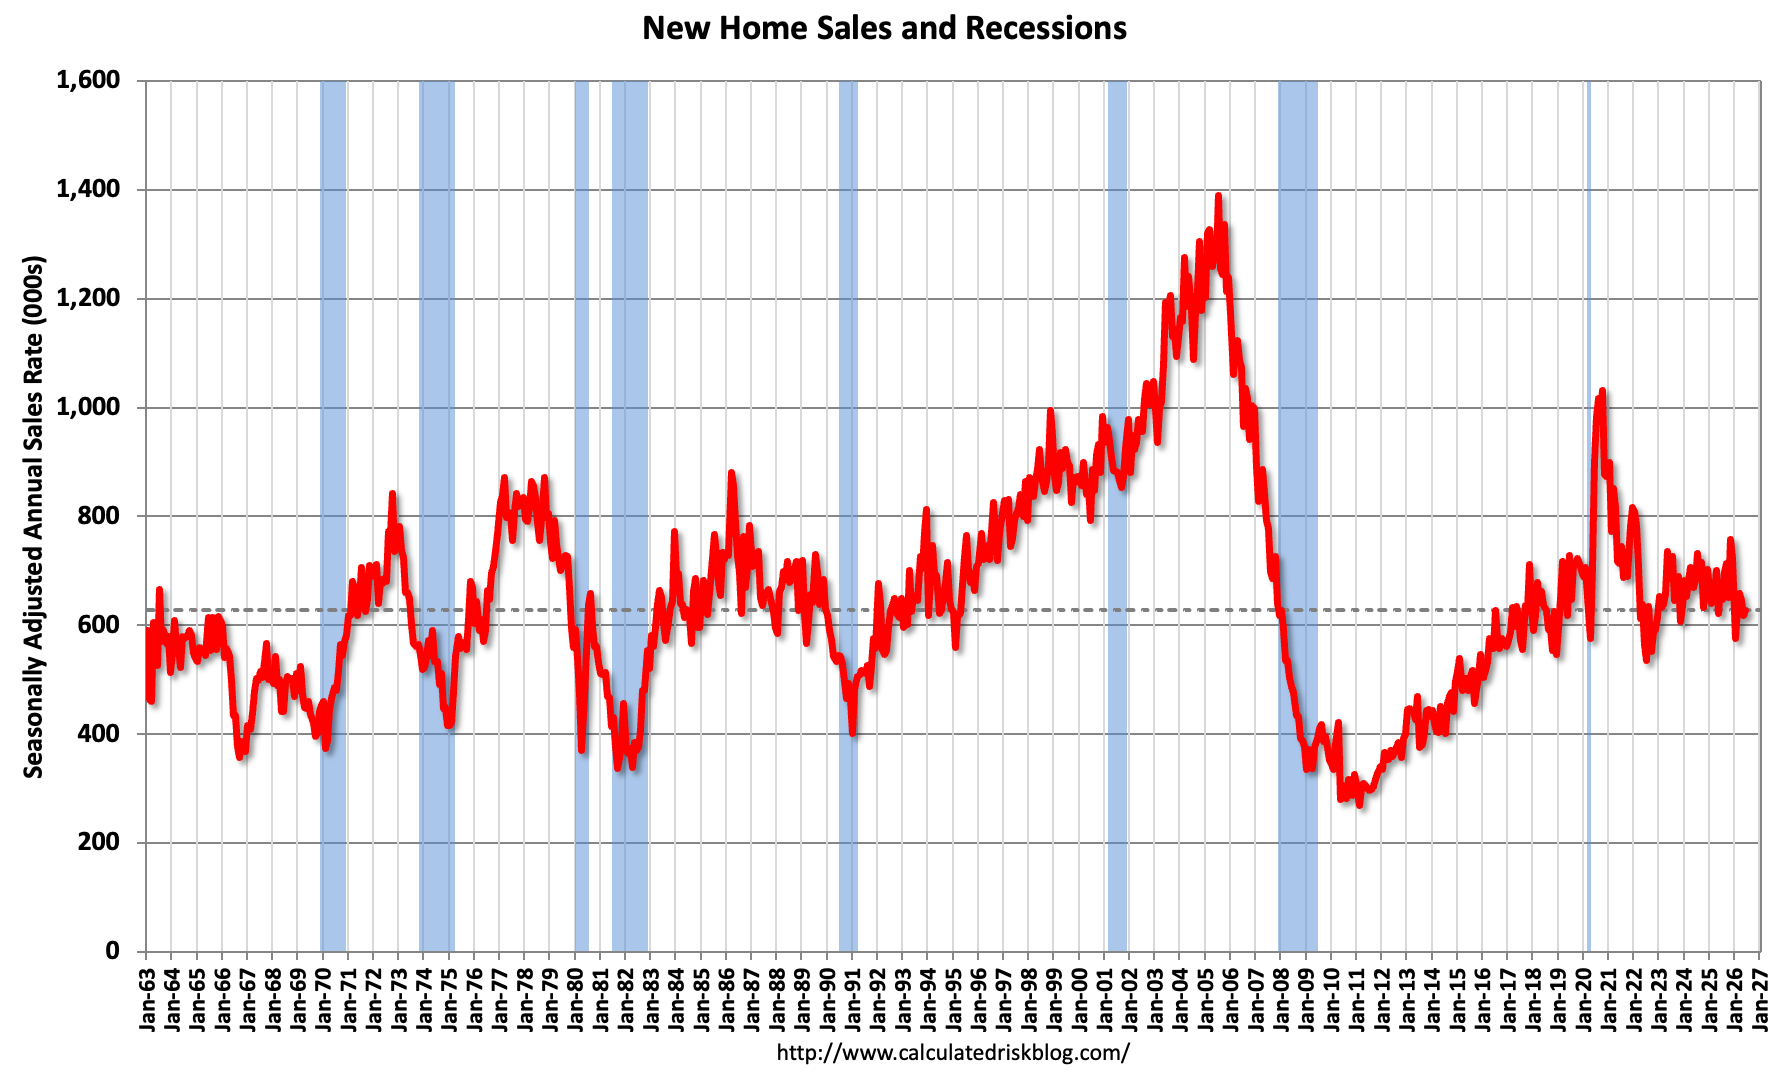
10:00 AM: New Home Sales for July from the Census Bureau. This graph shows New Home Sales since 1963. The dashed line is the sales rate for last month. The consensus is for 630 thousand SAAR in July, up from 628 thousand in June.
10:00 AM: Richmond Fed Survey of Manufacturing Activity for August. The consensus is for a reading of 7, up from 5 in July.
----- Wednesday, August 26th -----
7:00 AM: The Mortgage Bankers Association (MBA) will release the results for the mortgage purchase applications index.
8:30 AM: Durable Goods Orders for July. The consensus is for a 0.7% increase in durable goods.
8:30 AM: Gross Domestic Product (Second Estimate), 2nd Quarter 2026. The consensus is that real GDP increased 1.5% annualized in Q2.
8:30 AM: Personal Income and Outlays, July 2026. The consensus is for a 0.3% increase in personal income, and for a 0.2% increase in personal spending. And for the PCE price index to increase 0.1%.
----- Thursday, August 27th -----
8:30 AM: The initial weekly unemployment claims report will be released. The consensus is for initial claims to increase to 209 thousand from 206 thousand last week.
11:00 AM: Kansas City Fed Survey of Manufacturing Activity for August.
----- Friday, August 28th -----
9:45 AM: Chicago Purchasing Managers Index for August. The consensus is for a decrease to 57.0 from 57.6.
10:00 AM Current Employment Statistics Preliminary Benchmark (National) for March 2026
10:00 AM: University of Michigan’s Consumer sentiment index (Final for August). The consensus is for a reading of 51.0.
10:00 AM: Speech, Fed Chairman Kevin Warsh, Keynote Remarks, At the 2026 Jackson Hole Economic Policy Symposium, Moran, Wyo.
• Housing Starts Decreased to 1.293 million Annual Rate in July
• MBA: Mortgage Delinquencies Decreased in Q2 2026
• Architecture Billings “Remain weak” in July
The data last week was mostly better than expected (except housing data).
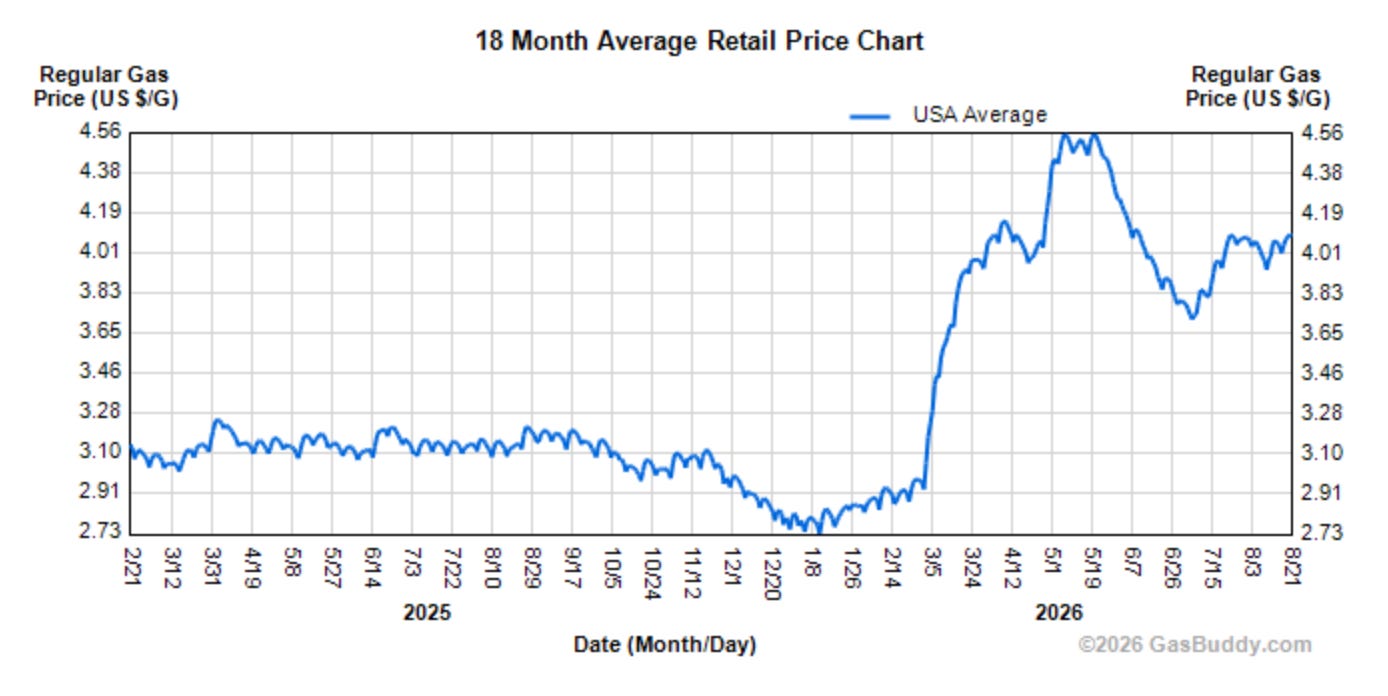
• Oil and Gas prices. WTI oil prices are at $87 per barrel as of this writing, up about 35% since the start of the war (down from recent peak). The national average gasoline price is $4.10 per gallon, up 40% since the end of February, but down from the war peak of $4.56 per gallon.
• New York Fed Empire State manufacturing survey for August.
Business activity grew strongly in New York State in August, according to firms responding to the Empire State Manufacturing Survey. The headline general business conditions index rose five points to 20.6, its highest reading in more than four years.
This was well above the consensus estimate for a reading of 9.6.
• August NAHB homebuilder survey.
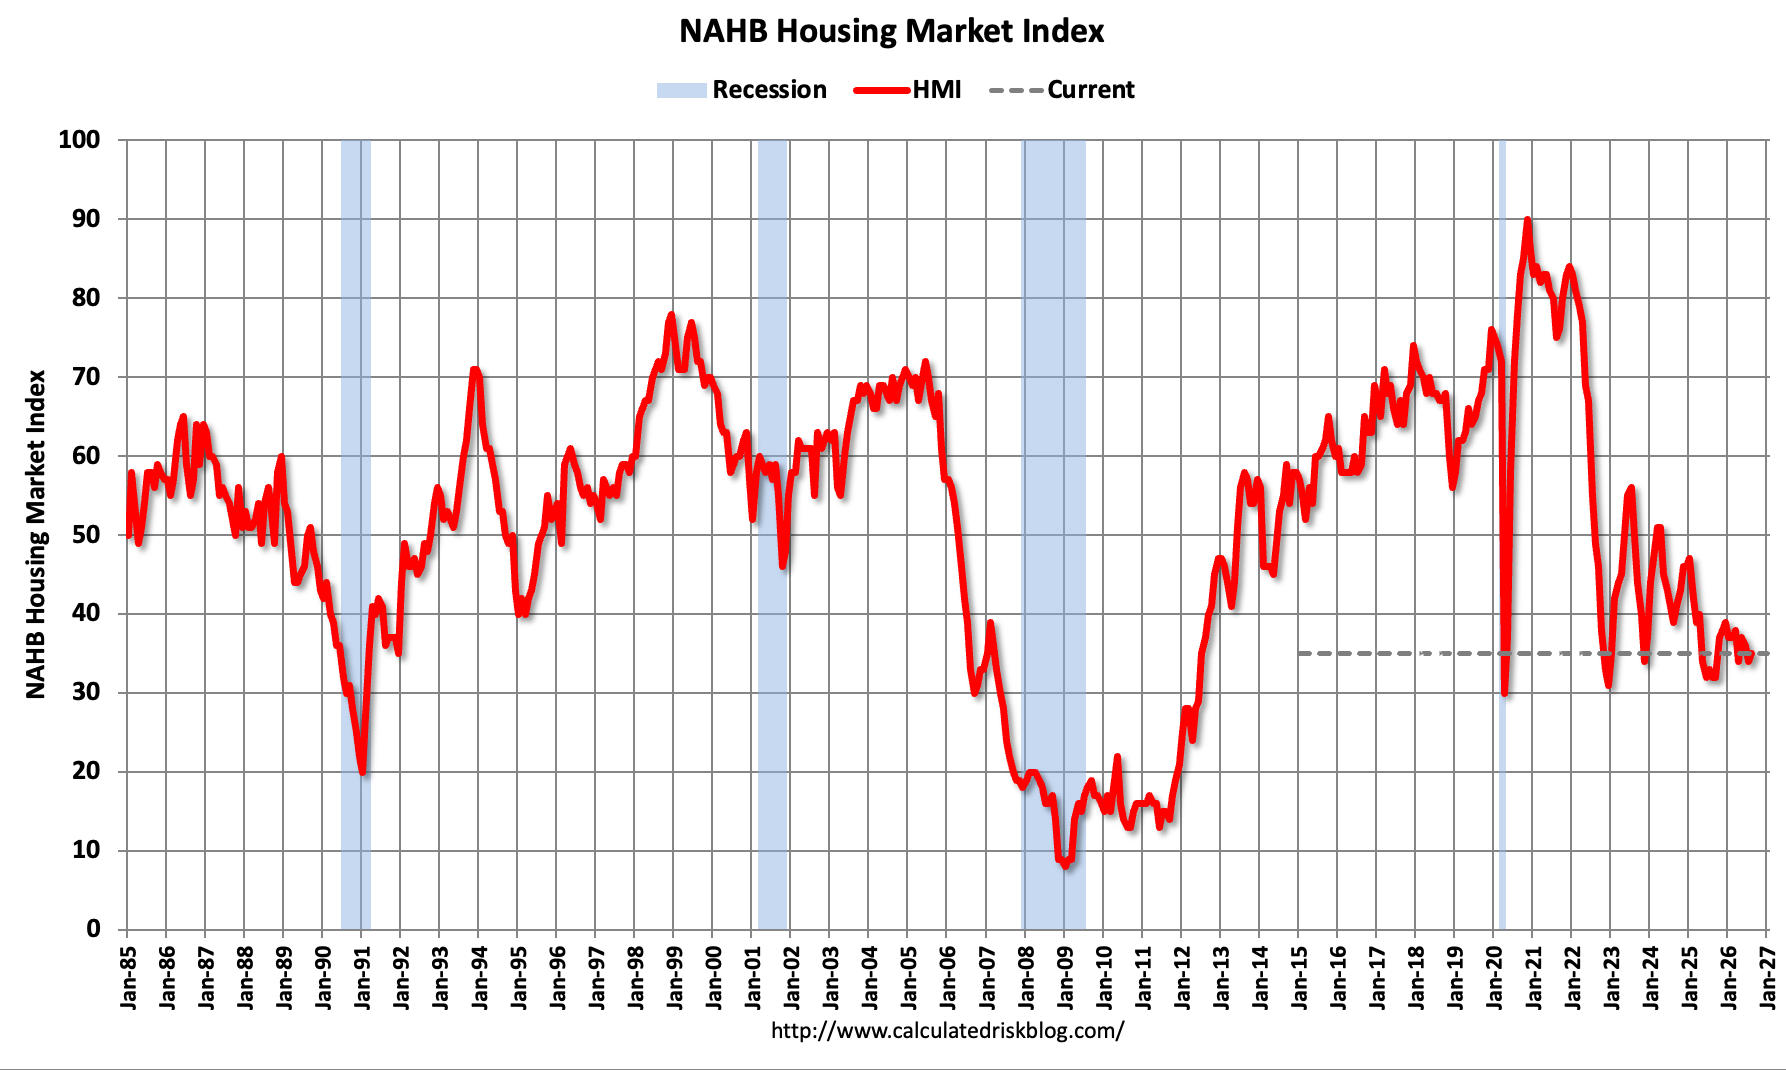
Builder confidence in the market for newly built single-family homes inched up one point to 35 in August, according to the National Association of Home Builders (NAHB)/Wells Fargo Housing Market Index (HMI)
This was slightly above the consensus estimate.
• Industrial Production and Capacity Utilization for July.
Industrial production (IP) and manufacturing production each grew 0.2 percent in July after growing 0.3 percent in June. In July, the indexes for mining and for utilities increased 0.2 percent and 0.5 percent, respectively. Manufacturing output excluding motor vehicles and parts increased 0.4 percent. At 103.0 percent of its 2017 average, total IP in July was 1.1 percent above its year-earlier level. Capacity utilization edged up to 76.3 percent, a rate that is 3.1 percentage points below its long-run (1972–2025) average.
This was slightly below the consensus estimate.
• NAR Pending Home Sales Index for July
Pending home sales in July decreased by 2.3% month-over-month and 2.2% year-over-year, according to the National Association of REALTORS®
This was well below the consensus for a 0.5% increase in this index.
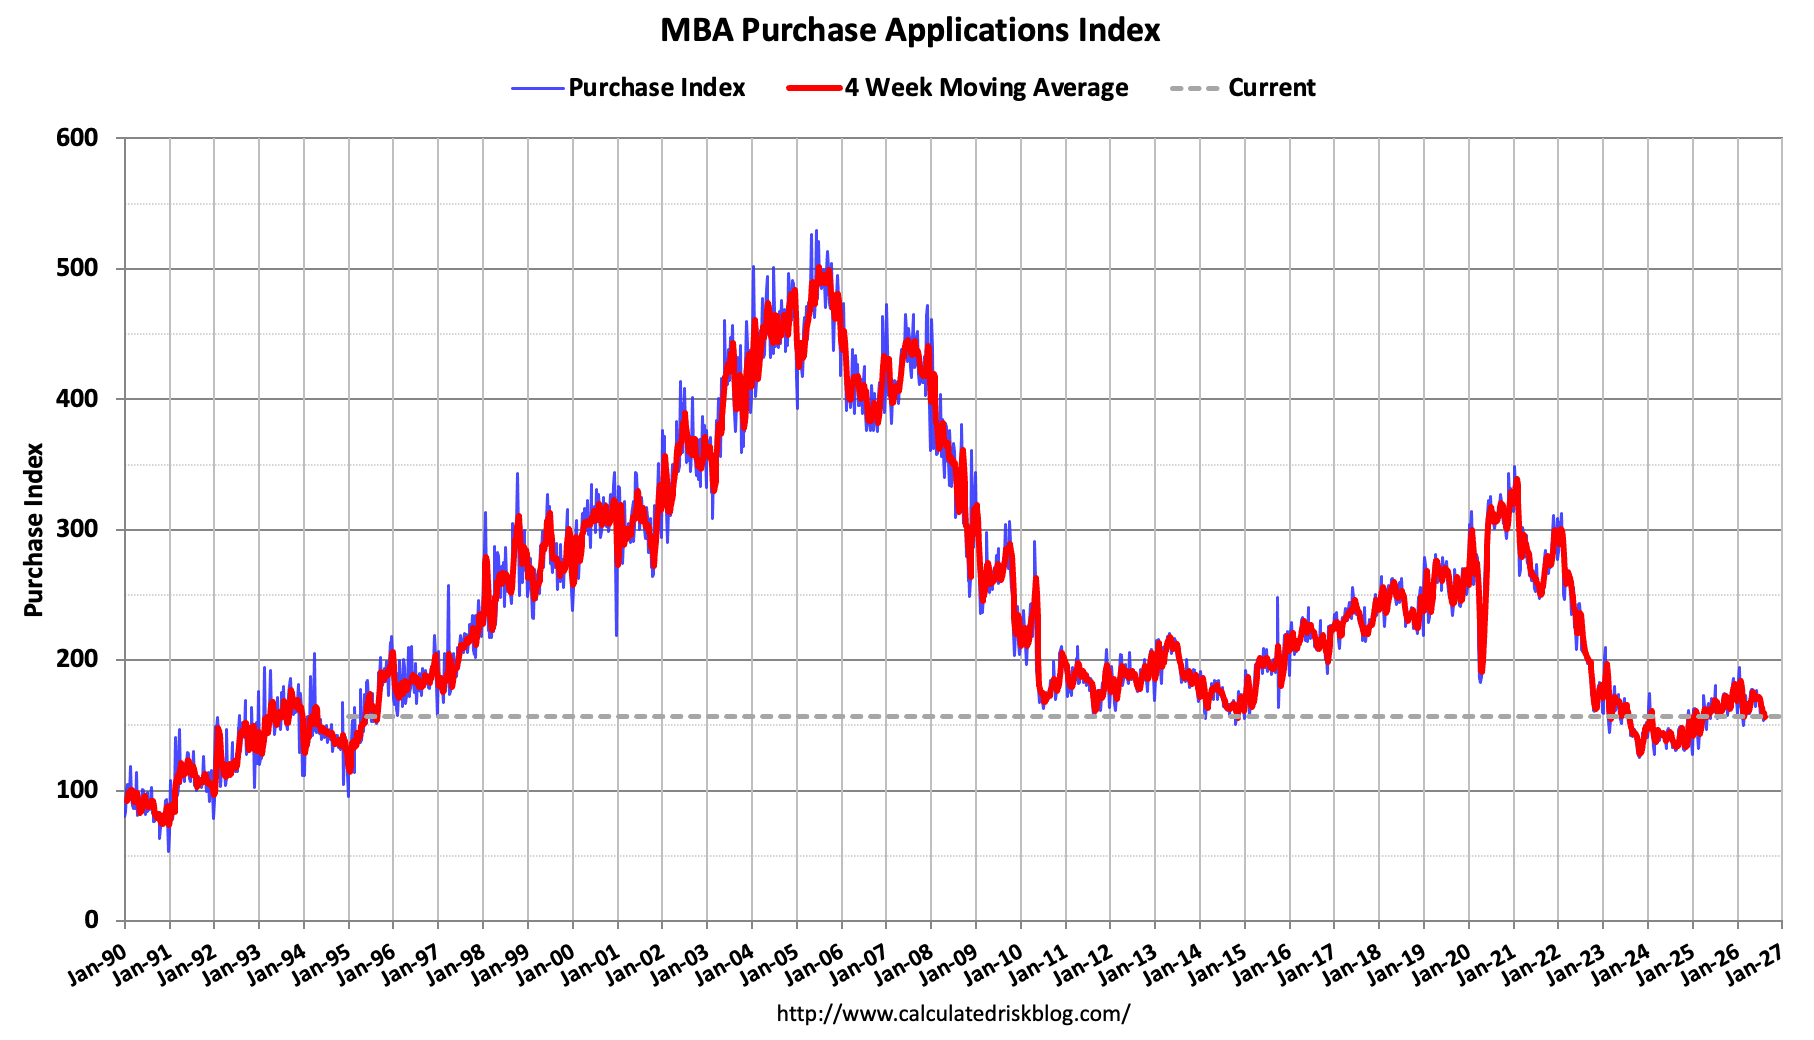
• The mortgage purchase applications index from the Mortgage Bankers Association (MBA).
The seasonally adjusted Purchase Index decreased 2 percent from one week earlier. The unadjusted Purchase Index decreased 3 percent compared with the previous week and was 3 percent lower than the same week one year ago.
This was down year-over-year and this index remains historically weak.
• FOMC Minutes, Meeting of July 28-29
Many participants assessed that policy tightening would likely be necessary if inflation did not decline. Some participants commented that financial conditions might not currently be sufficiently restrictive to facilitate a return of inflation to 2 percent.
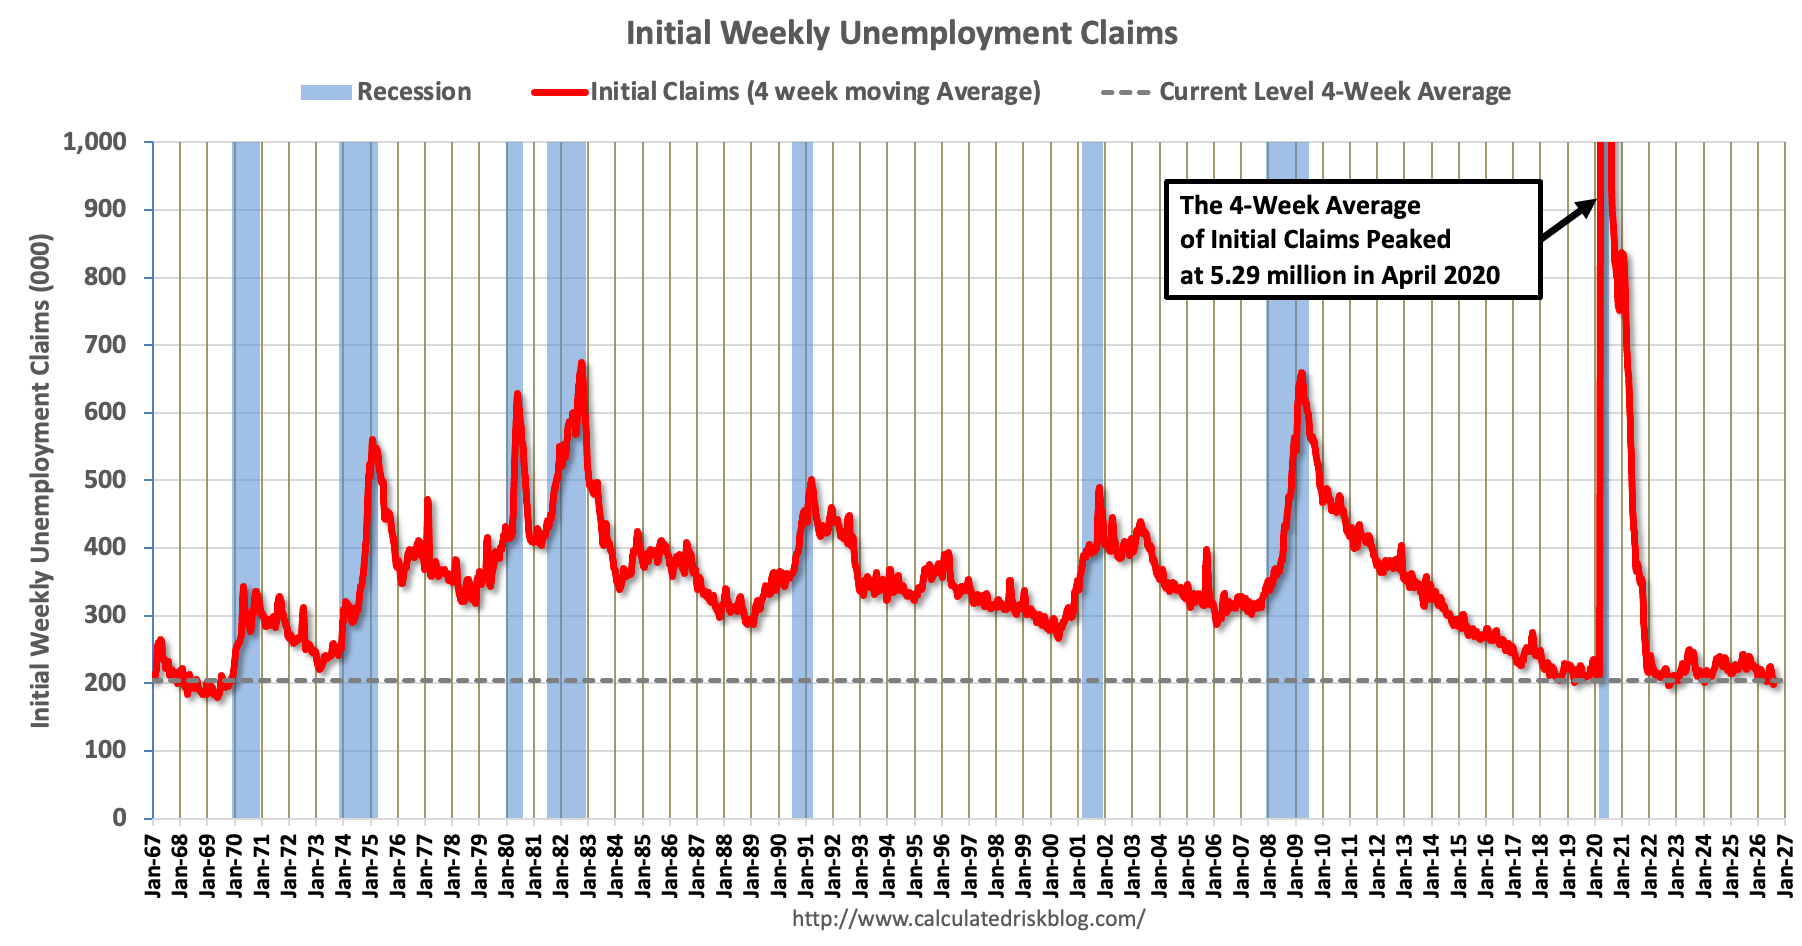
• The initial weekly unemployment claims report.
n the week ending August 15, the advance figure for seasonally adjusted initial claims was 206,000, a decrease of 6,000 from the previous week’s revised level. The previous week’s level was revised up by 3,000 from 209,000 to 212,000.
This was lower than expected.
• Philly Fed manufacturing survey for August.
The diffusion index for current general activity rose from 41.4 in July to 47.4 in August, its highest reading since April 2021
This was much higher than expected.
This week the U.S. Federal government debt passed $40 Trillion. That is a big number, but what matters is the debt to GDP ratio. Here is a graph from FRED through Jan 1, 2026.
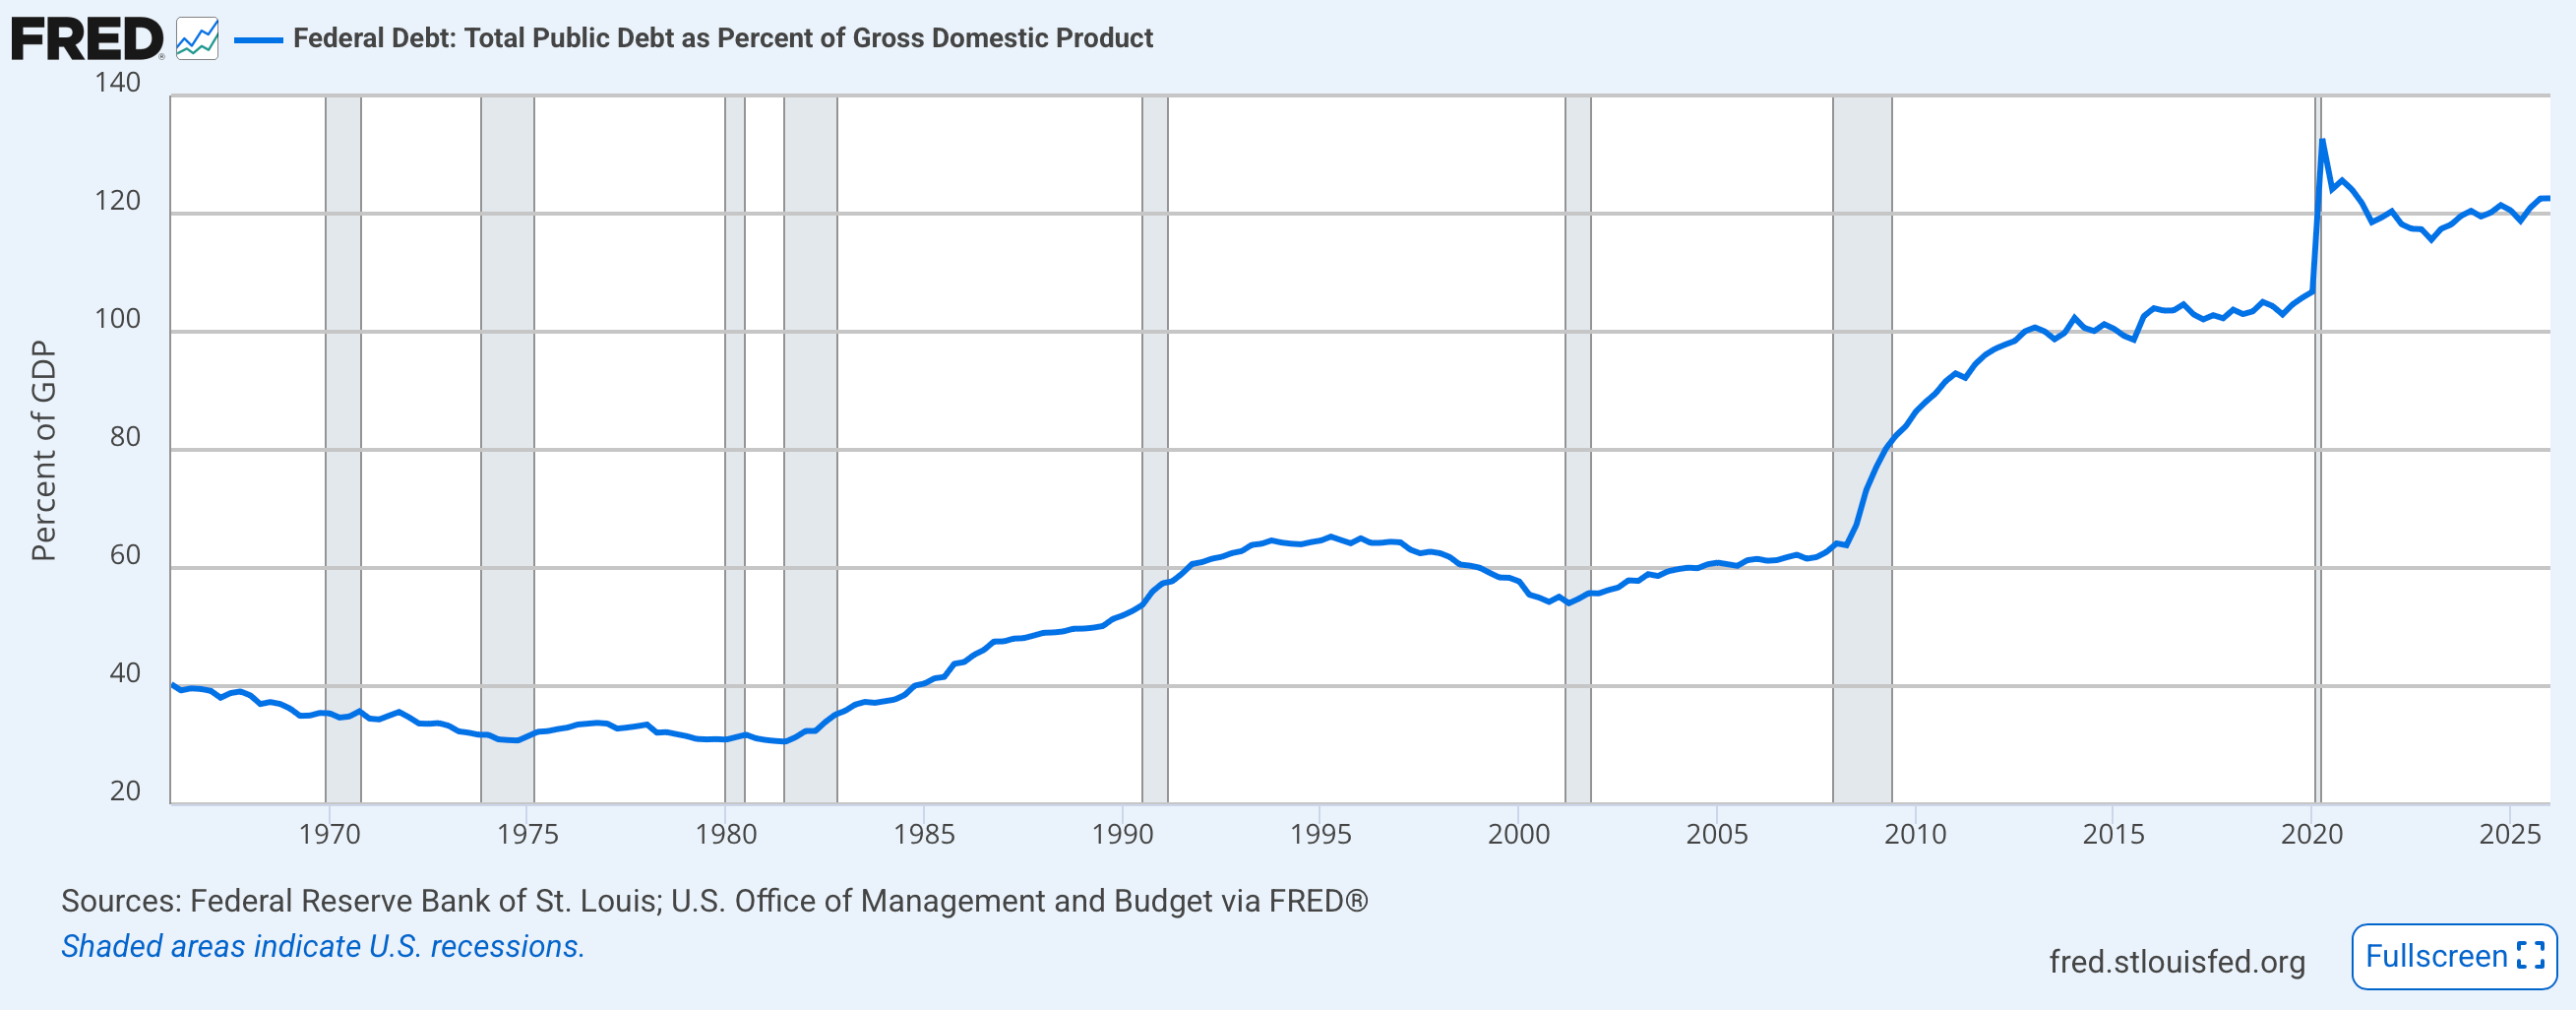
And the debt has gotten worse this year! And the debt-to-GDP ratio will increase further. This has led to an increase in the yield of long term bonds (lower prices). The 10-year yield has risen to 4.74% as of this writing, and mortgage rates are increasing (bad news for housing).
Here is a graph of the 10-year yield over the last 6 months.
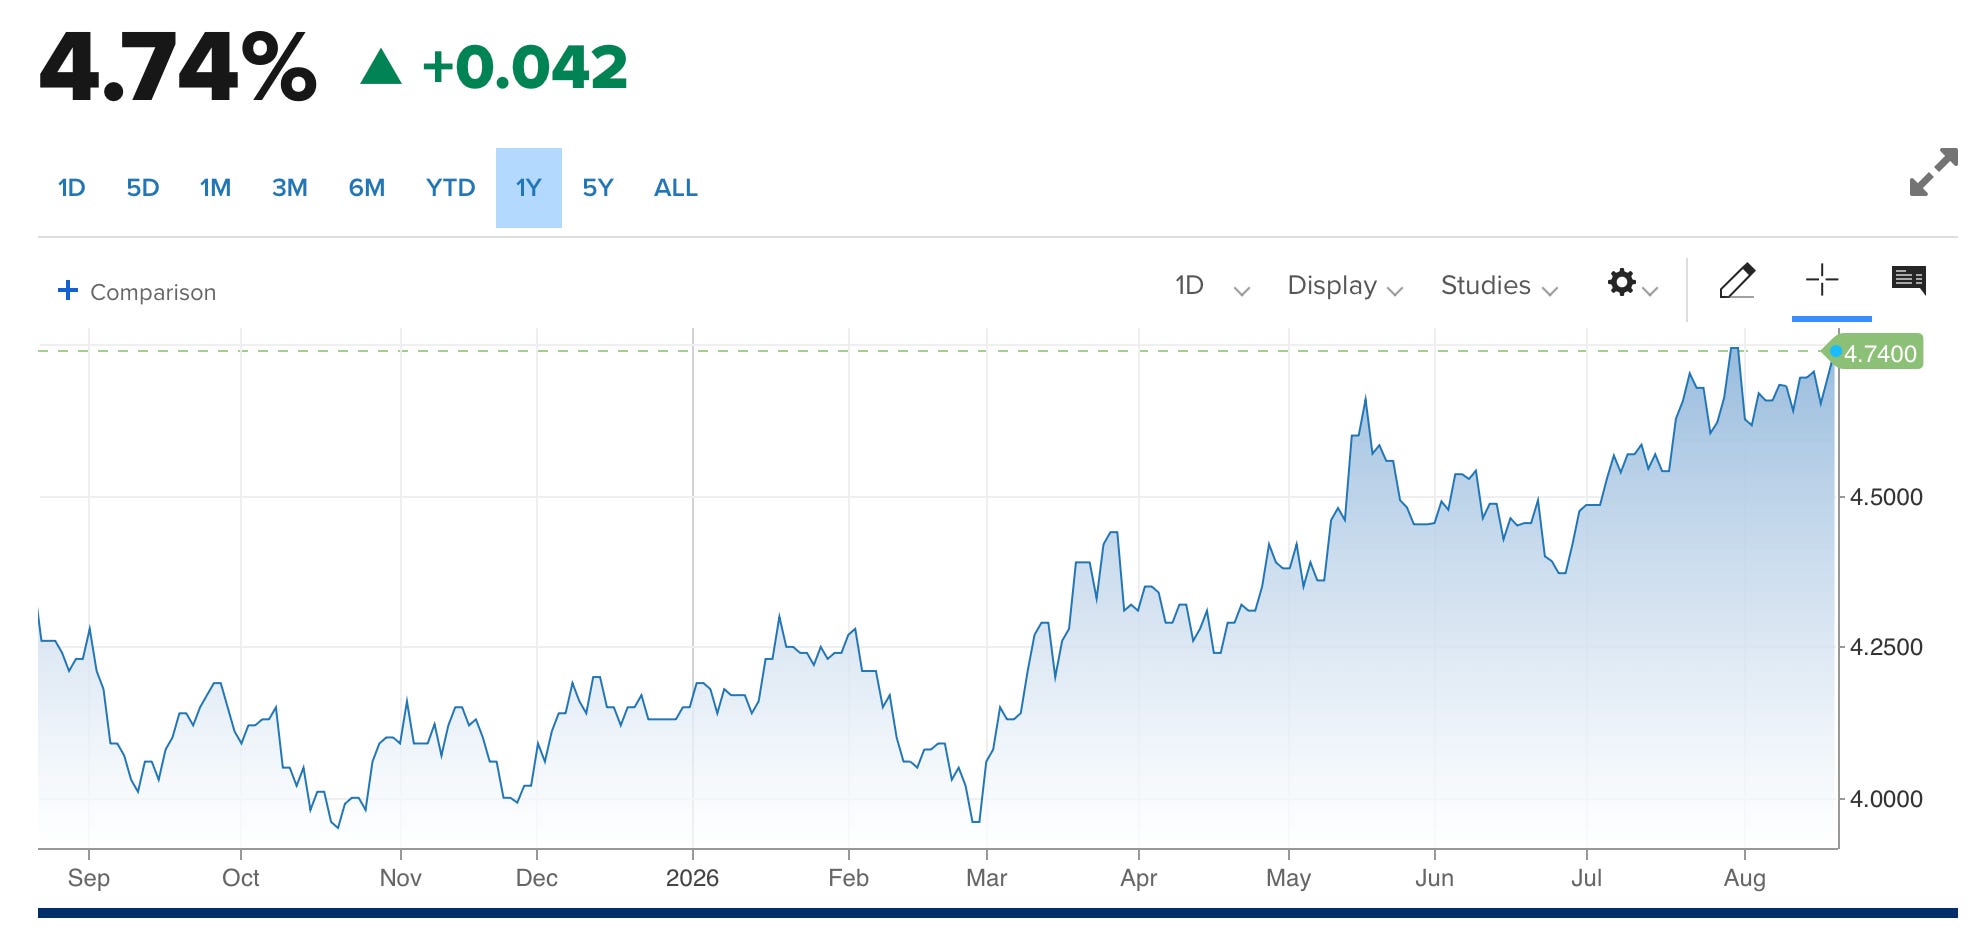
We have a fairly weak economy, with inflation too high, and now interest rising due to policy choices (tax cuts and a war). Oh well.
Thanks for reading Economic Weekly! This post is public so feel free to share it.
No posts
Comments
Nothing yet. Say the first thing.
Sign in to join the conversation.