
Welcome to Ecoinometrics’ Friday edition.
Each week, we analyze the three most critical market signals impacting Bitcoin and macro assets, delivering institutional-grade insights through data-driven charts and analysis.
Today we’ll cover:
Bitcoin Clears A Key Recovery Hurdle
Strong ETF Demand Is Backing Bitcoin’s Breakout
Rising Debt Doesn’t Mean Easy Money
Markets are finally giving Bitcoin investors reasons to become more optimistic but it’s important to understand what’s actually driving that improvement and what needs to be true to see a real follow through.
In case you missed it, here are the other topics we covered this week:
Get these professional-grade insights delivered to your inbox:
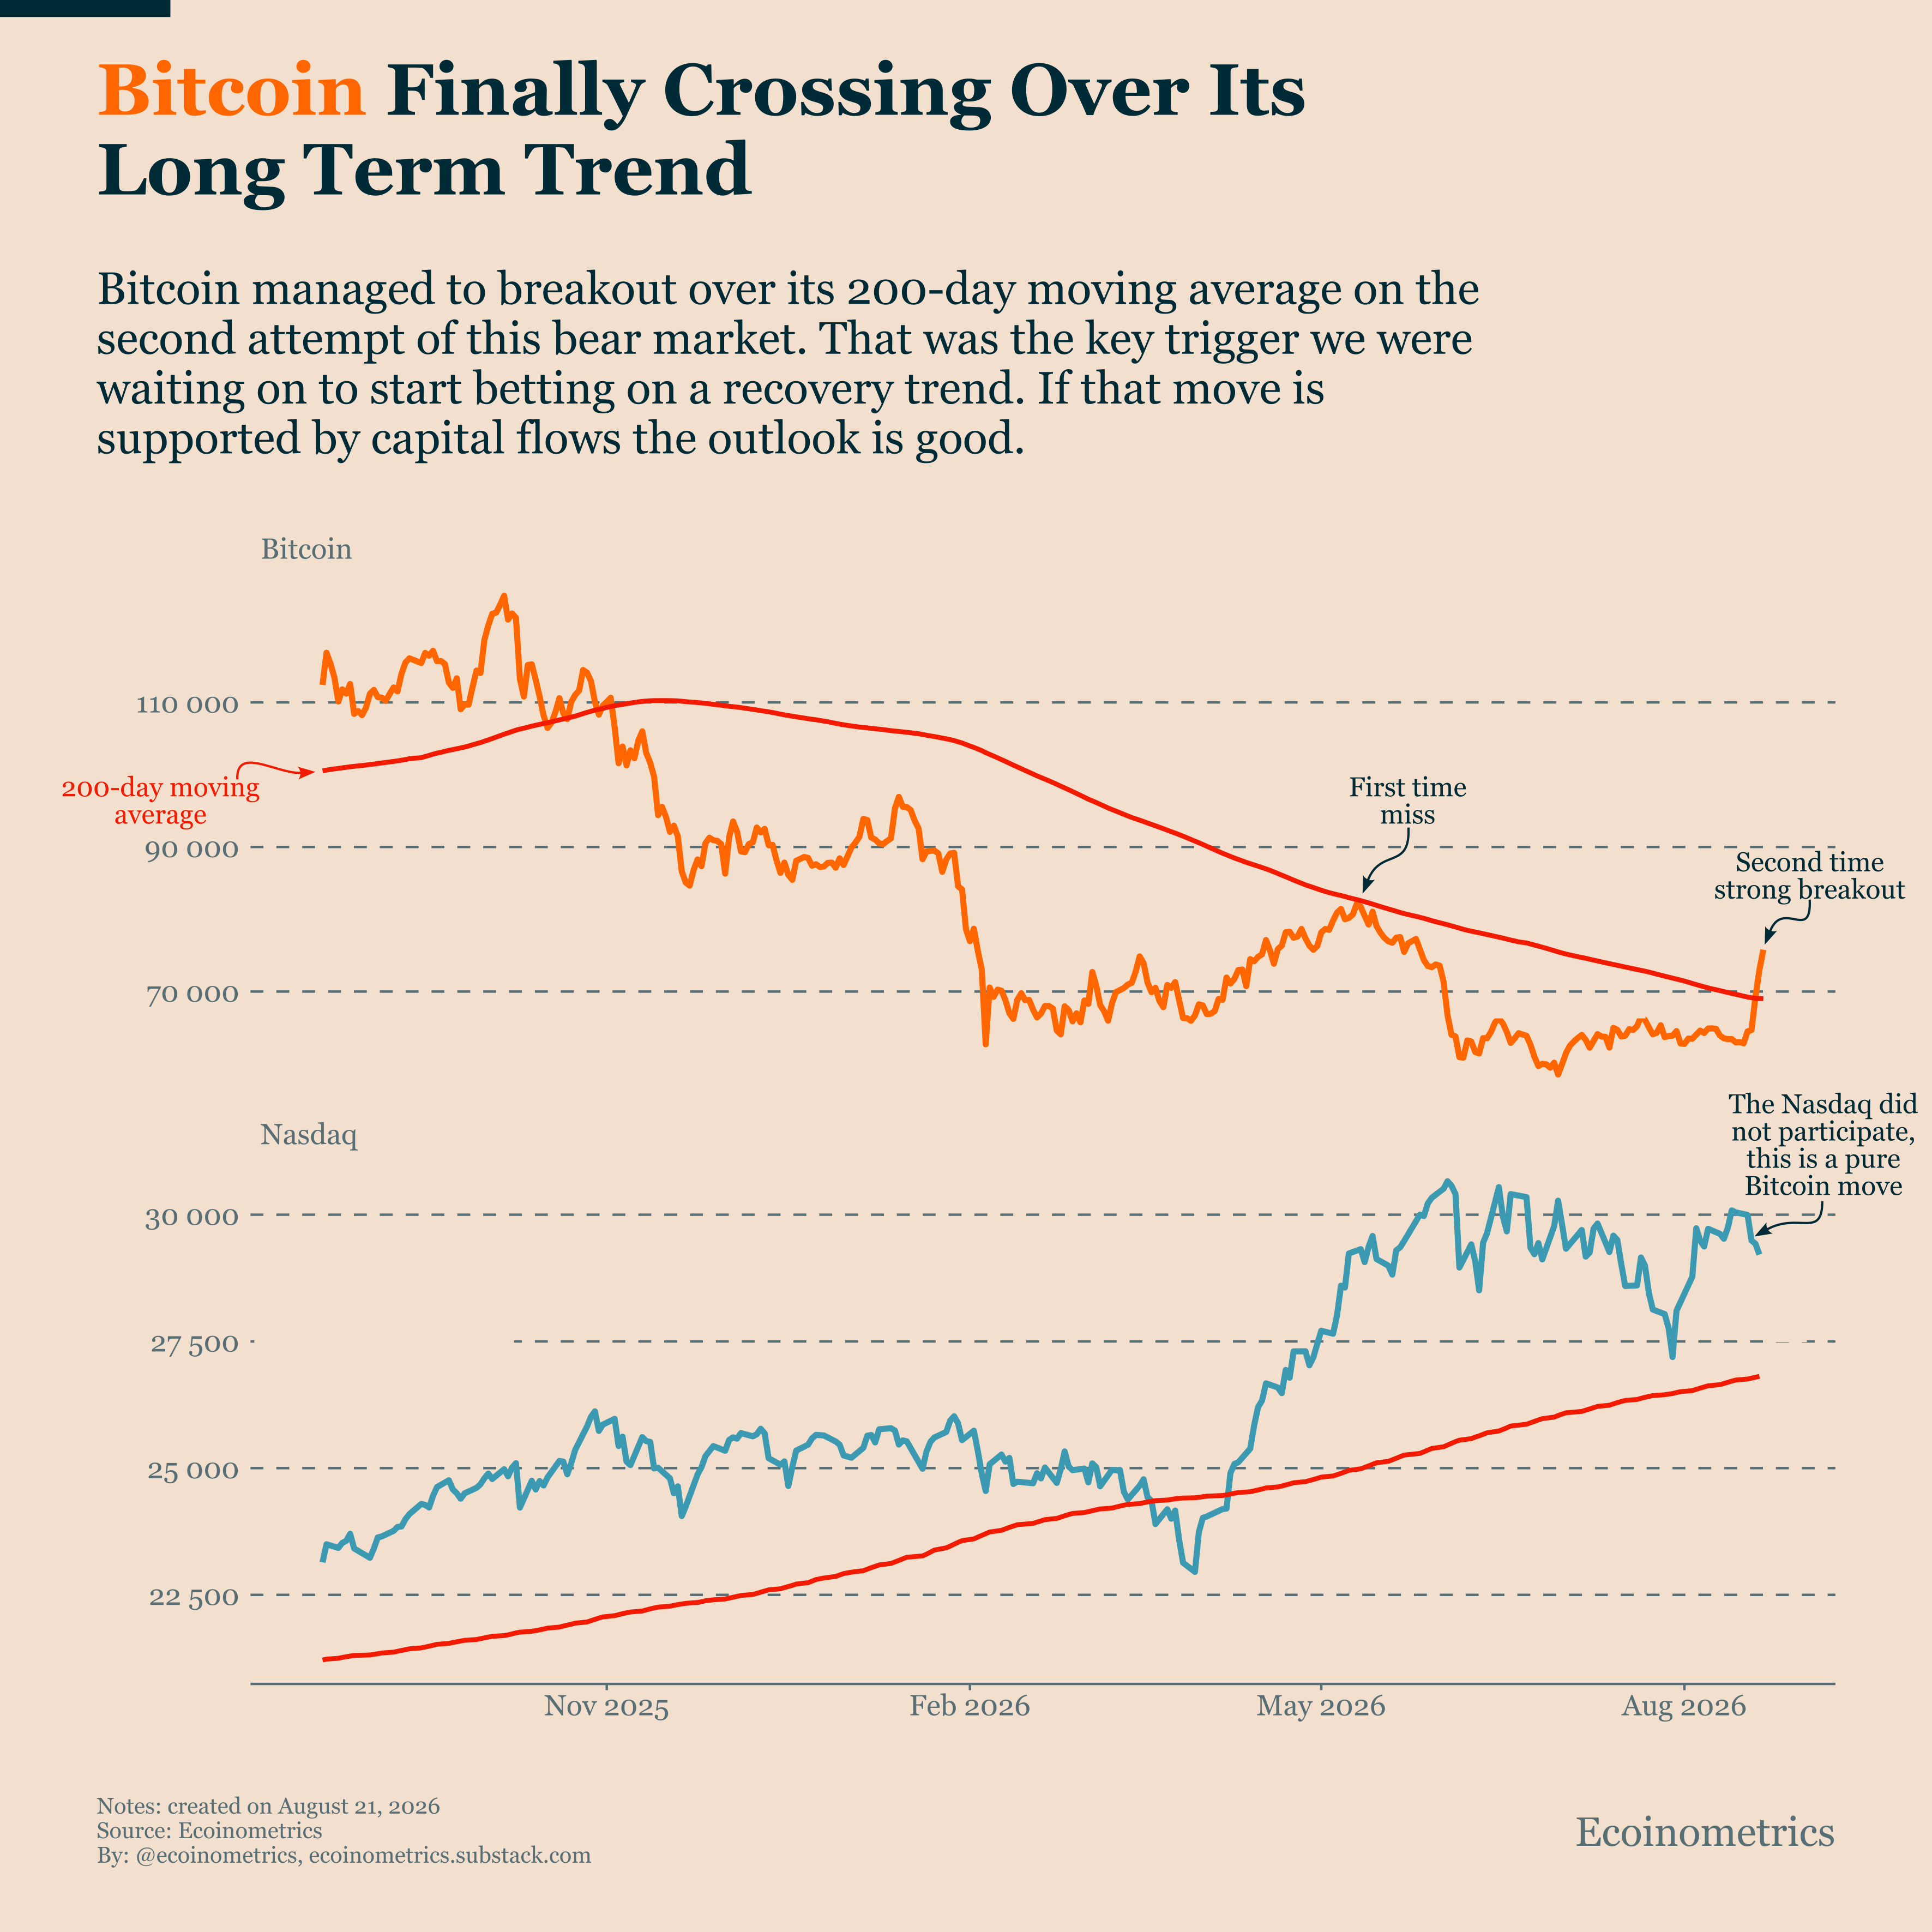
Bitcoin’s price surged above $70k this week, breaking decisively above its 200-day moving average.
That’s a very different outcome from the failed breakout attempt back in May. This time the move had enough momentum to push Bitcoin clearly back above its long-term trend.
This is one of the key technical signals we’ve been waiting for over the last few weeks before becoming more constructive on the market. Historically, roughly seven out of ten breakouts above the 200-day moving average have been followed by higher Bitcoin prices three months later.
Part of the speed of this week’s rally is likely amplified by leveraged short liquidations. But technical breakouts tend to matter most when they’re supported by genuine buying demand. As we’ll see in the next section, the underlying capital flows are moving in the right direction as well.
As long as Bitcoin can hold above this level over the coming days, the probability of a sustained recovery has increased meaningfully.
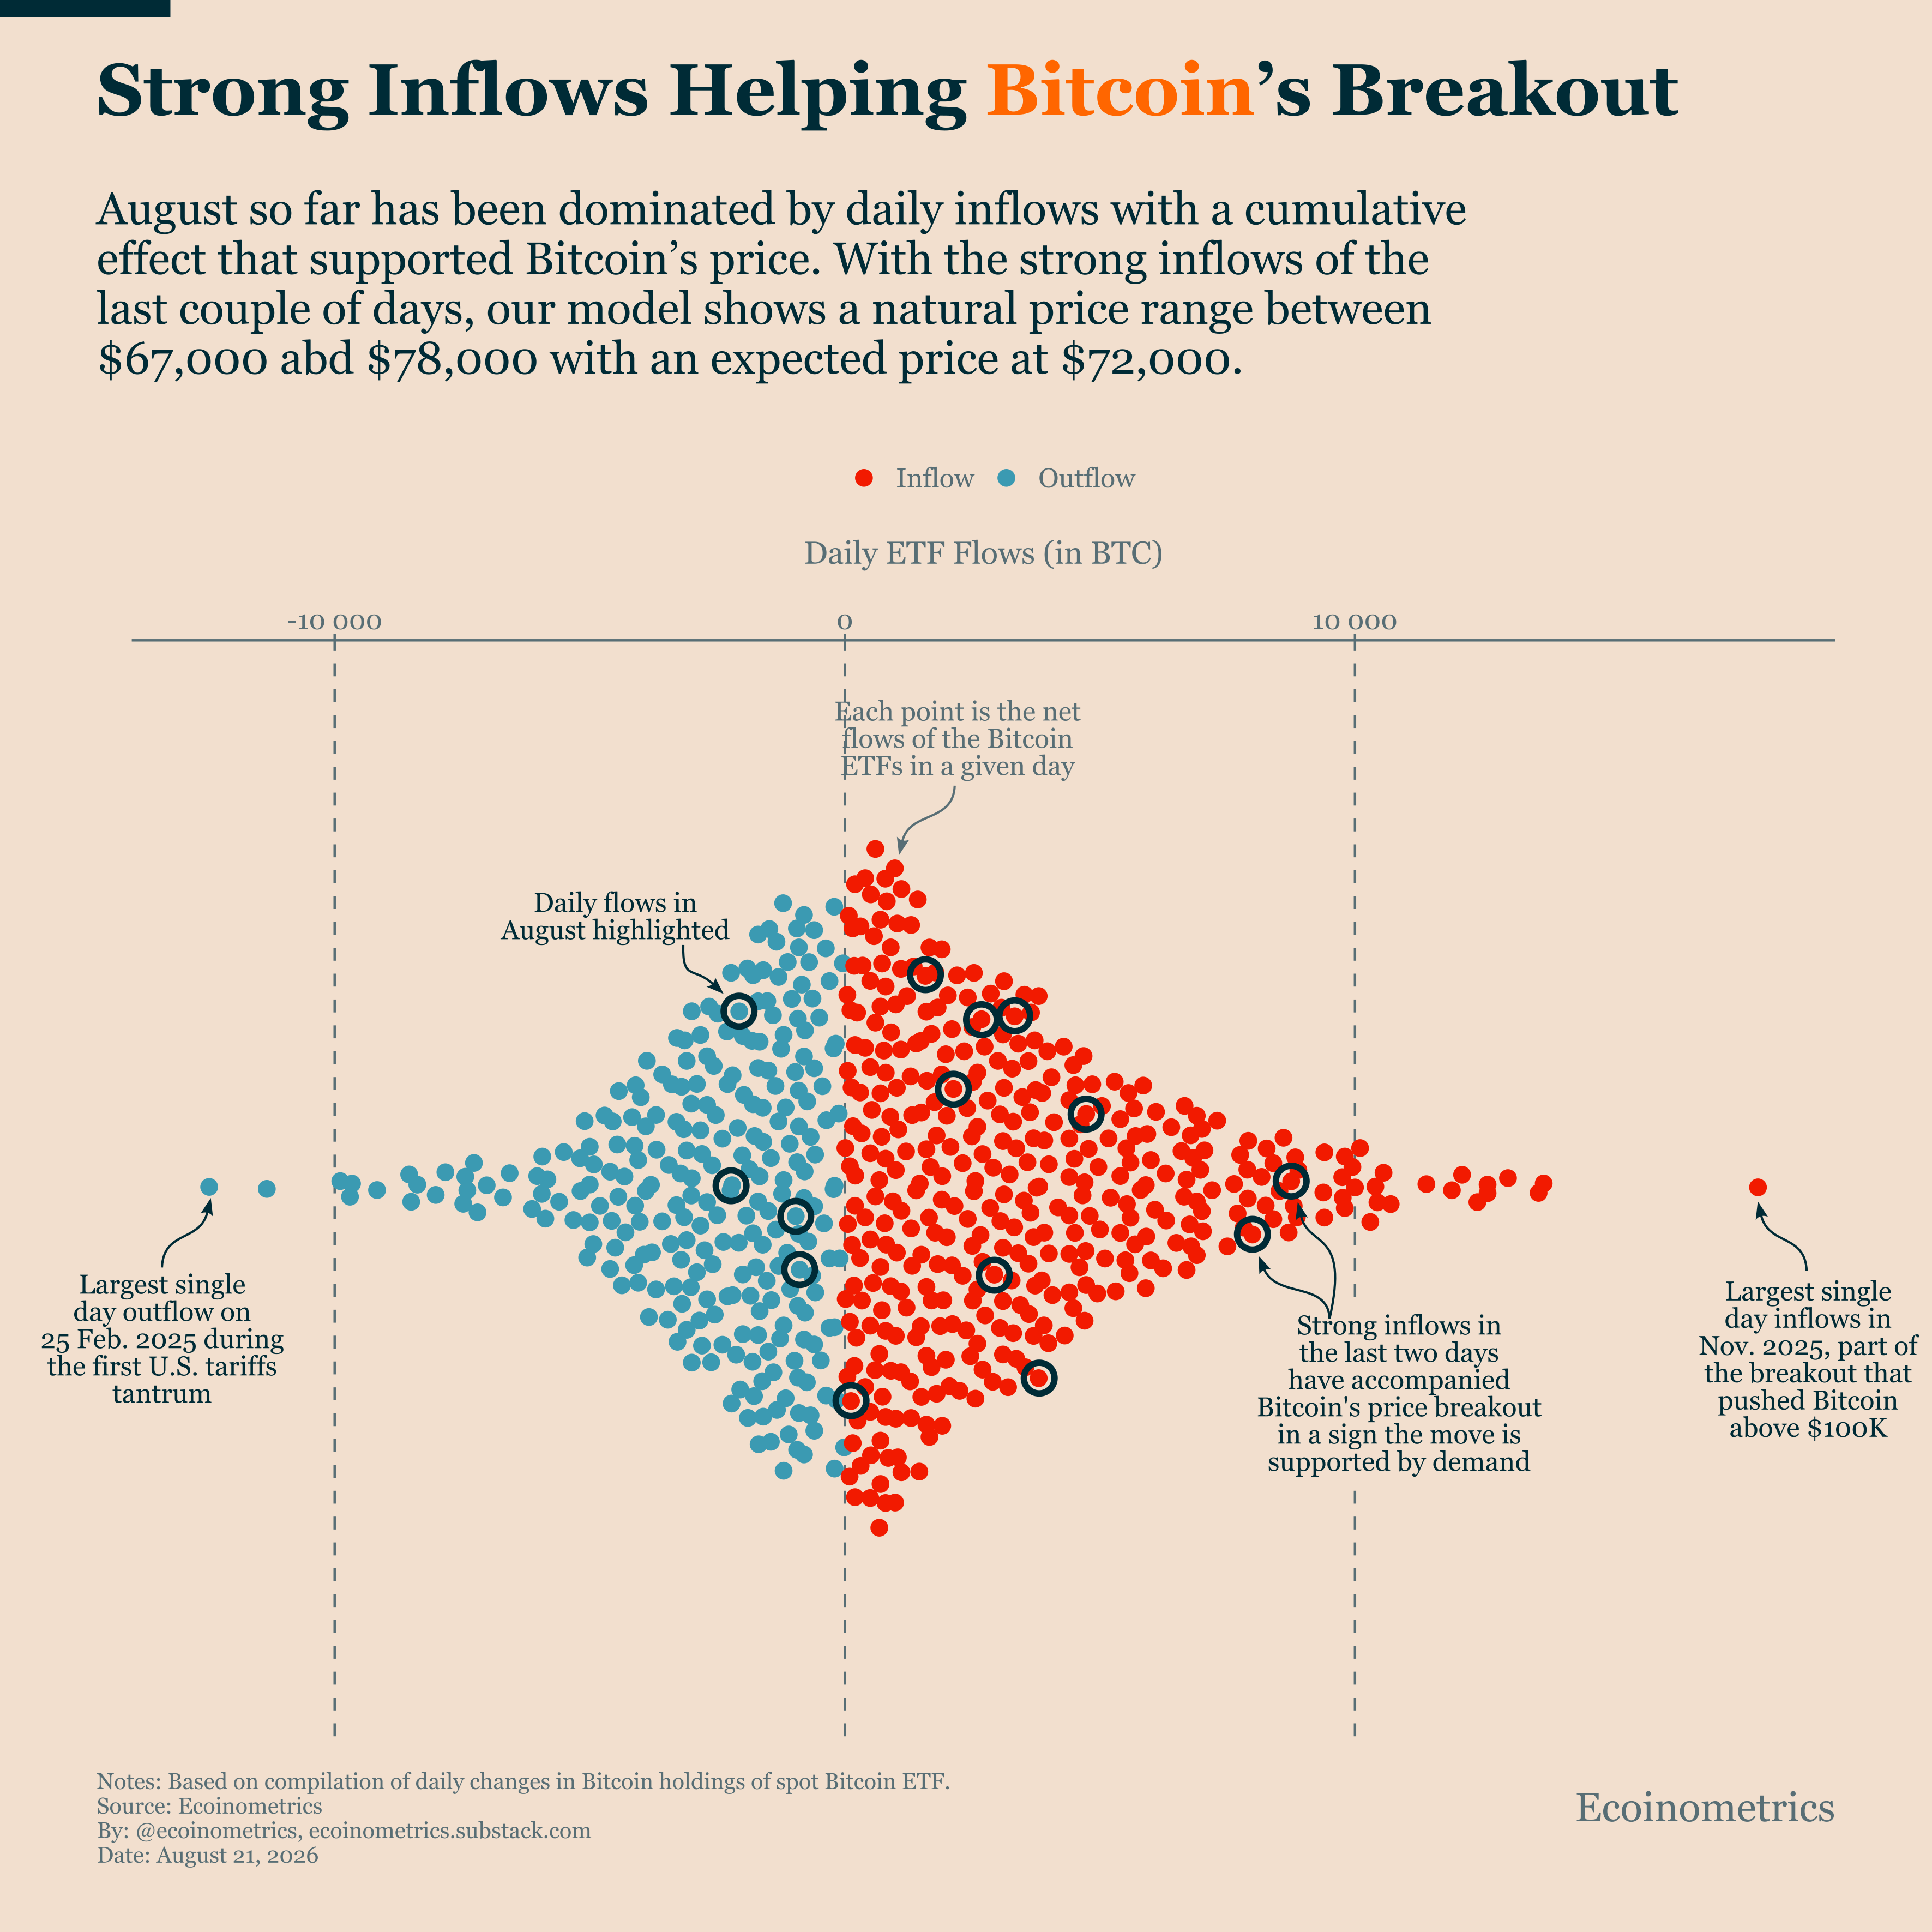
ETF demand has been improving throughout August although until this week the pace of buying had remained fairly modest.
The last two trading sessions changed that. Strong inflows arrived at the same time Bitcoin broke above its 200-day moving average, giving the breakout support from genuine investor demand rather than technical positioning alone.
Based on our ETF flow model, Bitcoin is now supported in a range between $67k and $78k, with a fair value around $72k.
If this breakout attracts trend-following investors, stronger prices can encourage additional buying, which in turn reinforces the trend and is pushing up the expected price range from the flow model. That’s how sustained recoveries begin.
The key now is follow-through. As long as Bitcoin holds above its 200-day moving average and ETF demand remains positive, the probability of a sustained recovery continues to improve.
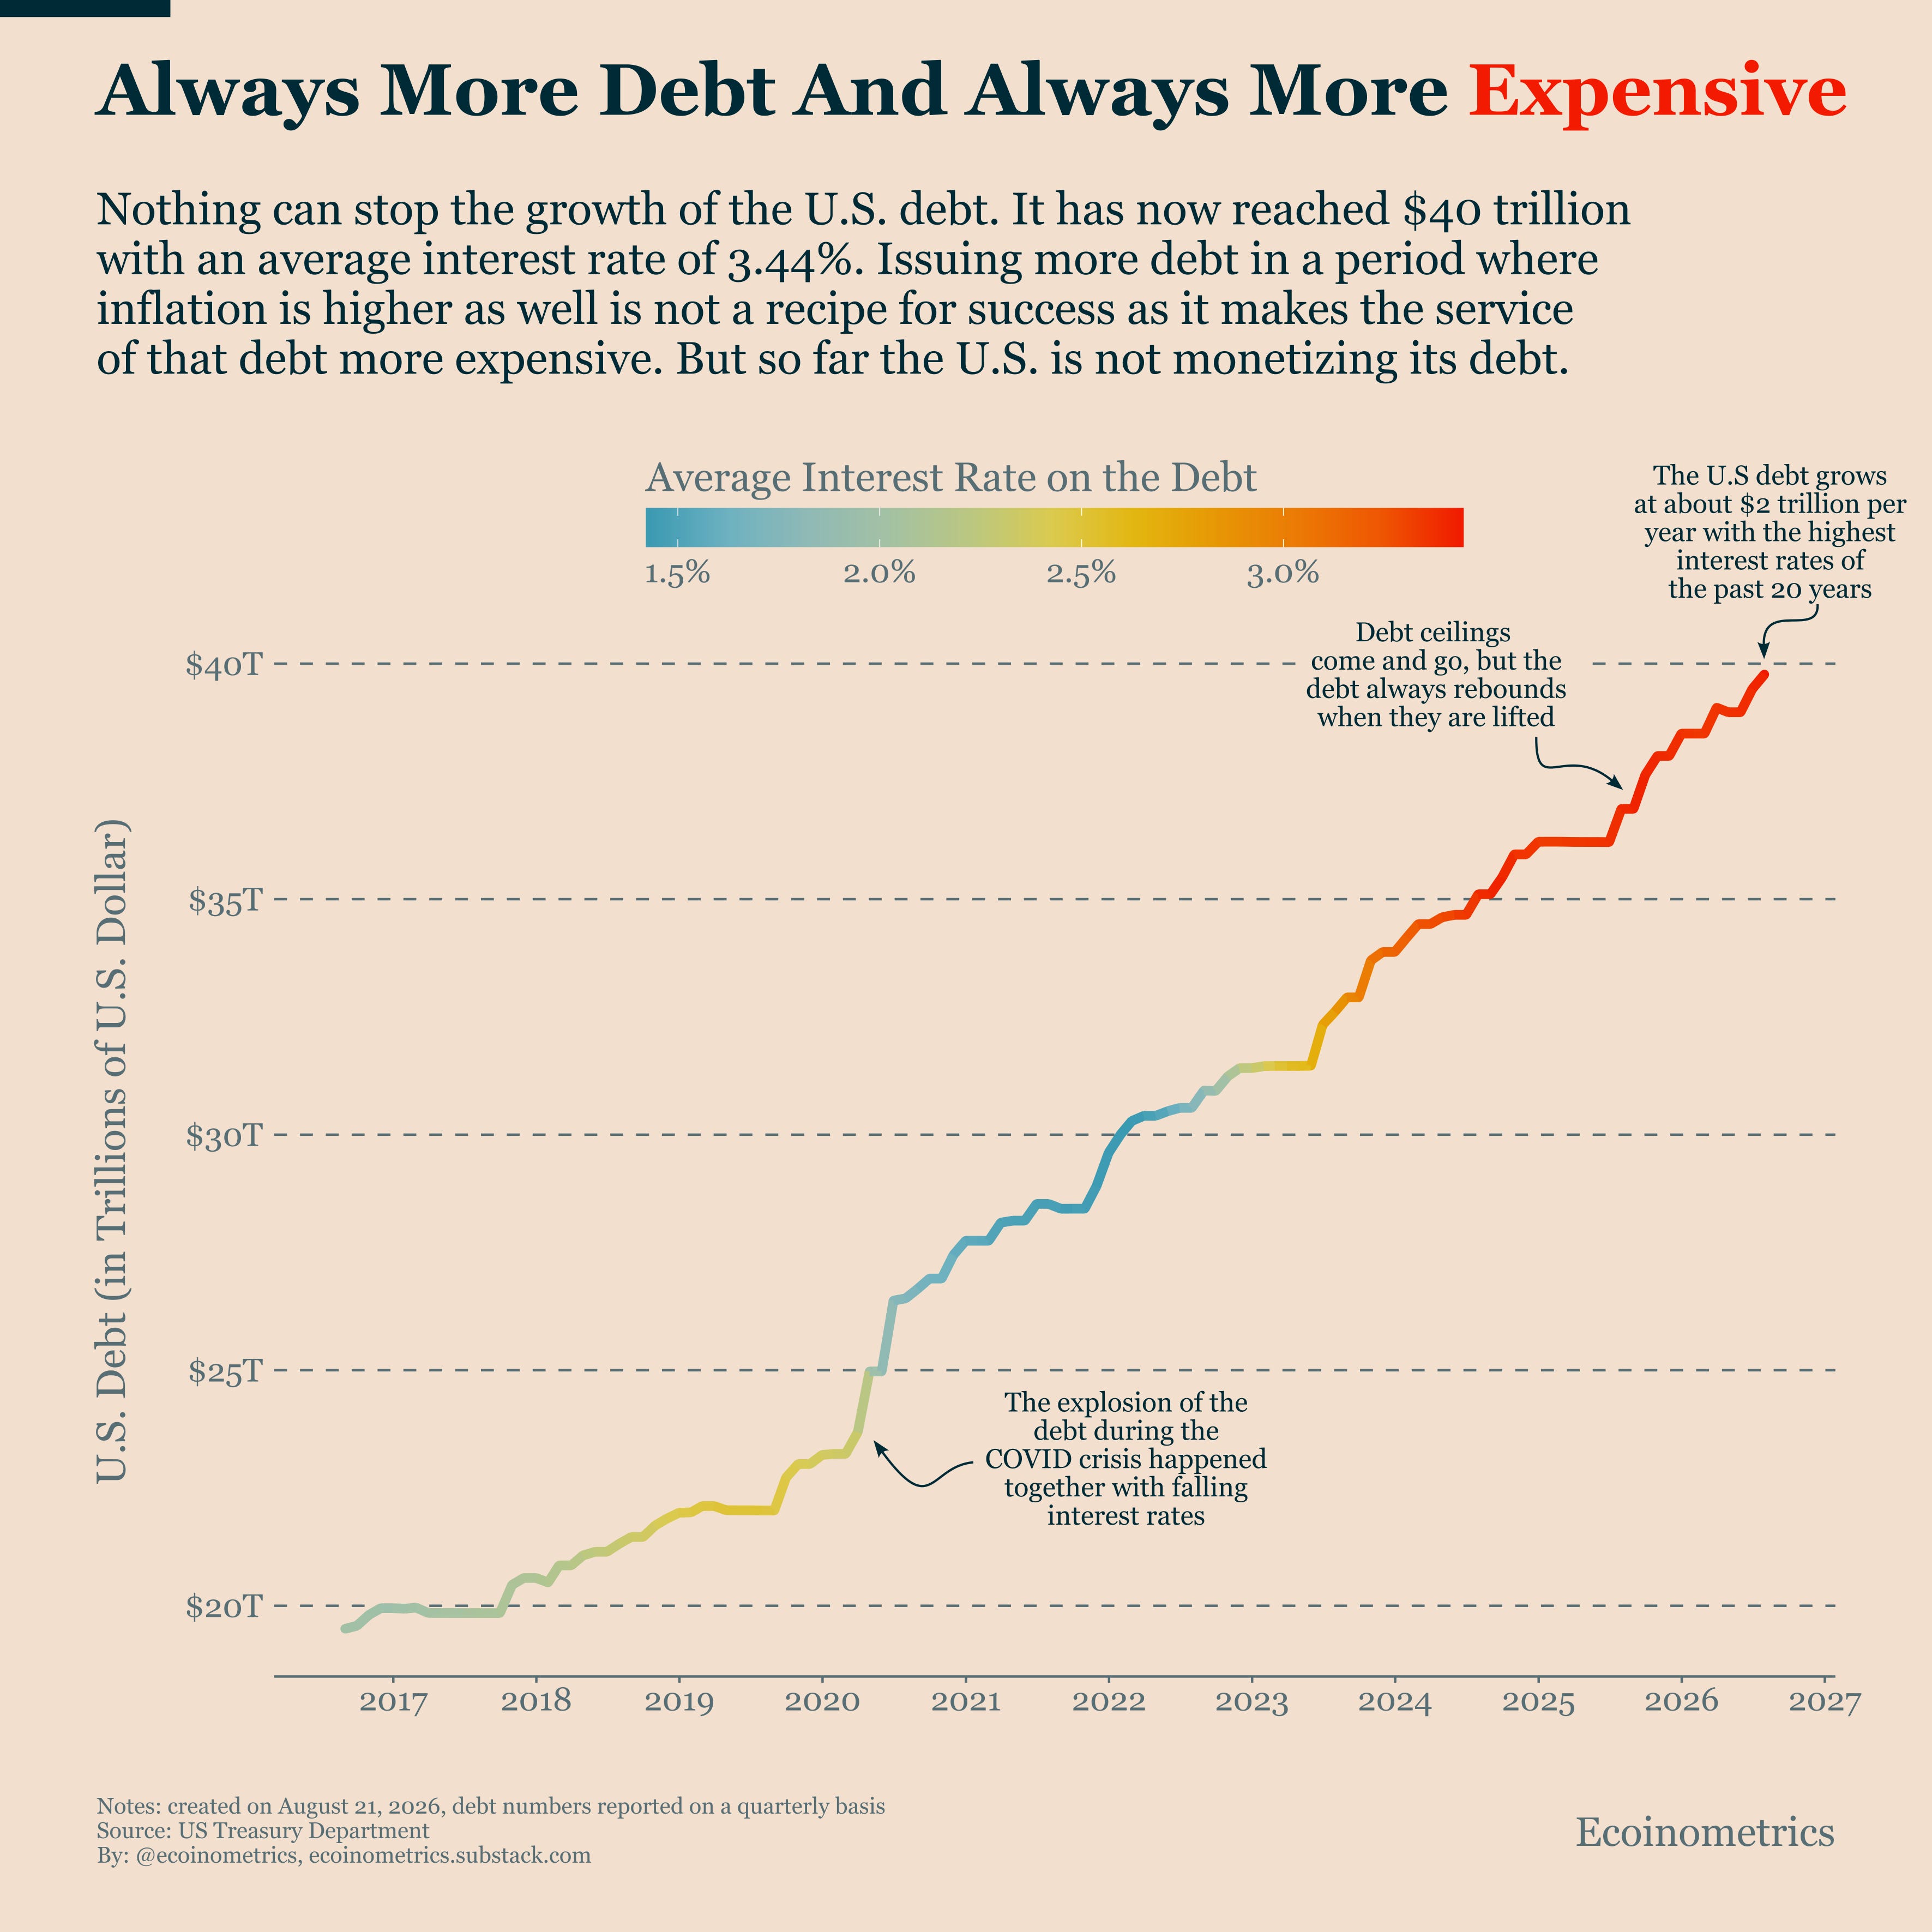
The U.S. national debt has now crossed $40 trillion, making headlines around the world. The milestone itself isn’t surprising. Governments have been running persistent deficits for decades so another debt record was only a matter of time. In the U.S. excluding the brief periods where a debt ceiling is in place, the debt is growing at the rate of $2 trillion per year.
Of course right now that’s an even bigger problem because of the interest rates environment. The U.S. Treasury is issuing more bonds while inflation is above target so naturally investors demand higher yield to absorb all this new debt.
That’s what you can see on the chart below.
Now recent U.S. Treasury buyback announcements generated a lot of discussion, but they’re far too small to meaningfully change the overall picture. The government is replacing existing debt by issuing new debt that’s costing more to service… that doesn’t sound like a good move long term. But for investors today, the important thing is that this is not a new round of monetary stimulus.
The Federal Reserve isn’t monetizing the debt. And that means whatever is going on in the bond market right now it is not creating the conditions of a long term tailwind.
If Bitcoin’s recovery story is driven by that it is worth questioning how long the narrative will last.
That’s it for today. Thanks for reading.
Cheers,
Nick
P.S. Every week, our team conducts extensive research analyzing market data, tracking emerging trends, and creating professional-grade charts and analysis.
Our mission: Deliver actionable macro and Bitcoin insights that help institutional investors and financial advisors make better-informed decisions.
Ready for institutional-grade research that puts you ahead of the market? Click below to access our premium insights.
Comments
Nothing yet. Say the first thing.
Sign in to join the conversation.