
--
https://doi.org/10.5194/soil-12-113-2026 <-- shared paper
--
https://doi.org/10.1038/s41558-026-02603-2 <-- shared paper
--
https://www.theguardian.com/environment/2026/aug/20/tipping-points-heatwaves-wildfires-permafrost-climate-crisis <-- shared media article
--
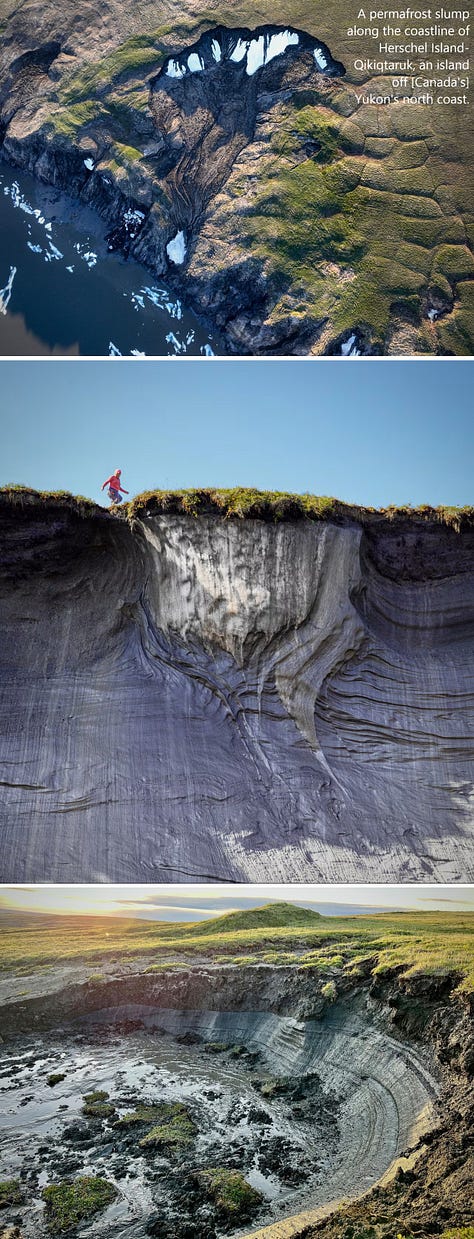
https://www.cbc.ca/news/canada/north/permafrost-slumps-herschel-island-qikiqtaruk-yukon-9.7168780 <-- shared media article
--
[putting together two different ‘sorts’/focuses of research/reporting, but…]
H/T @Gustaf Hugelius | Professor at Stockholm University
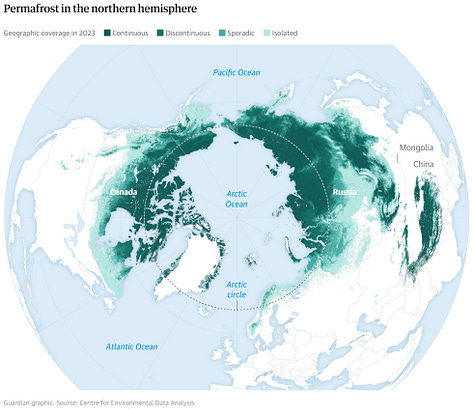
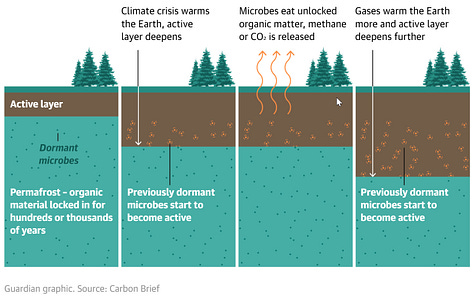
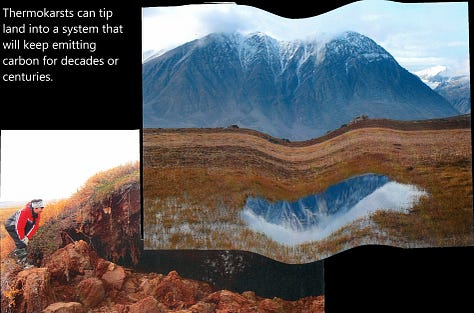
• “Heatwaves and wildfires are not just scorching forests, they are adding to the tipping point risks in the world’s vast permafrost regions, which contain three times more carbon than all the living vegetation on Earth…
• Permafrost stores 1,500 gigatons of carbon, which is three times more than all the living vegetation on Earth, including every single tree in the Amazon. It’s a really huge amount so even small changes to this system can cause big changes in the atmosphere…
• Methane is about 30 times more potent as a greenhouse gas, though only in the short term because it breaks down more quickly over 10 to 15 years. That makes it a strong and immediate concern and for future generations. Carbon dioxide, by comparison, is less potent but it lingers much longer, which makes it a bigger threat on the timescale of centuries…”
--
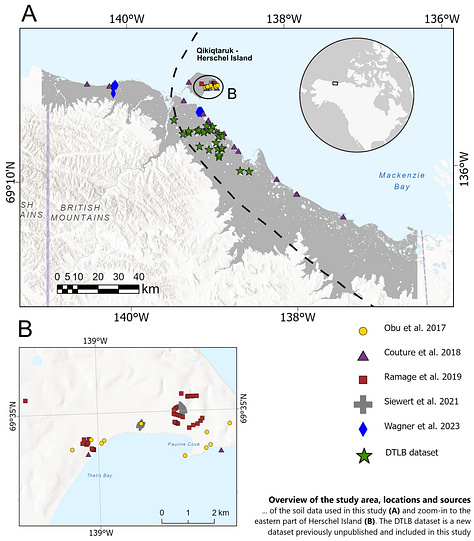
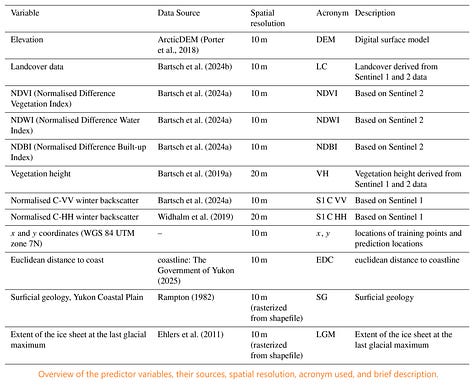
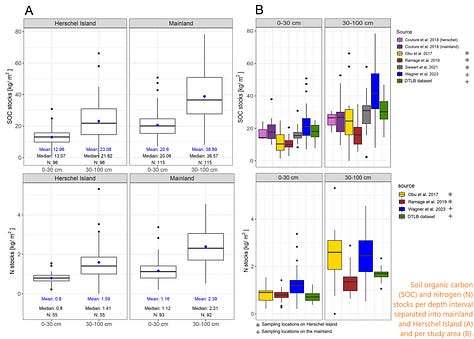
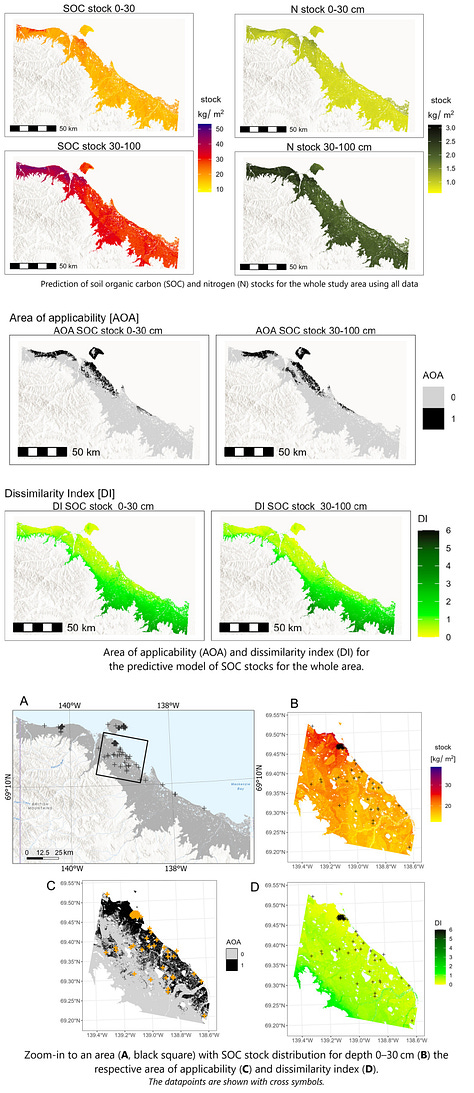
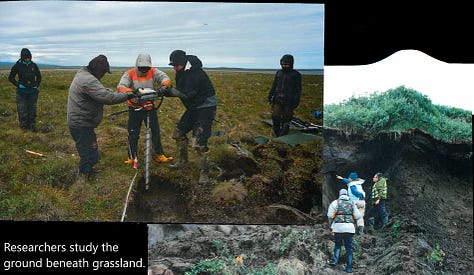
“Permafrost soils are particularly vulnerable to climate change. To assess and improve estimations of carbon (C) and nitrogen (N) budgets it is necessary to accurately map soil carbon and nitrogen in the permafrost region. In particular, soil organic carbon (SOC) stocks have been predicted and mapped by many studies from local to pan-Arctic scales. Several studies have been carried out at the Canadian Beaufort Sea coast, though no regional maps of terrestrial carbon stocks based on spatial modelling has been conducted yet. This study combines available field data from the Canadian Yukon coastal plain and uses it to map regional SOC and N stocks using the machine learning algorithm random forest and environmental variables based on remote sensing data. [The authors] developed models using the data for the entire region and separate models for the coastal mainland area and Qikiqtaruk Herschel Island. Each model was used to map SOC and N stocks for its respective area. [They] assessed the performance of the different random forest models by using crossvalidation. [They] further assessed model results using the Area of Applicability (AOA) method and the quantile regression forest approach, comparing the results and discussing their implications within the context of both methods. [They] explore[d] local differences in soil properties and how soil data distribution across the region affects the accuracy of the predictions of SOC and N stocks. The estimated SOC stock for the upper metre is 48.7 ± 6.6 kg/m² and the N stock 3.03 ± 0.30 kg/m². The average SOC stocks vary significantly when creating separate models for subsets of the data. Qikiqtaruk Herschel Island is geologically different from the coastal mainland and has on average lower SOC stocks. Including Qikiqtaruk Herschel Island soil data to predict SOC stocks at the mainland has large impact on the results. Differences in N stocks were not as dependent on the location as SOC stocks and rather differences between individual studies occurred. The results of the separate models show 38.0 ± 5.6 kg C/m² and 2.87 ± 0.34 kg N/m² for Qikiqtaruk Herschel Island and 52.5 ± 6.3 kg C/m² and 3.15 ± 0.32 kg N/m² for the mainland. These estimates refer to the entire study area, without masking out regions outside the Area of Applicability (AOA). [Their] results indicate that the spatial perspective, whether regional or local (whole area vs. mainland and Qikiqtaruk Herschel Island separately), can affect the patterns and values represented in the resulting maps, highlighting the importance of scale when interpreting SOC and N stock distributions. Using a more densely sampled, region-specific dataset, [their] study captures finer regional-scale patterns than previous lower-resolution or pan-Arctic analyses…”
#permafrost #soils #geology #climatechange #temperature #thawing #melting #emissions #CO2 #methane #carbon #nitrogen #GIS #spatial #mapping #Qikiqtaruk #HerschelIsland #Yukon #Canada #soilorganiccarbon #SOC #arctic #cryosphere #BeaufortSea #coast #coastal #machinelearning #model #modeling #remotesensing #earthobservation #carbonstocks #island #mainland #spatialanalysis #scale
No posts
Comments
Nothing yet. Say the first thing.
Sign in to join the conversation.