
Every Friday, I summarize and simplify three interesting papers. In this week’s update, we look at the following topics:
Measuring smoke exposure from prescribed fires
Tracking tree canopy across urban environments
Measuring ammonia using hyperspectral data
If this is your first time reading Earthbound, and you want more (free and open) research summaries, feel free to subscribe to this newsletter:
The health impacts of wildfires have been studied pretty consistently (especially over the last couple of years) but how much smoke exposure do we face from prescribed fires?
If you’re unfamiliar with prescribed fires, they are fires that are set on purpose for multiple purposes. A few examples include:
decreasing wildfire risk
increasing nutrition for livestock
control invasive grass species
maintain ecosystem diversity.
In this paper, the authors explore how much PM2.5 levels change as a result of prescribed fires in the region. Here is a summary of some data they used:
Ground-level measurements were collected from monitoring stations and Purple Air monitors
The extent of burning was captured using the MODIS burned area product
A product called NOAA Hazard Mapping System was used to identify smoke plumes and hotpots
The MODIS/Terra + Aqua Direct Broadcast Burned Area Monthly product was used to assess the timing of the prescribed burning
Unsurprisingly, they found that prescribed fires did increase PM2.5 levels in the study area.

There are few downsides to having healthy trees dispersed throughout cities. But how can we track what exists today, and how it changes over time?
In this study, the urban canopy across a region of Hong Kong is measured using a novel method that utilizes multiple EO datasets and GIS variables.
First, they tested four different segmentation algorithms on the WorldView-2 satellite images to segment the canopy across the study area. From this exercise, they created a canopy distribution map.
GIS data of different urban predictors are used to segment the tree canopy into different urban habitats
Four years of Sentinel-2 data were used to develop vegetation indices that are indicative of tree growth. These include:
fluorescence correction vegetation index (FCVI)
soil adjusted total vegetation index (SATVI)
the normalized difference phenology index (NDPI)
These were used to train a model that can associate canopy features with tree species
They also calculated the changes in these indices for different tree species
One of the takeaways in the paper is that the location of trees (i.e. which environment they’re in) can impact the amount of care it requires from the responsible body.

The study area is classified into urban habitats (Guo et. al, 2024)

Ammonia is difficult to measure with publicly available earth observation data, especially over industrial sites where the plumes cannot be effectively captured using multispectral instruments with a coarse spatial resolution. How effective is hyperspectral?
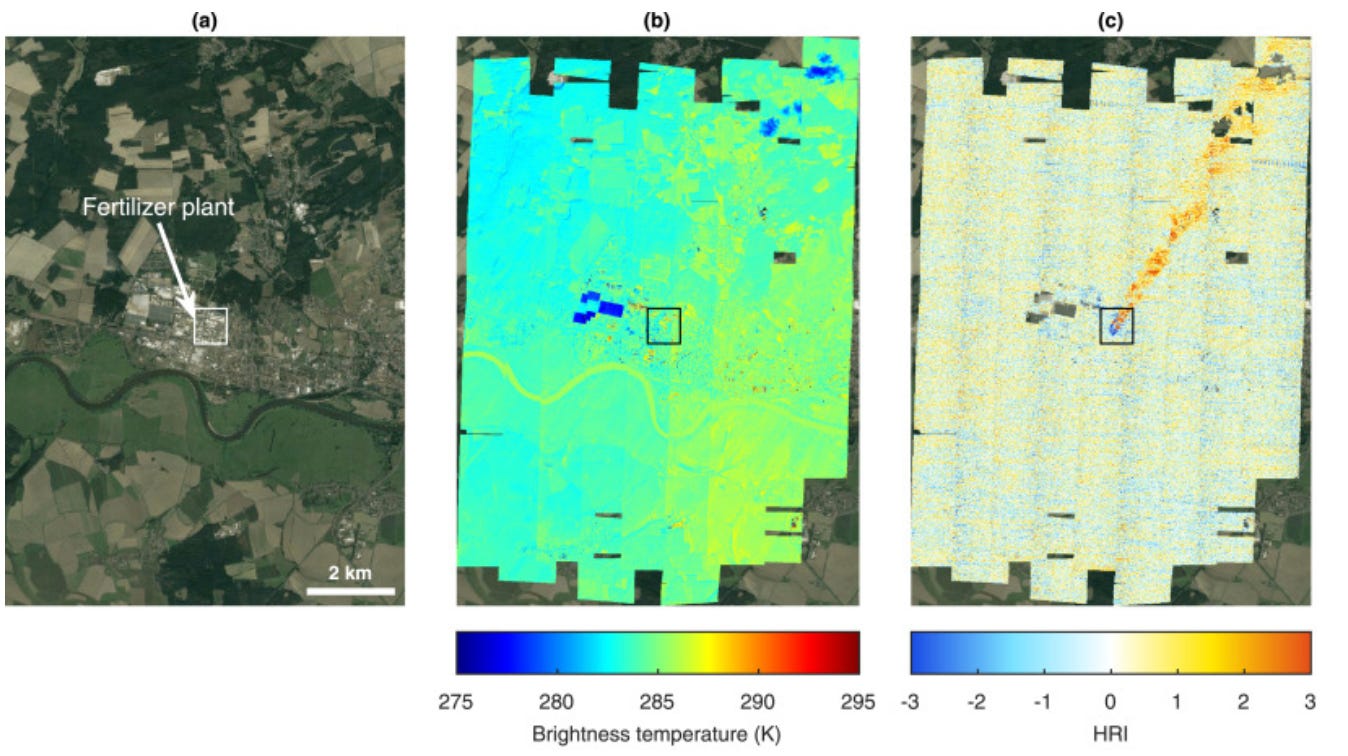
To test the effectiveness of hyperspectral, they flew two sensors over industrial sites in Germany
The first was called Telops Hyper-Cam LW and it used longwave infrared to target ammonia measurements at a 4 m resolution
The second was a spectrometer that measured nitrogen dioxide (another pollutant) measurements in the UV–Vis at a spatial resolution of 180 m
The used a Guassian plume model and other algorithms to derive vertical column densities of ammonia and then to derive point source emissions from those columns
The ammonia concentrations they calculated were five times higher than those reported to the European Pollutant Release and Transfer Register for that location
In the image below, you can see an ammonia plume from the fertilizer plant where the study took place
That’s it for this week! If you enjoy this topic and want to see more, you can also become a member of our paid community, which will include the following perks:
Longer (but still simplified) overviews of a single research study (as opposed to three)
Articles on coding and data science, with a focus on spatial data
Explore non-research topics related to EO opportunities in business and new applications
Comments
Nothing yet. Say the first thing.
Sign in to join the conversation.