
Do you own any stock that reports earnings this week?
Most investors find out what the market expected only after the stock has already moved.
Earnings Intel arrives the Sunday before, free: for each big report, you get the expected numbers, the move the options market is pricing, and how each stock has reacted to its own past reports.
Subscribe for free below.
Last week, Cisco beat on both lines and fell 8.4%. Tapestry beat and fell 16.5%. Nebius jumped 34% in a day.
If Walmart, Home Depot, Target or Alibaba sits in your portfolio, this is the week the market re-judges it.
Earnings day is when a position you’ve barely thought about for months moves like that, and by then it’s too late to go looking for context.
That’s what Earnings Intel is for.
You’ll know which of the week’s 66 reports actually touch the stocks you own and which are noise.
You’ll know what the options market has already priced into each big name, so when the move comes you can tell a real surprise from a stock just doing what was expected of it.
For each of the five highest-stakes reports, you’ll know the specific number and the specific pattern that has decided the reaction in past quarters, the things worth checking before the market opens on the day.
And if you don’t own any of these names, the setups below are exactly the homework you’d want done before deciding whether any of them deserve a place on your watchlist.
First, the grade on last week’s list: what we flagged, what the pricing expected, and where both were wrong.
Sixty-six US companies in our coverage report this week, carrying a combined $160.9B in expected market-cap swing. Thursday holds $85.6B of it, 53% of the week, and almost all of that lands before the bell: Walmart, Alibaba, Deere, NetEase and Futu print Thursday morning, with Ross following after the close. If you own big retail, Thursday is your week.
The pricing came closer to honest last week. Across the 15 names with a clean straddle price, the median implied move was ±13.85% and the median realized move was 11.85%, a two-point gap where earlier weeks ran to multiples. Option buyers won 8 of those 15 and sellers won 7, the first card where the buyers edged it.
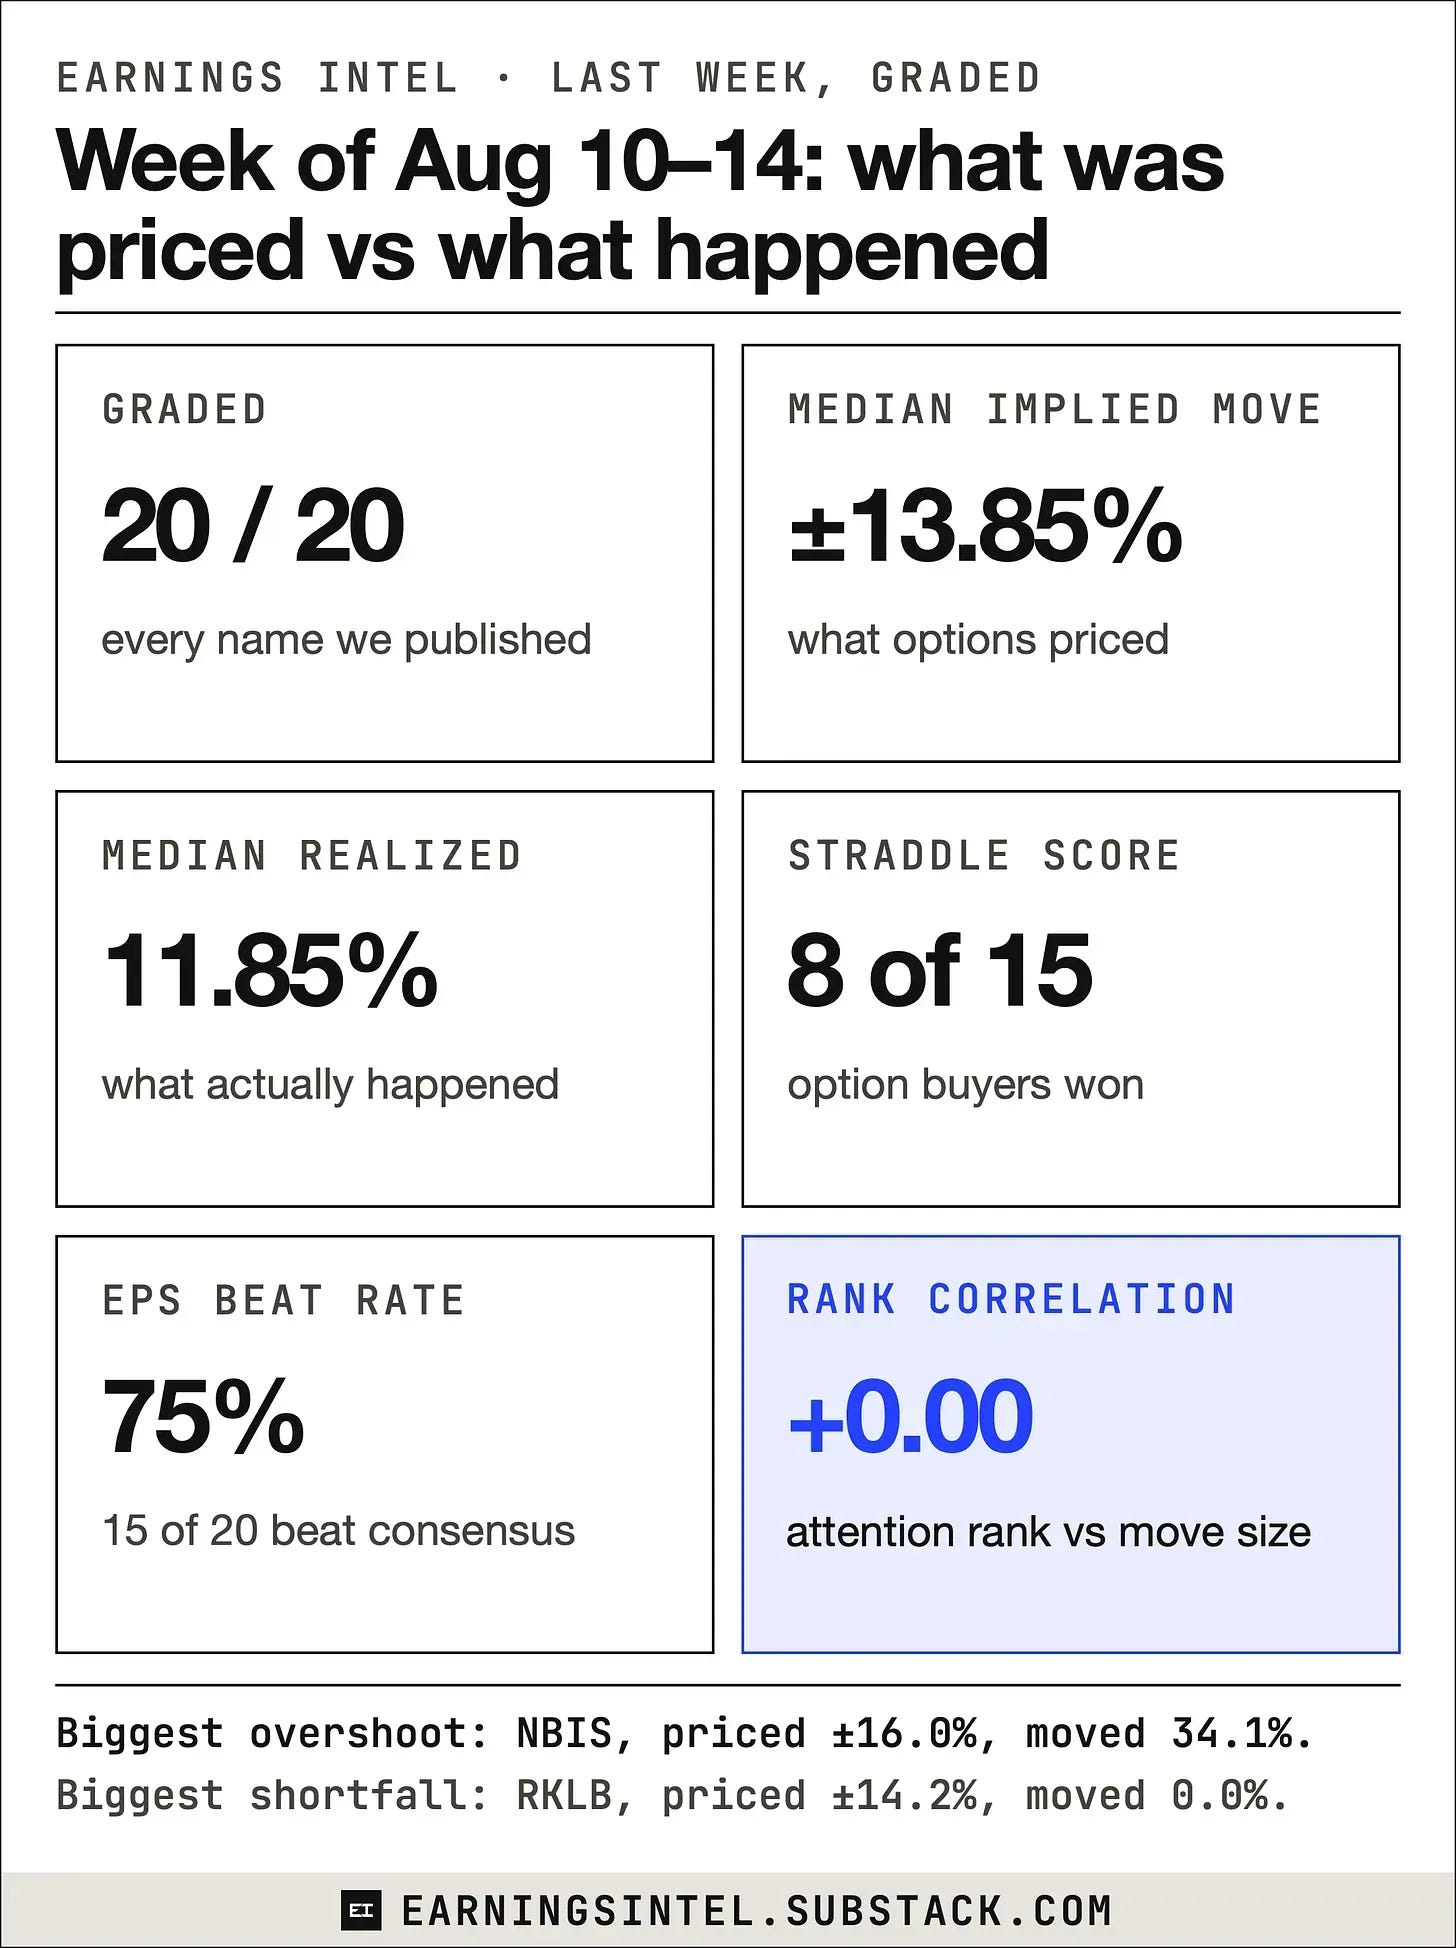
A straddle is the options bet that pays only if the stock moves more than the market priced in. Buyer won means the stock moved more than priced; seller won means it moved less.
The other five names had no clean straddle price, so we graded them against how much they normally move: one moved more than normal, four stayed within it.
The beats came through again, 15 of 20 on EPS and 15 of 20 on revenue, and the reactions still went their own way:
Nebius, priced for ±16.0%, moved +34.1% on an 83% EPS beat. The week’s biggest overshoot.
Rocket Lab, priced for ±14.2%, closed 0.04% lower on an EPS miss. The flattest print of the week, and the biggest overpricing.
Cisco beat on both lines and fell 8.4%.
Tapestry beat on both lines and fell 16.5%.
The attention-rank correlation with actual move size printed at +0.00 this week, after −0.21 in the last issue. Our ranking measures where the money and the option flow are concentrated, and so far it has told us nothing about where the surprises land. We publish this number every week regardless of what it says.
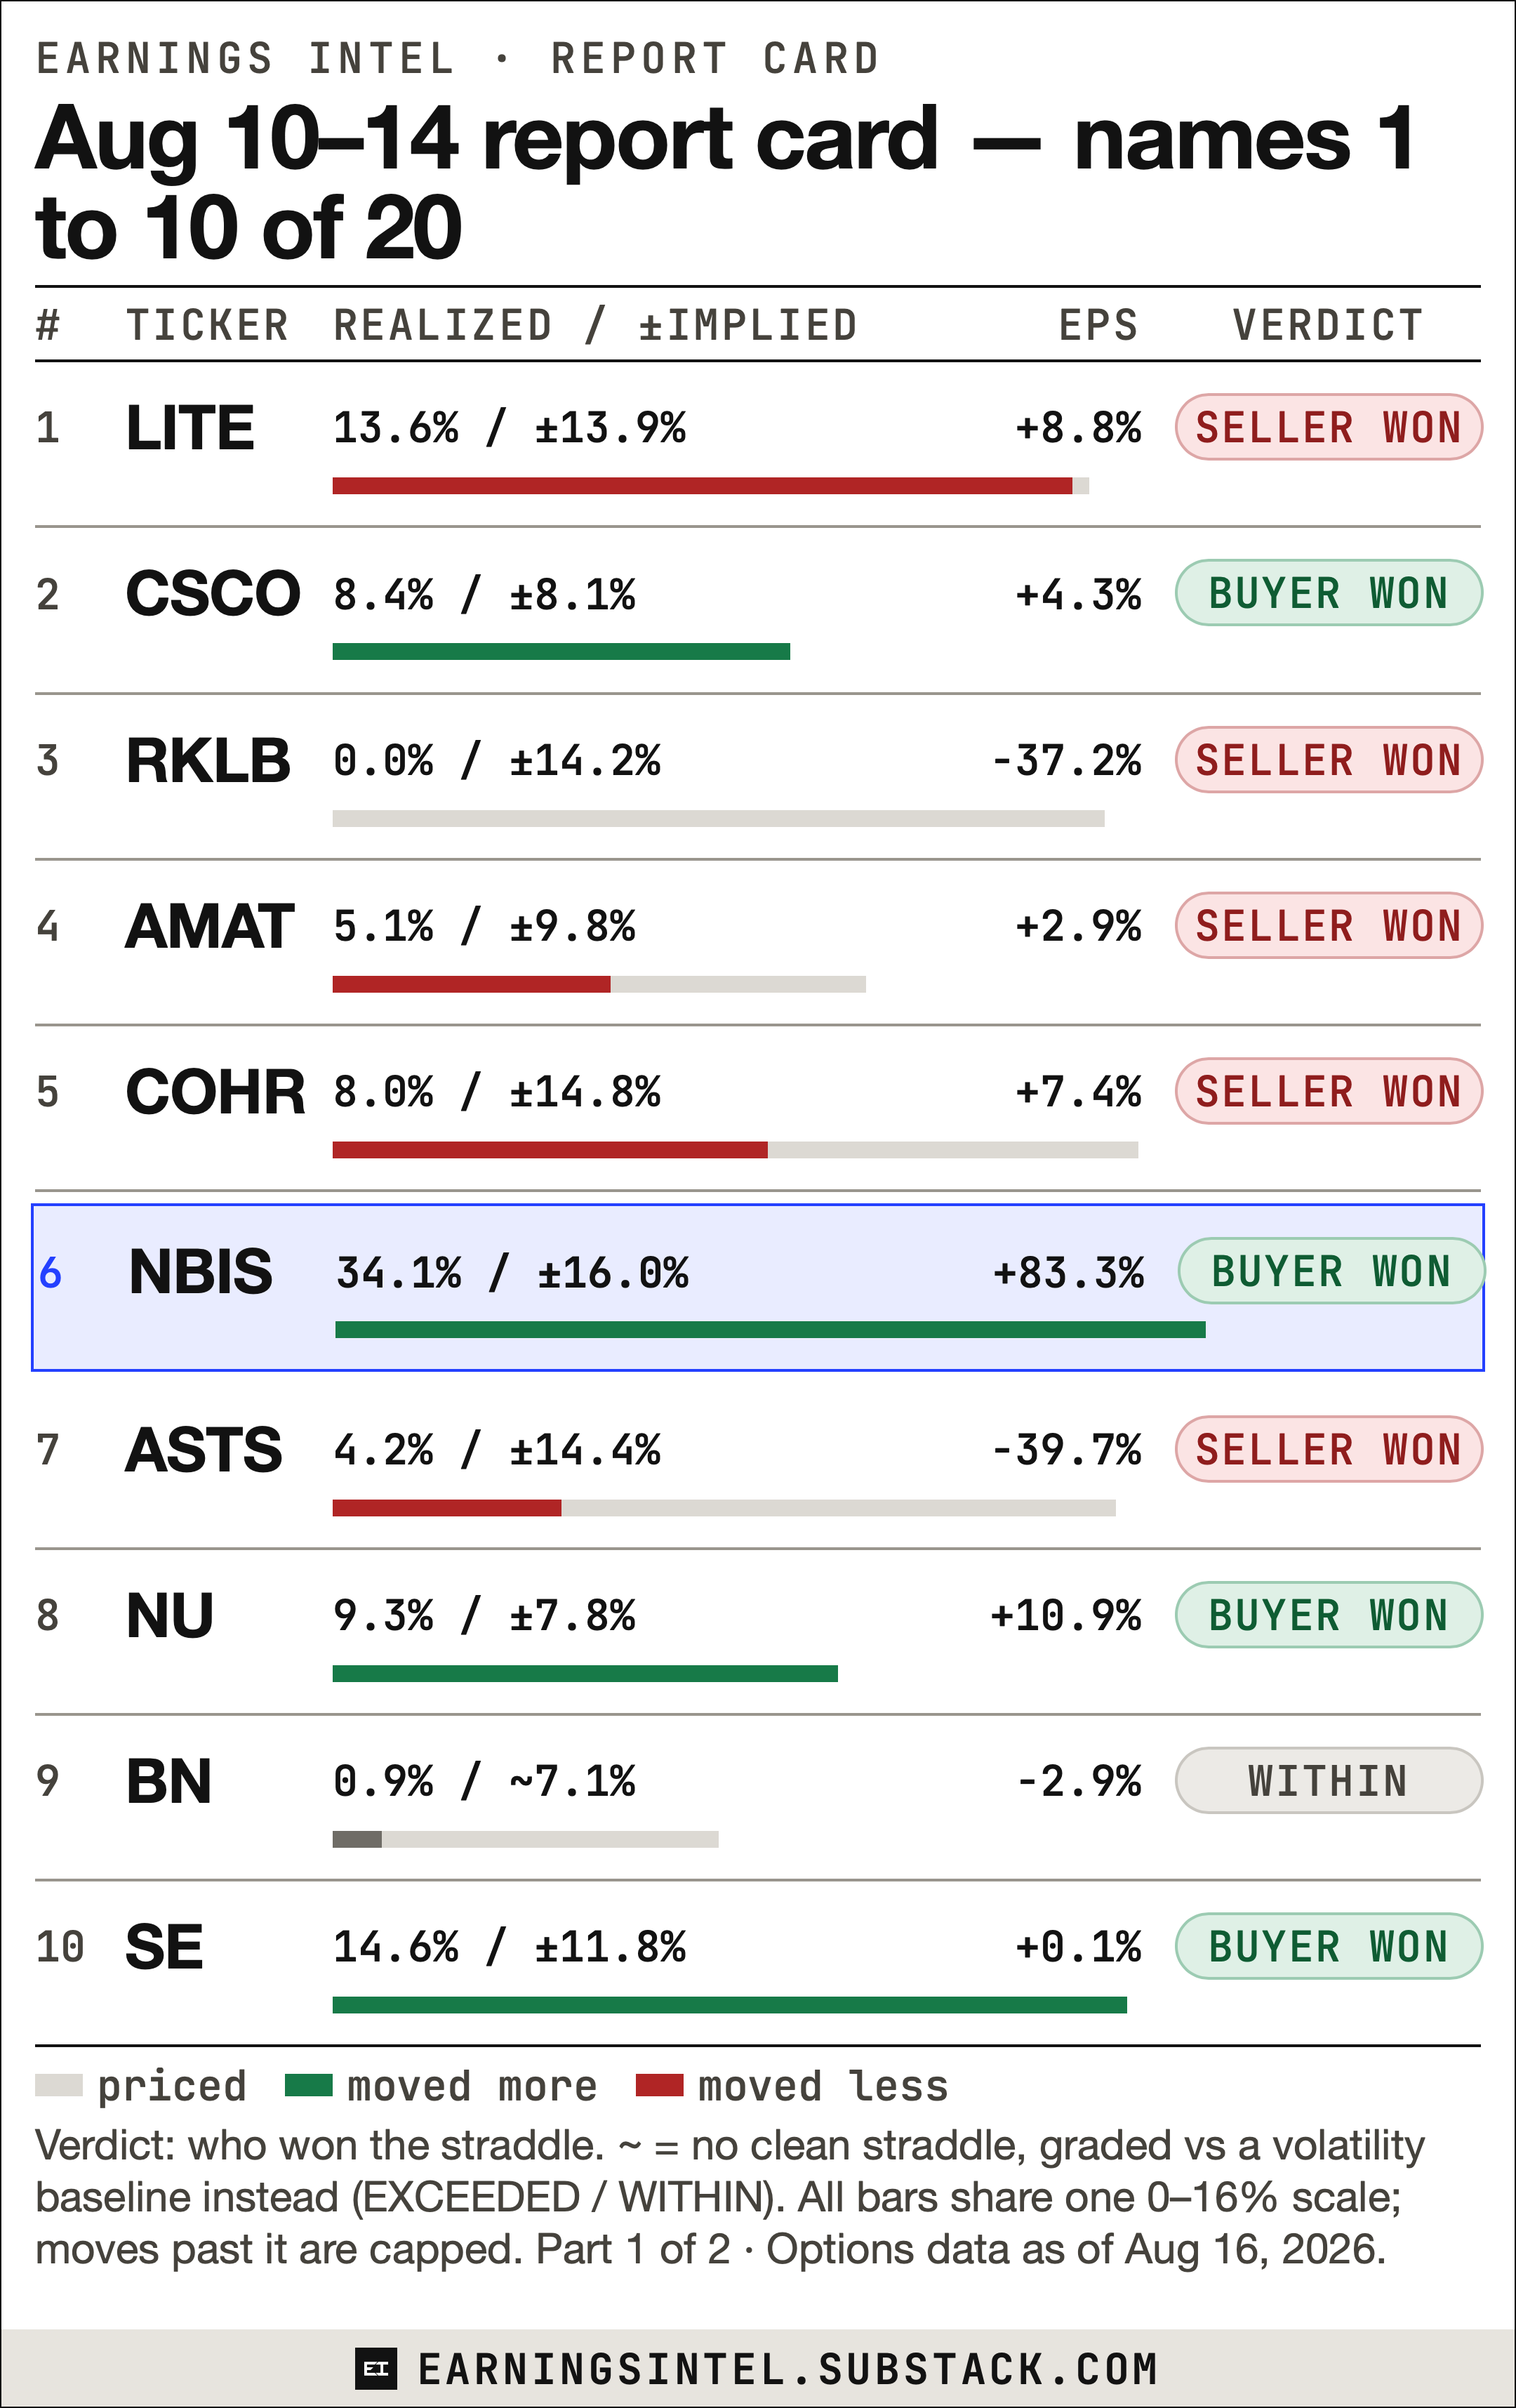
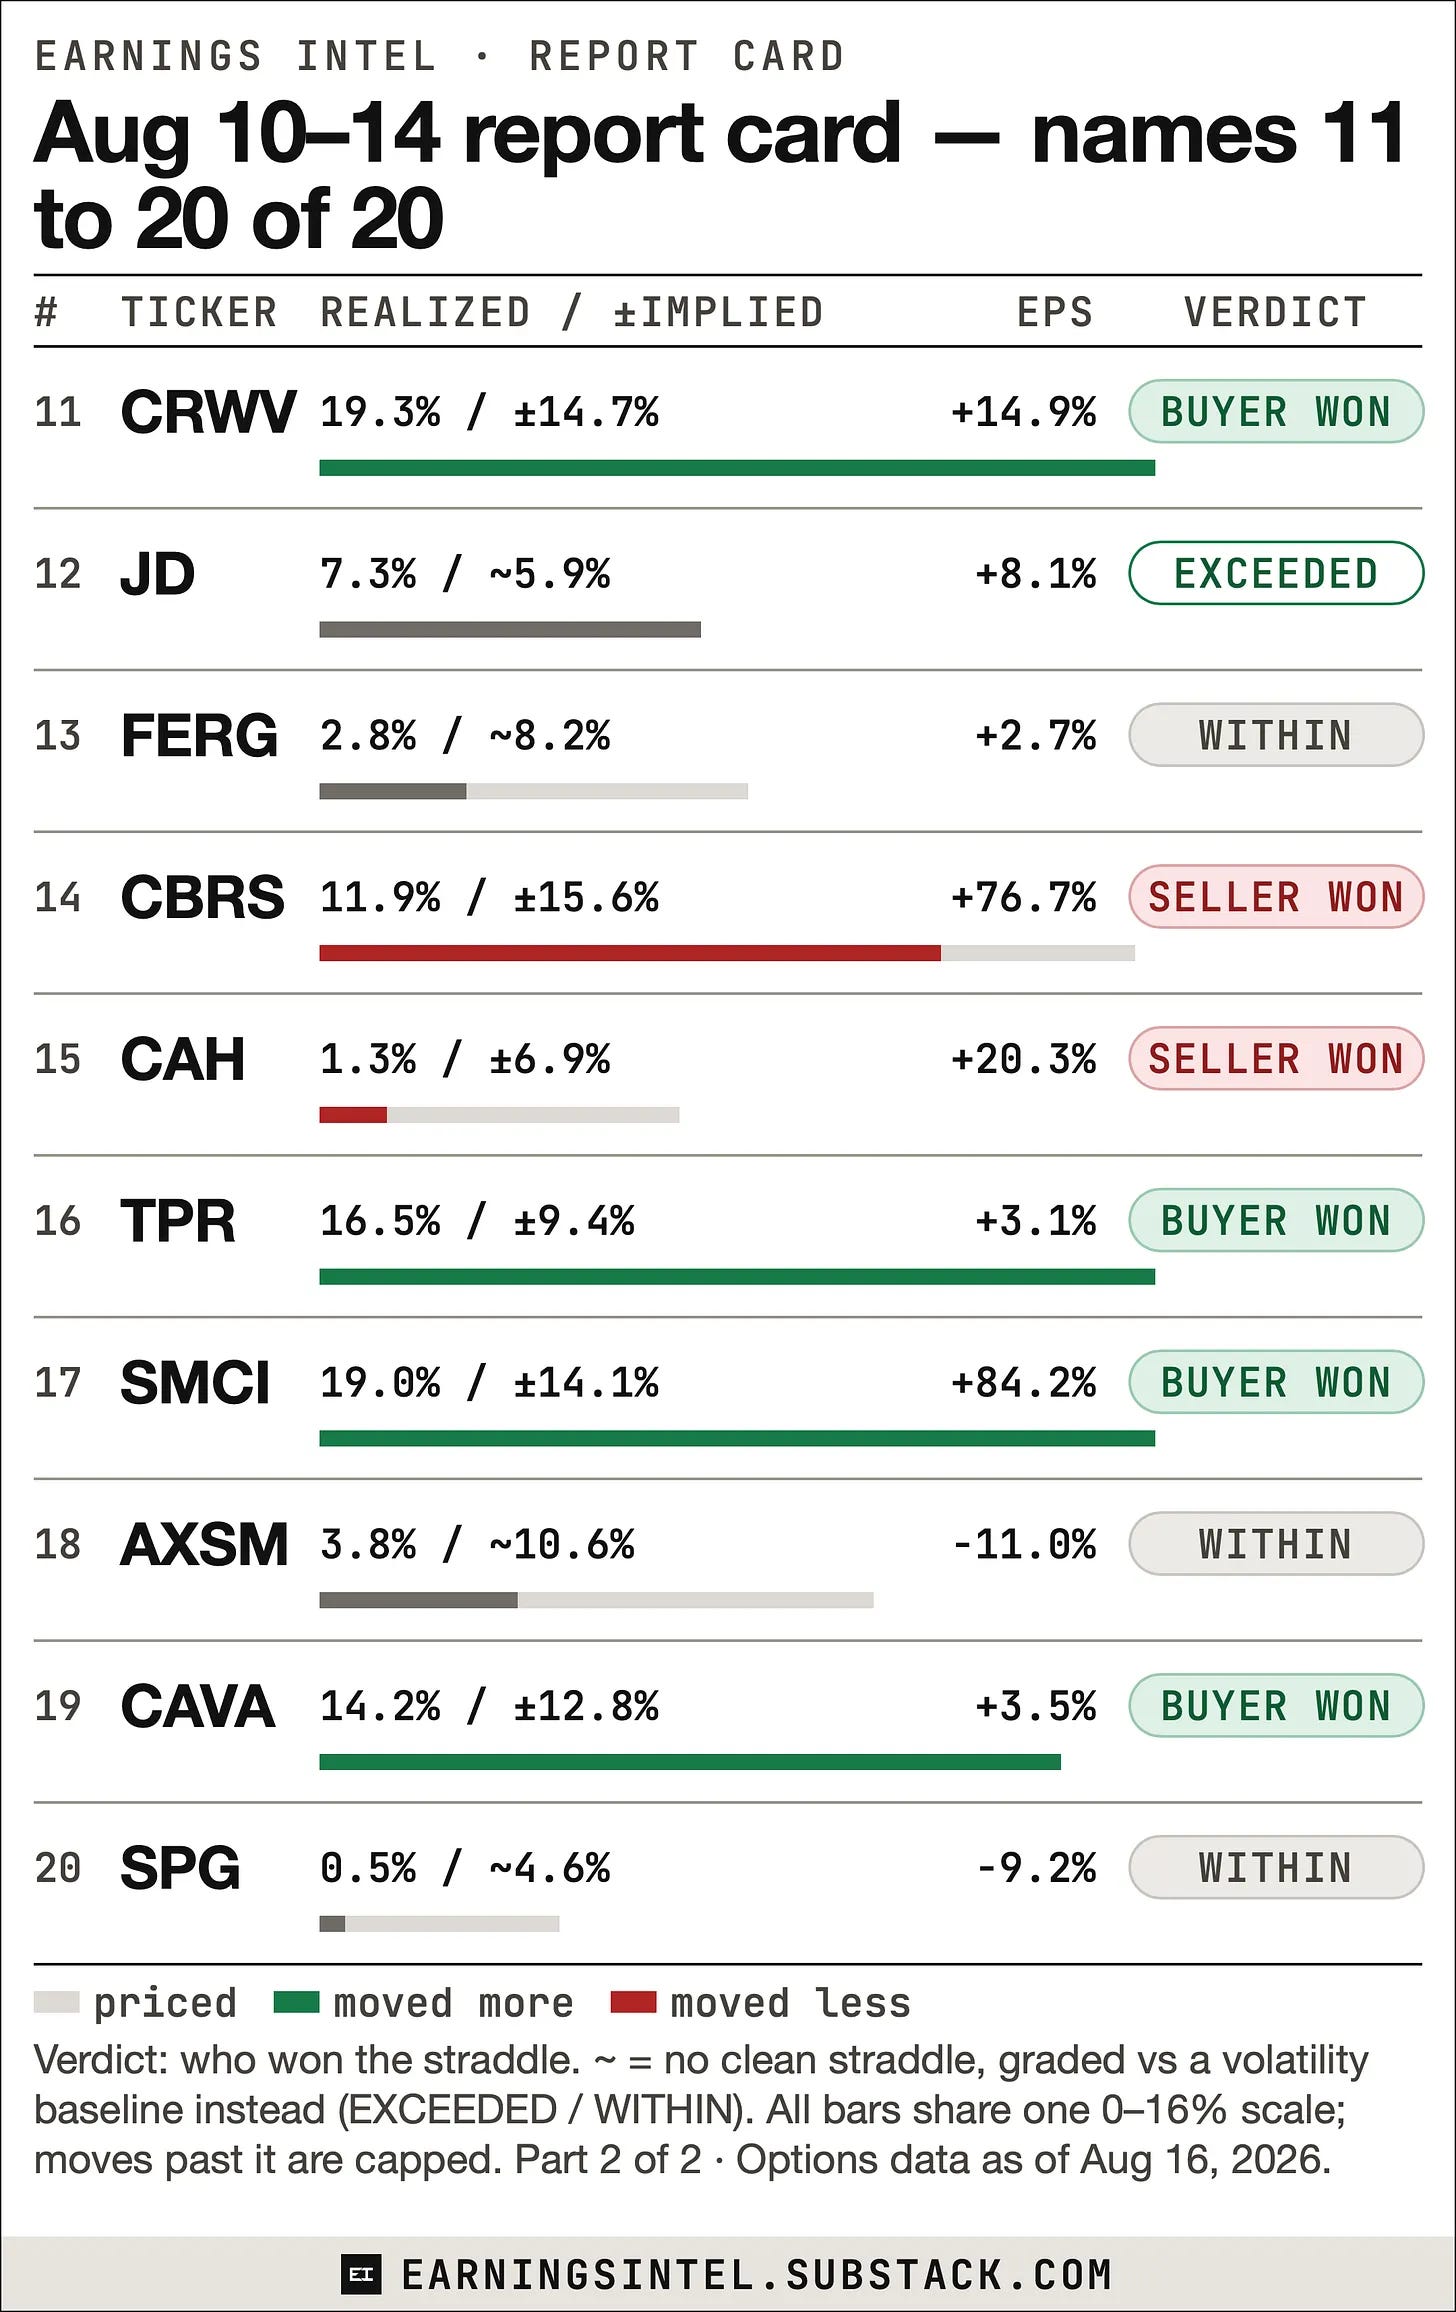
Carry that into the rest of this issue: even in a week where the median pricing was nearly right, the single names ranged from dead flat to +34%. Now, the week ahead.
Do you own any stock that reports earnings this week?
Most investors find out what the market expected only after the stock has already moved.
Earnings Intel arrives the Sunday before, free: for each big report, you get the expected numbers, the move the options market is pricing, and how each stock has reacted to its own past reports.
Subscribe for free below.
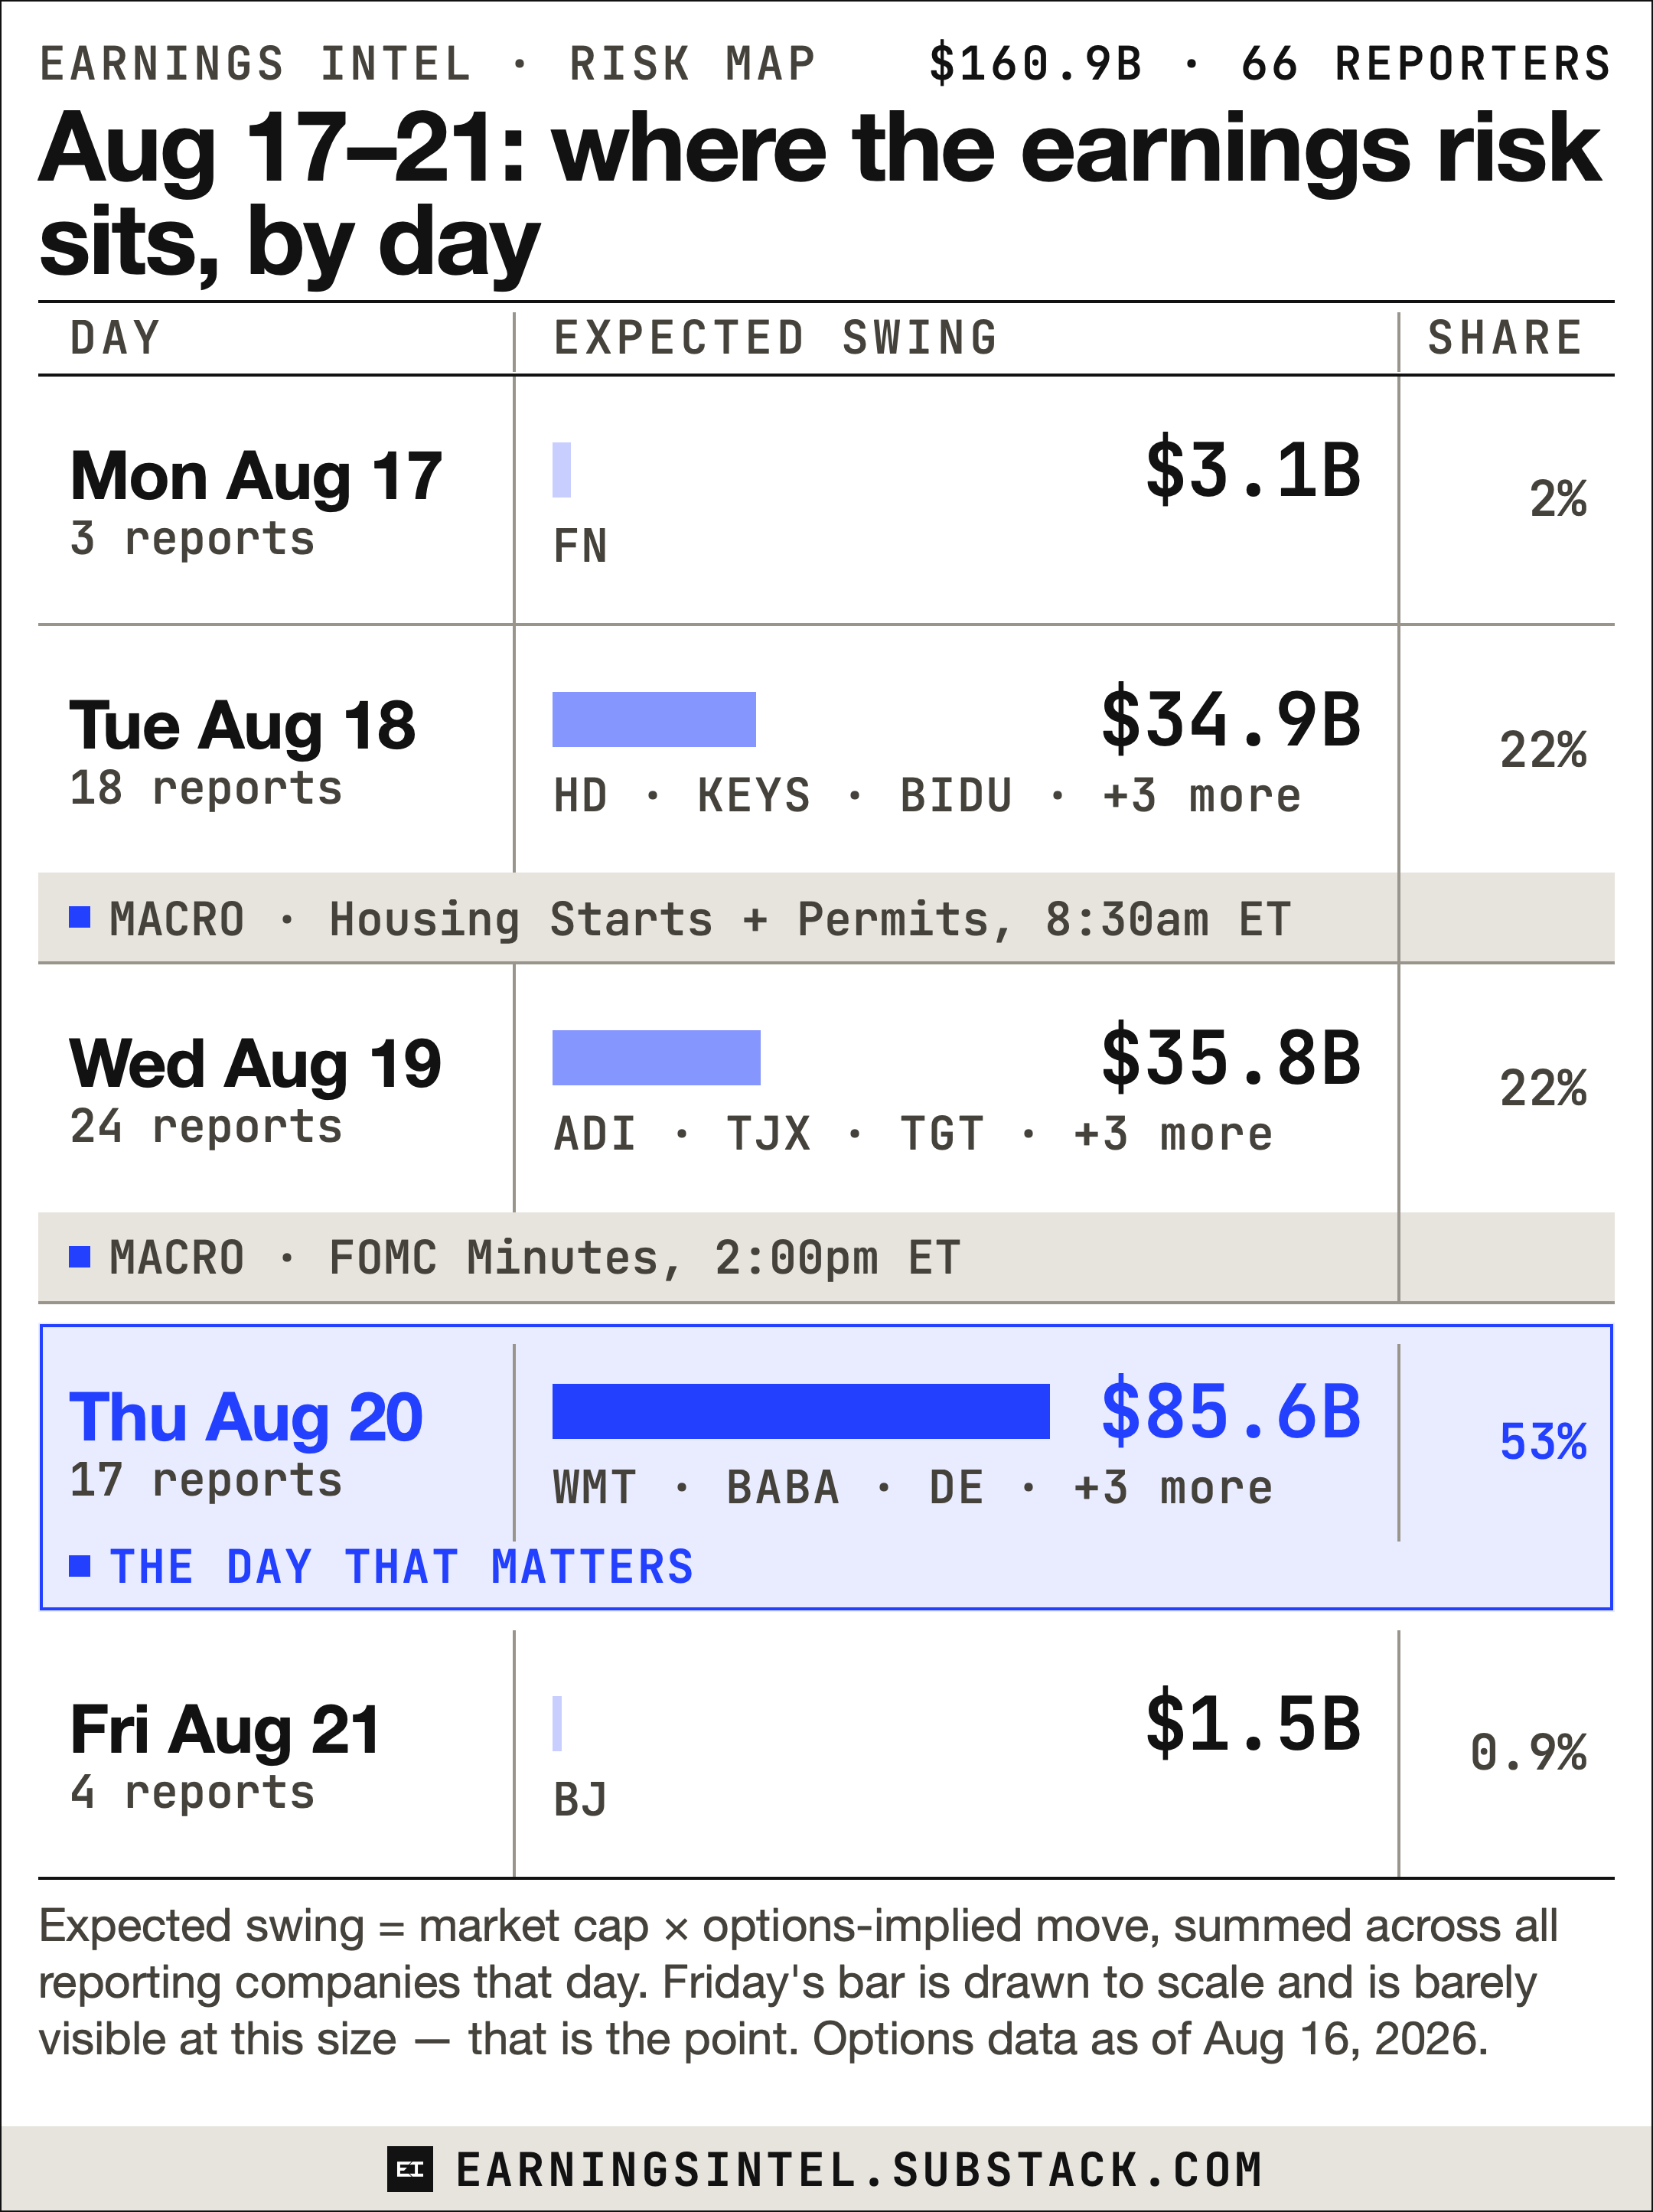
Three things the chart can’t say on its own:
Tuesday morning stacks Home Depot against Housing Starts and Building Permits, all before or at the open, with BHP’s full-year numbers already out overnight. A housing-data surprise and an HD print in the same session will be hard to untangle in real time. Keysight and Toll Brothers also report Tuesday, but after the close, so their moves land Wednesday.
Wednesday afternoon brings the FOMC minutes (2pm ET), hours after ADI, TJX, Target, Lowe’s, Estée Lauder and Viking all report in the morning. Anything rate-sensitive that prints Wednesday trades into that release.
Monday and Friday are near-empty. Monday’s only name of size is Fabrinet, and it reports after the close, so nothing on Monday’s list can move during Monday’s session. Friday belongs to BJ’s alone.
The week is also unusually concentrated in one theme: this is retail’s quarter-end. Home Depot, Lowe’s, TJX, Target, Walmart, Ross and BJ’s all report within four sessions. Only 12 S&P 500 members report this week, 3.1% of index market cap, so the index itself has limited earnings exposure. The single-stock risk is where the action is.
Which brings us to the names carrying it.
Sixty-six companies report, but five setups stand out, either because of sheer size or because the pricing tells a story. As always, what follows is a description of what’s priced in and what to watch. It is not a view on where any of these stocks go next.
HD is normally a sleepy earnings stock: its median post-earnings move over recent quarters is about 2%. This time, options are pricing ±3.7%, close to double that. Somebody expects this print to matter.
Two reasons they might be right. The stock is up 13% since its May report, so there’s a run to defend. And HD’s recent record with expectations is shakier than its reputation: it has beaten the EPS consensus in only 2 of its last 5 quarters, the weakest beat record among this week’s large caps, and its ugliest recent day (−6.0%, last November) came on a small miss. Consensus this time sits at $4.73 on $47.3B of revenue, from 21 analysts on the EPS line. One more wrinkle: Housing Starts and Building Permits hit at 8:30am the same morning. If housing data and the HD print disagree, the first hour of trading will be genuinely hard to read.
Walmart keeps beating and the stock keeps falling. Four EPS beats in the last five quarters; four negative next-day closes in those five. In May it beat on both lines and dropped 7.3% anyway, and it’s down 11.9% since.
The consensus asks for $0.74 on $186.7B, though the last five quarters suggest the beat is the easy part. What the beat is made of has decided the reaction. What stands out is how routine the options market is treating this: the ±4.6% priced is almost exactly Walmart’s normal earnings-day move, despite the streak.
Analyst EPS estimates for this quarter are scattered across a 53% spread, the widest disagreement on our entire list. Last quarter EPS landed 91% below consensus as the company’s spending ramp swallowed profits, and the spread now is a real fight over how deep and how long that investment cycle runs. When nobody agrees on the number, nobody agrees on what a beat even is.
Here’s the twist: despite all that disagreement, options are pricing ±6.5%, a touch below BABA’s usual 7.6% earnings-day move, with a mild lean toward the call side. The stock still sits 36% below its 52-week high. In recent quarters the reaction has been set by what the company says about cloud and AI capex, which usually lands well after the headline EPS line has been read. One caveat we owe you: parts of the estimate feed for this name mix reporting currencies, so hold the precise consensus figures a little loosely. We’ve flagged it in our data.
Five straight EPS beats, estimates sitting in a 3% band, options pricing an ordinary ±4.9% against a 4.6% usual move. Consensus: $3.34 on $3.91B. With a beat essentially assumed, the information in this report lives in the guide. ADI sells analog chips into industrial, auto and comms, which makes it the closest thing this week has to a reading on the broad economy. Worth remembering that a routine beat guarantees nothing: last May the company beat by 7% and closed down 3.9%.
The stock is up 21% since May and sits at 97% of its 52-week range, within 2% of the high. The odd part is how calm the positioning looks: short interest fell 17% into the print and the options skew is flat, so the hedging pressure you might expect at the high simply isn’t showing up in the data.
Consensus wants $2.26 on $26.1B. Target’s recent earnings days argue for humility: the median next-day move over the last five prints is −3.9%, including a 3.9% drop in May on a 16% EPS beat. Wednesday tests whether a beat is enough at the top of the range. Over the last five quarters, a beat on its own has not been.
There’s a reason we spent so long on Home Depot: it doesn’t just report for itself. HD and Lowe’s have posted next-day moves of similar size in 84% of comparable quarters, the strongest pairing in this week’s list. HD prints Tuesday, Lowe’s prints Wednesday, so by Wednesday’s open the market will have already marked LOW off whatever HD said. Options there are pricing ±3.2%, close to double Lowe’s usual move, partly because Wednesday is also FOMC-minutes day.
The discount-store sequence, Target (Wed) → Walmart (Thu) → BJ’s (Fri), looks like a chain, but move similarity across the three is a weak 50%. We’d read each on its own setup.
Home Depot, Walmart, Alibaba, Analog Devices and Target got the detail above. Here are the other fifteen reports on this week’s list, grouped by the day they land, with what the options market is pricing for each.
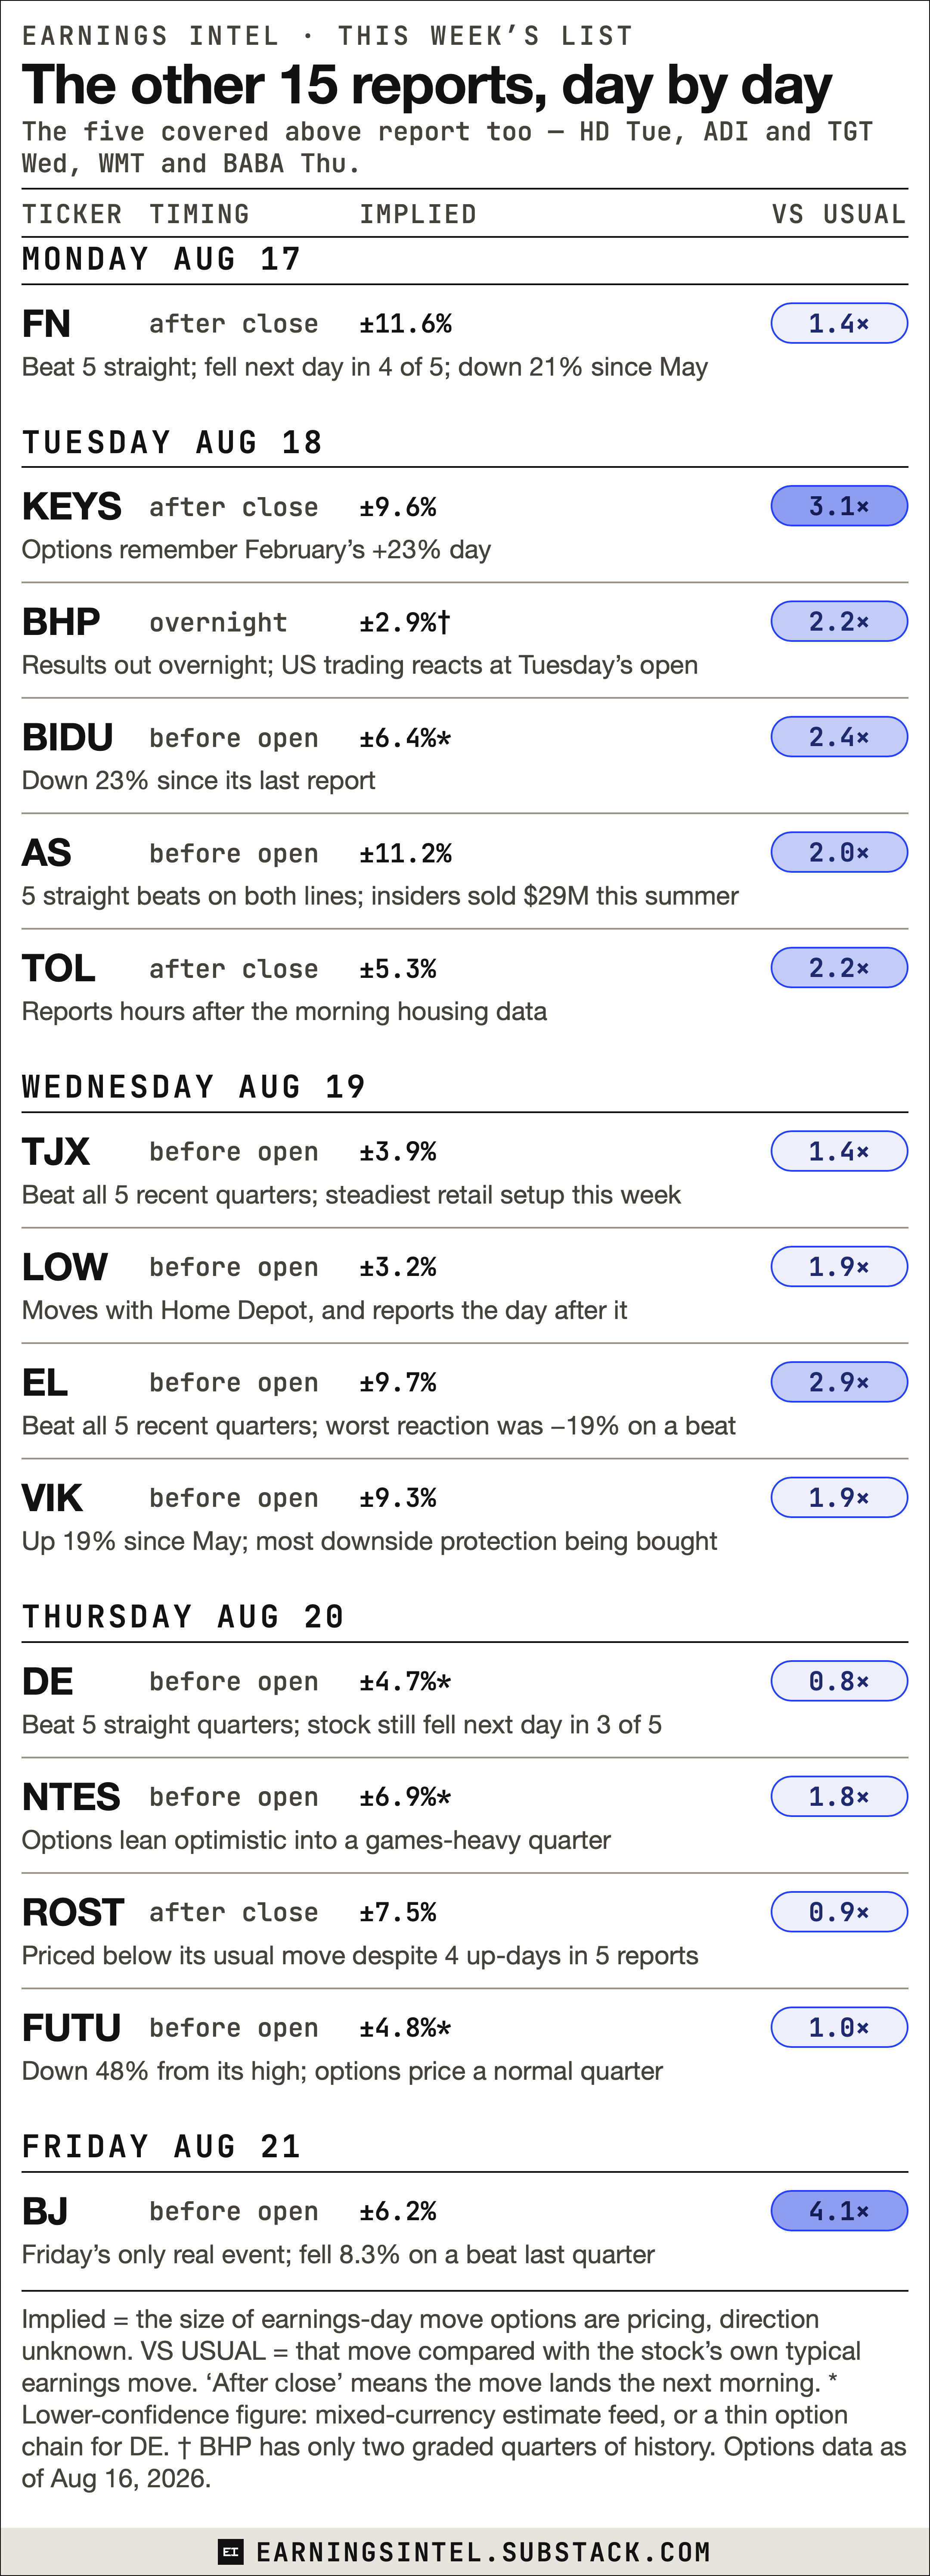
Wildcards outside the top 20, flagged for unusual pricing only: Mercury Systems (Tue after close, ±17.2% priced vs 10.5% median history) and Klarna (Tue, ±17.7% priced, which is actually below its 20.3% median; one of the few names where options are pricing less drama than the stock usually delivers).
The chart below draws the eight most unusually priced names from the whole top 20, ranked by how far the priced move sits above each stock’s own history. This week none of the five featured names makes the cut; the strangeness lives further down the list.
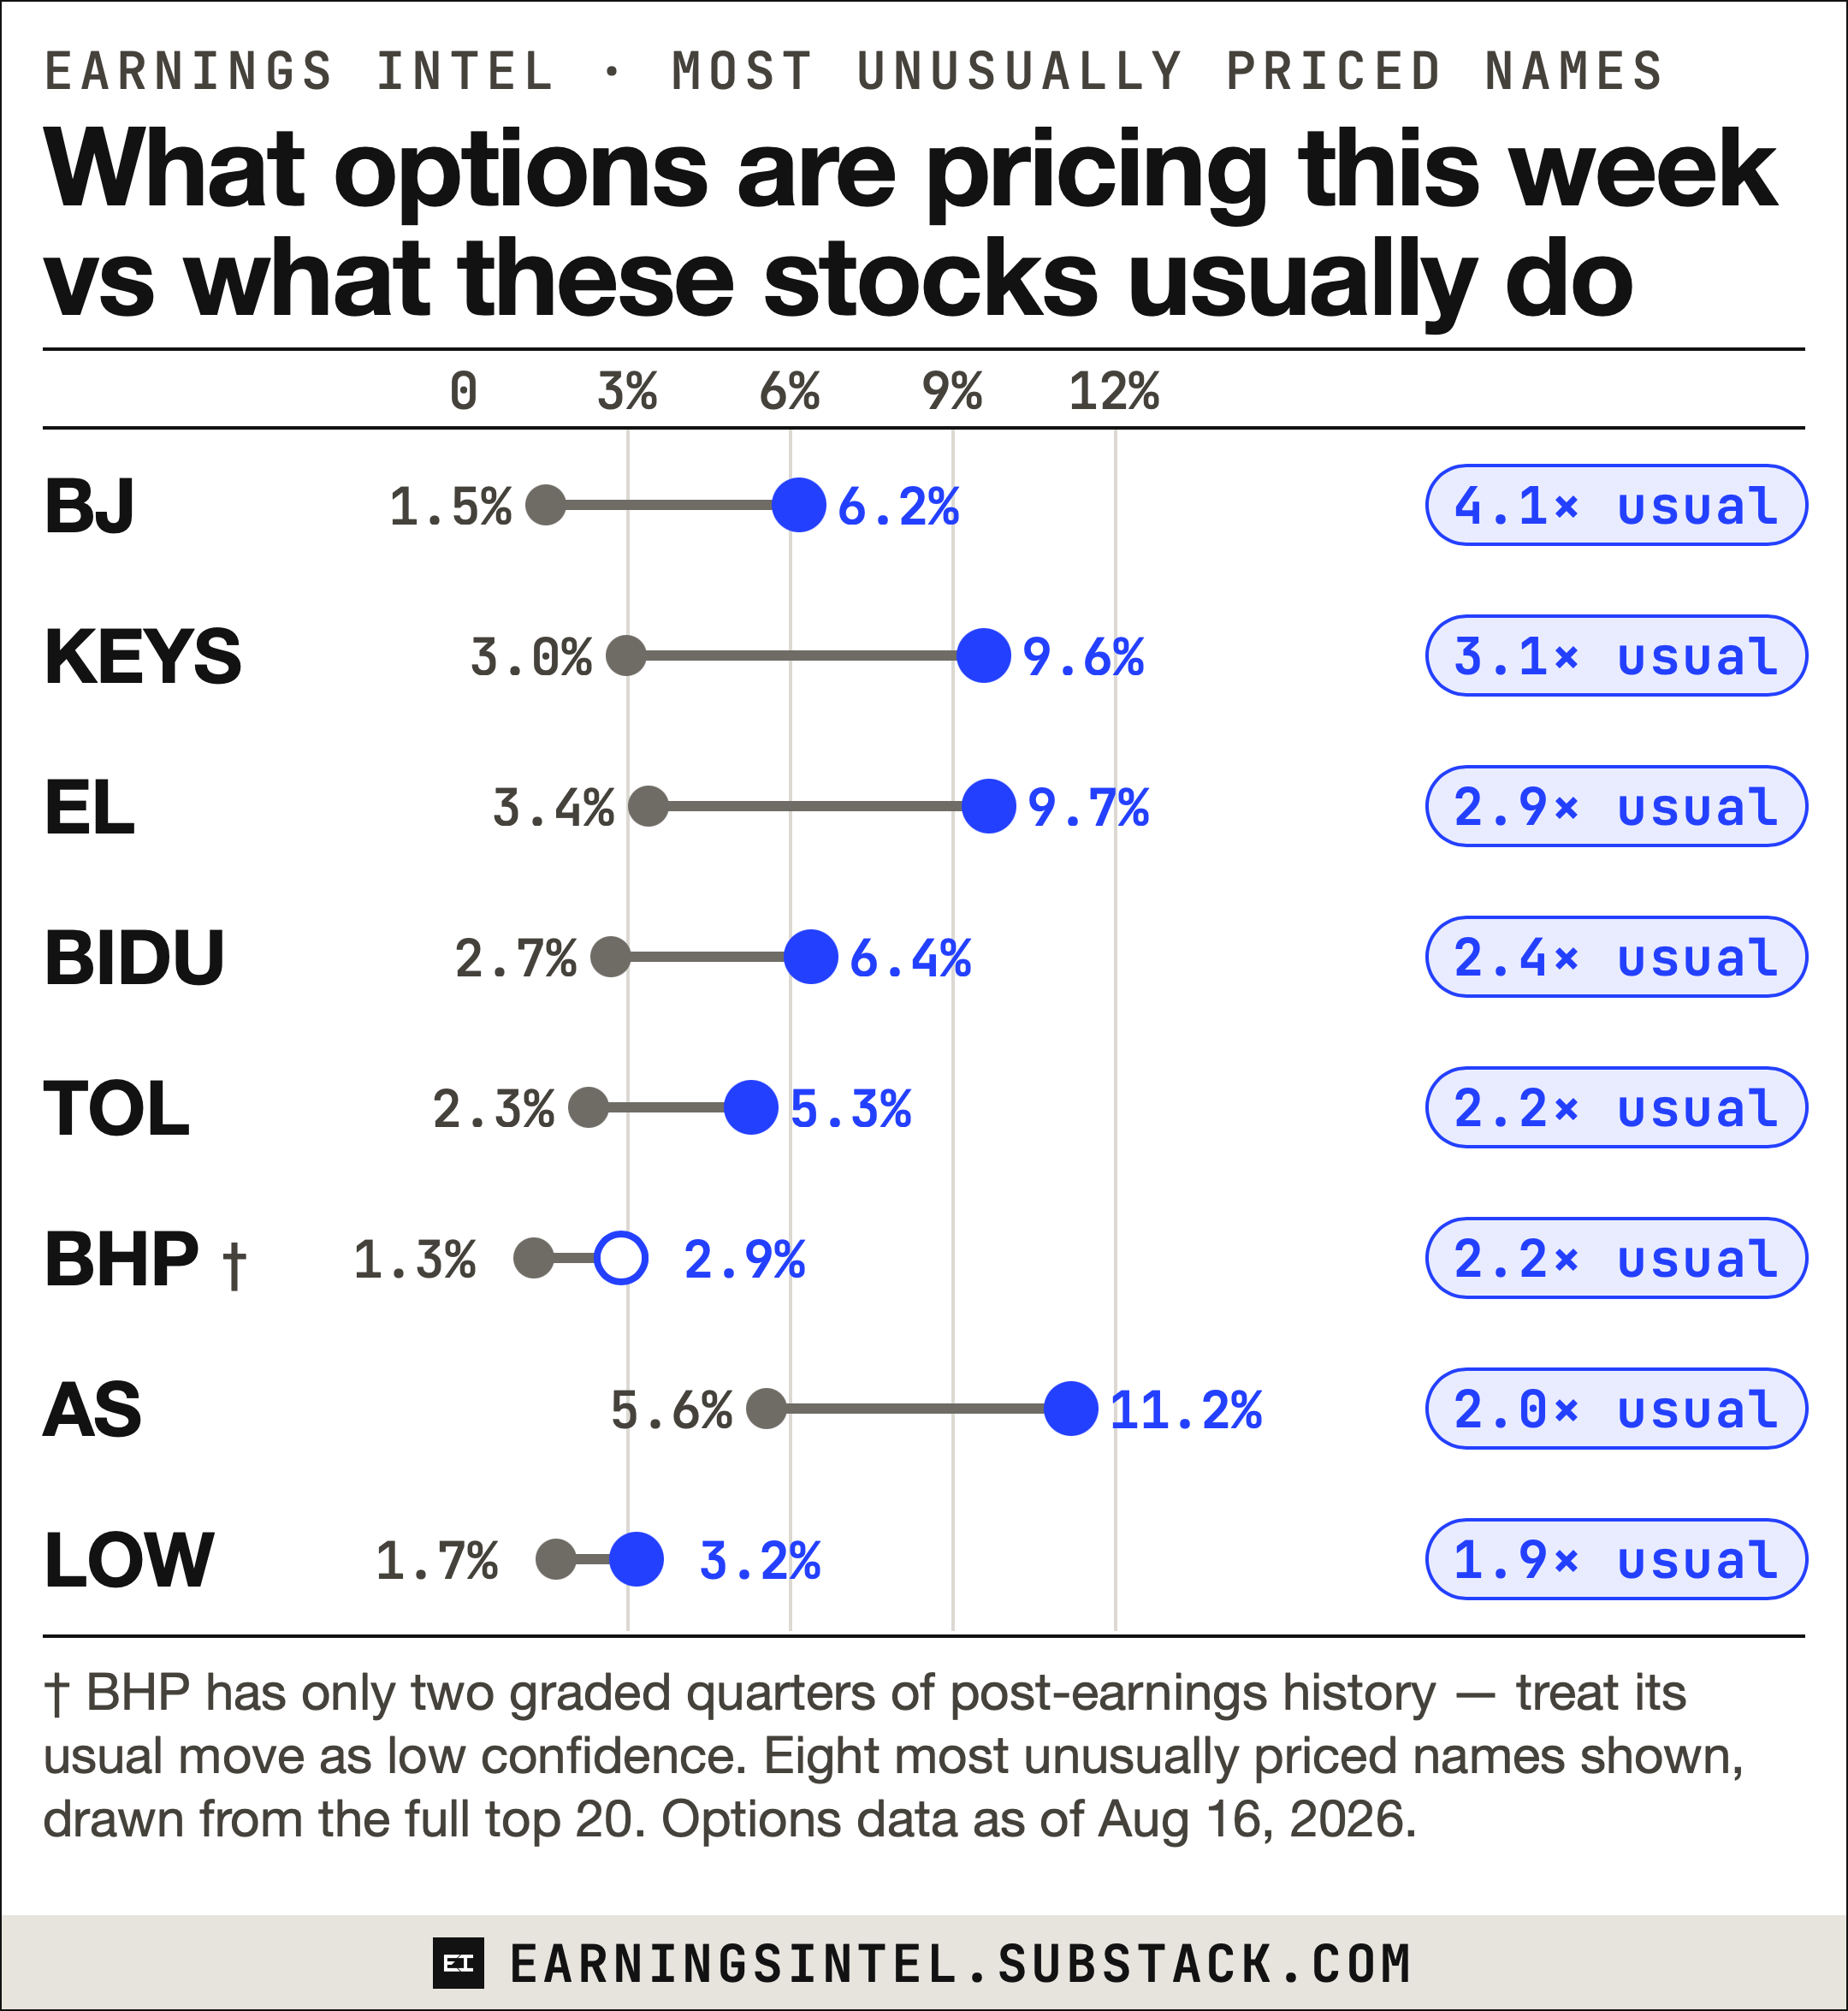
The frozen list above becomes next week’s report card: 20 names, graded against exactly these numbers, including whatever we got wrong.
This publication provides research and educational content for investors rather than investment advice. We present valuation data, options-market information, and model estimates along with their assumptions; however, we do not offer buy or sell recommendations, price forecasts, or specific portfolio advice. All figures are timestamped as indicated and may be updated. Always conduct your own due diligence or seek advice from a licensed professional before acting on any information here.
No posts
Comments
Nothing yet. Say the first thing.
Sign in to join the conversation.