
Every year, the Global Payments Report gives me more to think about than almost anything else that crosses my desk. It’s dense, it’s genuinely global, and it rewards a second and a third read. The 11th edition is no exception.
After a decade with this report, I’ve settled into a particular way of reading it. The skill I care about most in payments strategy isn’t reading a number off a chart. Anyone can do that. The work, and the part I enjoy most, is reading what sits underneath the number. A share figure tells you that something is winning. The deeper question, the one worth your time, is how it’s winning, on whose rails, and what that means for everyone else in the chain.
GPR 2026 is full of numbers that reward exactly that kind of reading. Three of them made me stop and rethink something I thought I understood.
[Click here to Read the full Global Payments Report 2026]
Let's break it down.
If you follow the Western payments press, the big in-store story this year is Apple. For years, the iPhone’s tap-to-pay NFC chip was reserved for Apple Pay. In mid-2024, Apple agreed to open it to rivals in Europe, and the field moved in fast. The report tracks Klarna rolling out tap-to-pay across 14 European markets in December 2025, PayPal launching in-store in Germany, and Vipps in Norway claiming the first real alternative to Apple Pay on an iPhone (p. 16). In Europe, that genuinely is a landmark.
But the GPR does something useful here. It puts Europe back into a global picture, and in that picture the tap isn’t the headline at all. The scan is.
Look at how people actually pay by phone in a shop. The share reaching for a QR code rather than a tap:
Argentina: 84%
China: 80%
Colombia: 76%
Philippines: 74% (all p. 17)
These aren’t edge cases. The report shows five markets where payment apps already carry the majority of in-store transaction value, led by China at 89% (pp. 14-15), and it forecasts that payment apps will reach 46% of all in-store transaction value globally by 2030, growing 135% faster than the point of sale growth itself (pp. 12-13).

Source: Global Payments Report 2026, p. 17. [Click here to Download the full report]
Here’s the part I keep coming back to, because it travels far beyond QR codes. NFC, which involves active microchips and radio-frequency transmission and allows for encryption, dynamic data updates, and two-way communication, is widely considered a more sophisticated technology than a QR code, which is simply a static 2D barcode that can be read optically by a camera. It needs a secure chip in every phone and a contactless terminal on every counter, so it spreads only as fast as that hardware gets replaced on both sides. A QR code needs a printout and a camera. One scales at the speed of a hardware refresh cycle. The other scales at the speed of a sheet of paper.
So in markets that already had deep, well-functioning card terminals, there was little urgency to change, and the tap simply carried the existing card rails onto the phone. In markets that didn’t have that base, QR didn’t wait for the hardware. It routed around the gap. The rail that wins is rarely the most elegant one. It’s the one that fits the infrastructure and the cost structure already on the ground. That’s the lesson, and it holds across almost every payments shift I’ve watched.
This is where the shorthand gets risky, because it hides the only question that really matters: which contactless. A tap usually rides card rails, which means interchange, chargebacks, and the card networks earning on every transaction. A QR scan in Brazil, India, or much of Southeast Asia usually rides an account-to-account rail, money moving directly from bank to bank, at close to zero cost, with different settlement timing and a different fraud model, and the card networks sitting outside the flow.
So the QR story isn’t really about technology. It’s about who controls the in-store rail and who earns on it. Europe’s NFC opening is, at heart, card networks and their challengers competing over the tap. The QR boom across APAC and Latin America is driven by national systems and fintechs building rails that bypass the tap-and-card economics altogether.
The report makes that tangible. It tracks how these QR-based systems are now pushing past their own borders, with Brazil’s Pix and India’s UPI gaining acceptance abroad, and Project Nexus linking the instant-payment rails of India, Malaysia, the Philippines, Singapore and Thailand (pp. 18-21). The in-store rail question is quietly becoming a cross-border one. If your markets sit outside the card-led West, those guides will show you which rail you’re actually building on.
This is the number that will travel furthest from GPR 2026: digital wallets are now the leading way people pay worldwide, at 56% of online transaction value and 33% of in-store transaction value in 2025 (p. 38). It’s true, and it matters. It’s also the doorway, not the room.
Because a digital wallet isn’t a payment method. It’s a container. Apple Pay, Google Pay, PayPal, Alipay, these are wrappers, and the question I always want answered is what sits inside the wrapper when someone pays.
Is the tap funded by a credit card?
By a direct bank transfer?
By money preloaded into the app?
The same gesture at checkout can sit on completely different rails, with completely different economics. The single most useful addition to GPR 2026 is that its market guides now estimate the funding mix inside the wallet, market by market (p. 23). It was the first thing I turned to.
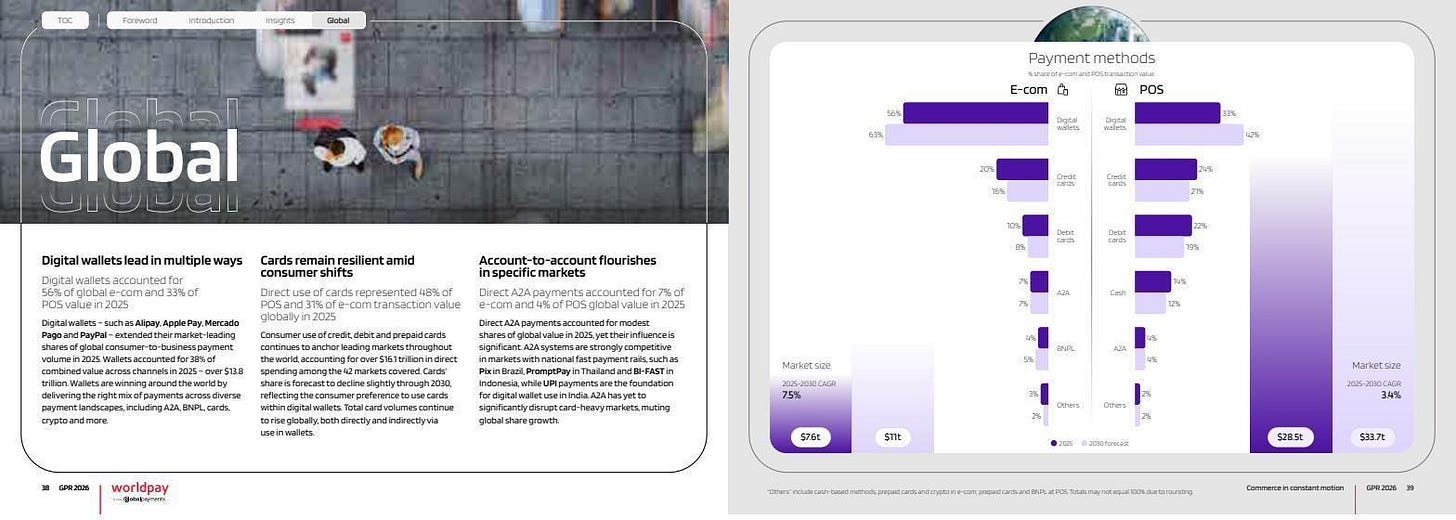
Source: Global Payments Report 2026, pp. 38-39. [Click here to Download the full report]
Put Japan and India side by side, and the point makes itself.
In Japan, a digital wallet is essentially a credit card living in a phone. The report’s funding-mix estimate shows cards, especially credit cards, leading what’s inside Japanese wallets (pp. 56-57), which fits the market with the highest direct credit-card share online in the entire report, at 58% of e-commerce value. In India, a wallet with the same generic name is an entirely different machine. Its funding mix is led by account-to-account transfers through UPI, ahead of stored cards (pp. 52-53), because UPI moves money straight from one bank account to another for free.
Two markets. The same rising “wallet share.” The same small icon at checkout. Underneath, two different rails, two different cost structures, and two different sets of companies getting paid.
It’s the difference between two people who both tell you they drink from a cup. One holds espresso, the other holds water. The container was never the story.
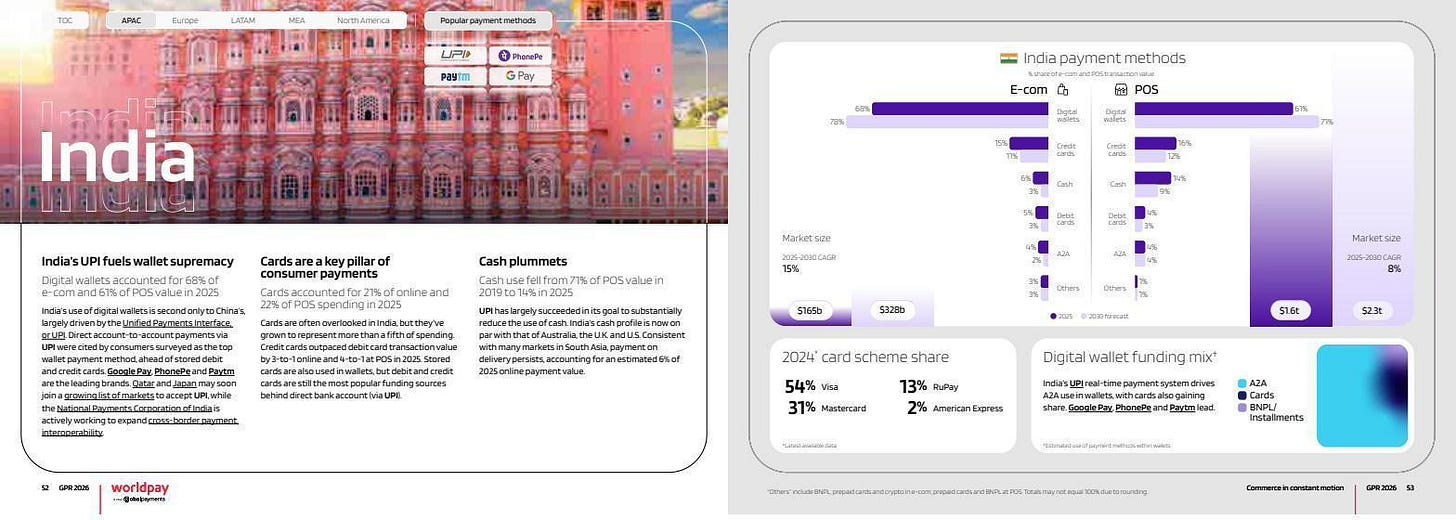
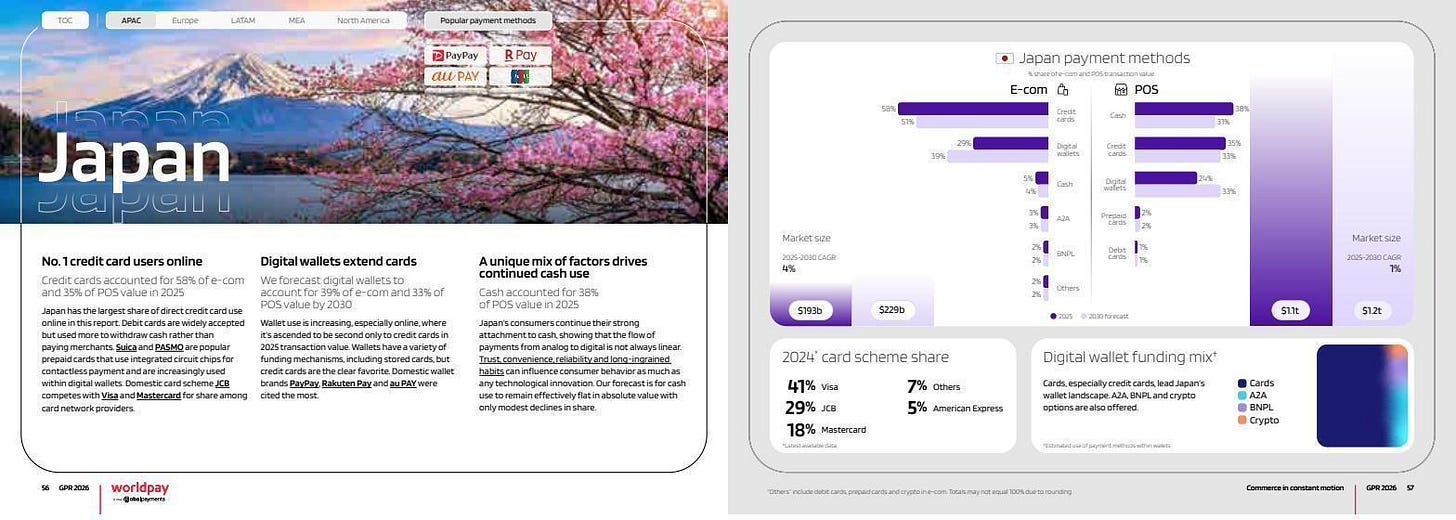
Source: Global Payments Report 2026, India pp. 52-53 and Japan pp. 56-57. [Click here to Download the full report]
There’s a second, quieter point here, and the report is refreshingly direct about it. The easy reading of “wallets up” is “cards down.” The GPR pushes back: total card volumes are still rising globally, both directly and through their use inside wallets (p. 38). Cards were still 48% of in-store and 31% of online value in 2025, over $16 trillion in direct spending, and where their direct share slips, much of that volume hasn’t left the card rails at all. It has simply moved inside a wallet. In a card-led market, “the wallet won” and “the card won” can be the same sentence. The wallet just became the new front door to the card.
This is why “we support digital wallets” tells you almost nothing on its own. It describes the front door and says nothing about the plumbing. The funding mix is what determines:
Cost of acceptance: interchange on a card-funded wallet, versus close to zero on an A2A-funded one
Fraud and dispute exposure: chargebacks behave very differently across the two
Who your real counterparty is: the card networks and issuers, or a domestic bank rail
The report even breaks out the networks inside each market. Japan’s domestic JCB still holds 29% of card-scheme share; India’s RuPay, 13% (pp. 53, 57), detail the headline number erases. And it shows where this ends up: in a handful of markets, wallets have become superapps, Alipay and WeChat Pay in China, and increasingly Mercado Pago and the neobanks across Latin America (pp. 26-27). When the wallet becomes the place where the customer lives, the funding-mix question becomes the oldest question in this industry: who owns the relationship?
[Click here to read the full Global Payments Report 2026]
We’ve all heard the line for fifteen years. Cash is on its way out, heading inevitably to zero. GPR 2026 quietly tells a more interesting story.
Globally, cash at the point of sale eases only from 14% of value in 2025 to 12% in 2030 (p. 38). That’s a two-point drift across five years, which isn’t the profile of something dying. And in several of the wealthiest economies on earth, it’s barely moving at all:
Germany: 32% of in-store value (2025)
Spain: 34% (both p. 79)
Japan: 38% (p. 43)
These aren’t developing markets waiting for card infrastructure to arrive. They’re rich, fully banked societies that have simply chosen not to give cash up on cue.
The Japan guide is unusually candid. It expects Japanese cash to stay “effectively flat in absolute value with only modest declines in share” (pp. 56-57), drifting from 38% to 31% by 2030, and it puts that down not to a lack of infrastructure but to trust, convenience, reliability, and long-ingrained habit. That’s a striking thing for a payments report to highlight: that the move from analog to digital isn’t always linear, and that in some markets the floor is structural, not temporary.
Hold Japan up against India and the whole pattern explains itself. India’s cash didn’t gently decline. It fell off a cliff, from 71% of in-store value in 2019 to 14% in 2025 (pp. 52-53). Same six years, opposite outcome. The difference wasn’t wealth, or smartphones, or willingness to go digital. It was one piece of infrastructure. India built UPI, a free, instant, government-backed bank-to-bank rail, and gave cash somewhere better to go. Japan never built an equivalent pull, and its consumers had no reason to leave a system they trust.
So the lesson isn’t “cash is resilient,” and it isn’t “cash is dying.” It’s sharper than either. Cash leaves precisely when a genuinely better rail arrives to replace it, and it stays, indefinitely, where one hasn’t. The decline isn’t a function of time. It’s a function of whether something has been built to displace it, and whether habit will yield.
A lot of strategy quietly assumes cash trends to zero on a predictable curve. Acceptance roadmaps, store-format decisions, the business case for retiring cash handling, many of them assume the cash line takes care of itself if you wait long enough. The report says that in Germany, Spain and Japan, it won’t, certainly not inside any horizon you’re planning around. The floor is real, and in some major markets it sits three to four times higher than a “cashless by 203X” assumption would budget for.
And notice how this loops back. The markets where cash actually collapsed, India and Brazil, are the same markets where a domestic account-to-account rail displaced it. Cash didn’t lose to “digital” in the abstract. It lost to a specific rail. Which is the same thing the wallet-funding data and the QR data were telling us. Every market in the report carries its own cash floor and its own line to 2030. The useful question was never “when does cash die.” It’s “what, if anything, is positioned to replace it here,” and you answer that market by market in the guides.
Three numbers, three stories that run deeper than the headline. Read them together, and they stop being separate observations:
Wallets are winning, but the funding inside the wallet decides the economics and the owner.
Contactless is booming, but the rail under the tap decides who earns and who’s bypassed.
Cash is declining, except where nothing has been built to replace it, in which case it holds.
Put plainly: payments in 2026 is no longer a story about digital replacing analog. That contest is largely settled. It’s a contest about which digital rail wins in each market, card rails, account-to-account rails, or stored-value and superapp rails, and about who controls and earns on that rail. The headline shares compress all of that into a single percentage. The real value of this report is that it lets you decompress it again: to see the funding mix inside the wallet, the rail under the contactless figure, and the force, or the absence of one, behind every cash line.
That, for me, is the whole point of payments strategy. Anyone can read a share number off a chart. The value is in reading the rail and the economics underneath it, and that reading now sits in the GPR’s 42 market guides, each carrying the wallet funding mix, the card-scheme breakdown, and the forecast to 2030.
I’ve only pulled on three threads here, and deliberately the most quoted ones. I haven’t touched the report’s read on:
BNPL quietly reinventing itself: the supposed card-killer now fuelling card-backed installments while its pioneers turn into banks (pp. 28-31)
Crypto finding real consumer relevance: not through the revolution it promised, but through ordinary card rails, with crypto-linked card spending up sharply in a single year (pp. 32-35)
“Glocalization”: the slow knitting-together of domestic rails into cross-border networks that could reshape who even needs the global card schemes (pp. 18-21)
Each of those rewards reading at the same depth.
So here’s where I’d normally tell you to go read the report. Instead, let me tell you what to read it for: not the share numbers you’ll see quoted everywhere this month, but the composition underneath them, and specifically the market that matters most to you, which is almost certainly not one of the three I used here.
[To Download the Global Payments Report 2026, click here]
Thanks for reading, and feel free to share this newsletter with anyone you think could benefit from my breakdown, or the Global Payments Report itself.
Dwayne Gefferie
No posts
Comments
Nothing yet. Say the first thing.
Sign in to join the conversation.