
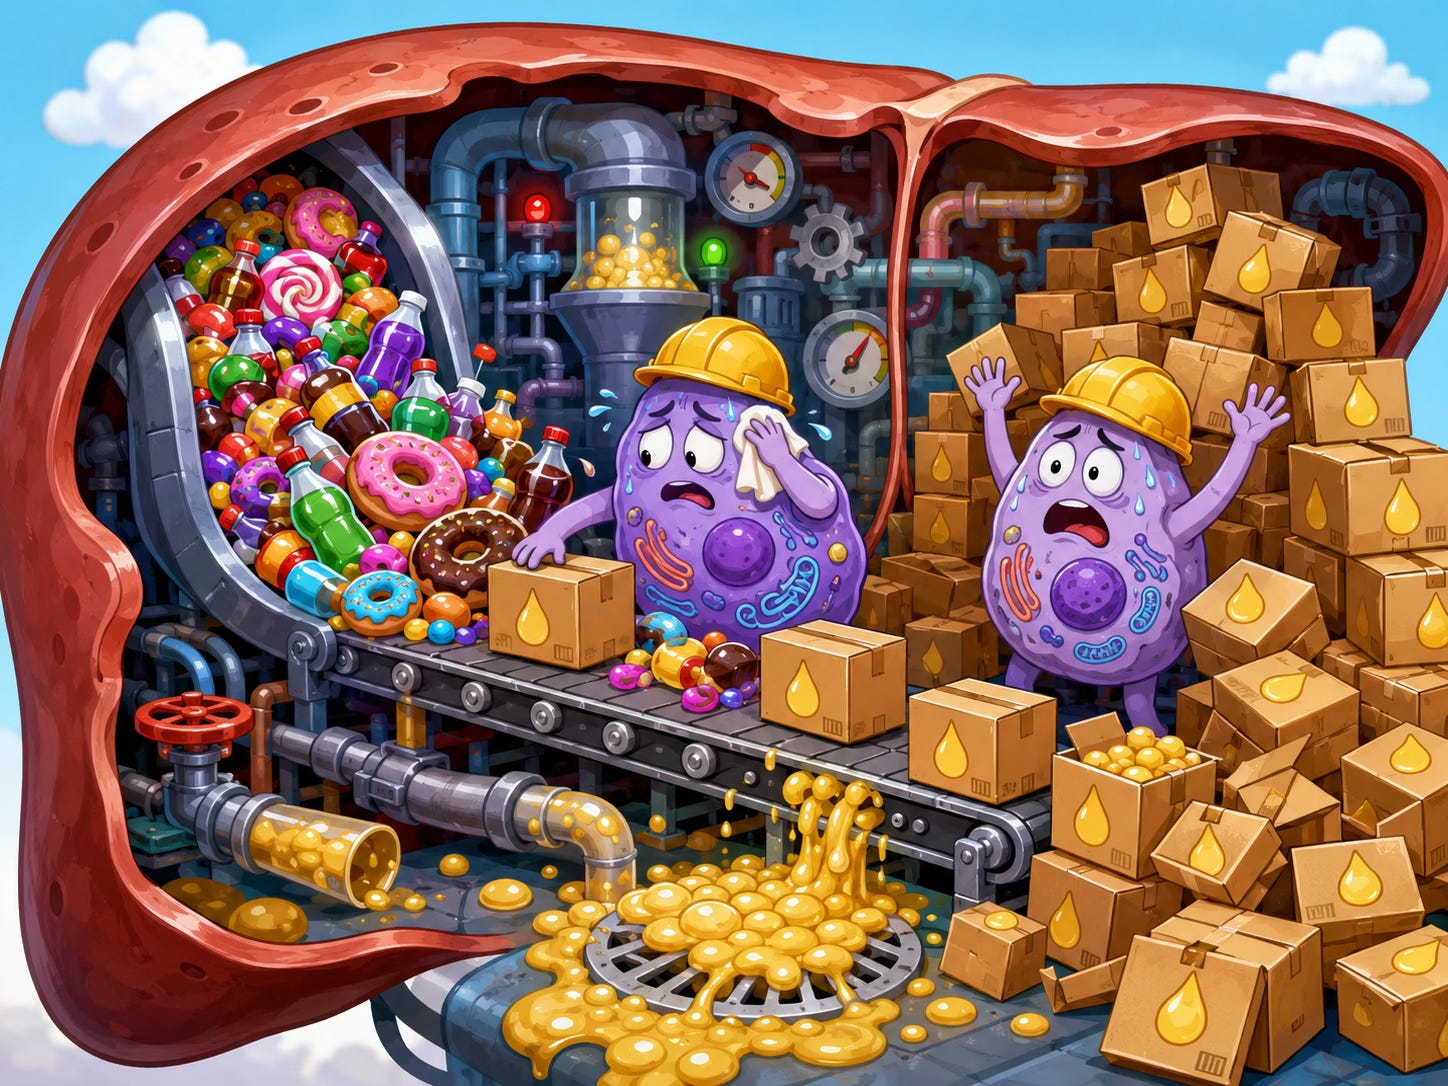
Here is something a plumber knows that most doctors never talk about. Every clogged drain starts the same way. The water swirls a little longer before it disappears. You notice, but you don’t call anyone because the sink still works. Six months later, it won’t drain at all, and the fix is ten times harder than it would have been the week you first spotted the slow swirl.
The interesting thing about your liver is that it works exactly like this. Fat flows in from the bloodstream. It gets processed, packaged, burned, or shipped out to other tissues. Whatever’s left over sits in temporary storage. And as long as outflow keeps pace with inflow, the whole system runs clean, the way a drain runs clean when nothing is stuck in the pipe.
But when inflow overtakes outflow, fat starts piling up inside the liver cells. And here is the part that makes fatty liver so different from most other conditions you might develop. You can’t feel it. The organ has almost no sensory receptors for this kind of buildup. There is no pain signal, no nausea, no early warning. About one in three adults is walking around right now with a liver that’s slowly backing up, and the vast majority of them have no idea. Doctors now call this metabolic dysfunction-associated steatotic liver disease, or MASLD (until 2023 it went by nonalcoholic fatty liver disease, or NAFLD). The biology is the same under either name.
For decades, nobody could say with any precision where the fat in a fatty liver actually came from. Was it arriving from the food you ate? Leaking out of your fat tissue? Or was the liver somehow building new fat on its own?
A tracer study answered these questions the hard way, by infusing people with labeled isotopes for four days before a scheduled liver biopsy and then tracing which fats ended up inside the organ. What they found was that three separate sources were feeding the liver’s drainage system, and the balance between them was not what anyone expected.
The largest share, roughly 59%, came from circulating fatty acids released by fat tissue. When your fat cells lose the ability to hold onto their stored fat (a hallmark of insulin resistance), those fatty acids spill into the bloodstream and flow straight to the liver. Think of it as the main sewer line feeding the system. The bigger your insulin resistance problem, the wider this pipe opens.
The second source accounted for roughly 26% of the fat in the liver, and it had been manufactured right there on-site. The liver had taken glucose, fructose, and amino acids, broken them down into two-carbon building blocks, and assembled those building blocks into brand-new fat through a process called de novo lipogenesis, which translates to “new fat creation.” Both glucose and fructose feed this process, though fructose does so faster because it bypasses the normal feedback controls that slow glucose processing. To understand how significant that is, a separate tracer study compared the rate of this internal manufacturing in people with high liver fat versus people with normal levels. The factory was running at more than three times the speed in those with fatty liver.
The third source, roughly 15%, was dietary fat arriving directly from meals.
That middle number changes how you think about the problem. More than a quarter of the fat clogging a fatty liver was never poured down the drain from the outside. It was being manufactured inside the pipes. The liver was building new fat from the sugars and other precursors flowing through the system, and in people with fatty liver, that factory never shut off. In healthy livers, fat production rises after meals and drops during fasting. In fatty livers, the production line ran around the clock, without that normal rise-and-fall rhythm. The factory had lost its off switch.
When a drain backs up long enough, the damage eventually spreads to rooms you wouldn’t expect. A fat-loaded liver leaks inflammatory signals into the bloodstream, and those signals reach the cardiovascular system, the kidneys, and the body’s ability to regulate blood sugar. Most people hear “fatty liver” and assume the danger is liver failure. It isn’t. Cardiovascular disease is actually the leading cause of death in people with this condition. The pipe doesn’t burst where the clog is. It bursts in the walls.
The disease also moves through stages. Simple fat buildup can progress to active inflammation, then to fibrosis (scarring of the liver tissue), and eventually to cirrhosis. How far along the fibrosis has gotten is the single strongest predictor of how someone will fare long-term. But here is the part that makes the rest of this article worth reading. Fibrosis can reverse, and the data on how far it can reverse may surprise you.
When the research points to fructose as a driver of liver fat, it is tempting to hear that as “stop eating fruit.” That would be exactly the wrong conclusion, and the mechanism explains why.
The difference between fructose from a whole apple and fructose from a can of soda has nothing to do with the molecule. The molecule is identical. What differs is how fast it gets to your liver and how much arrives at once.
Your small intestine has its own fructose-processing system. When fructose trickles in slowly, buffered by fiber, water, and intact plant cell walls (the way it does when you eat a piece of fruit), the intestine handles most of it before it ever reaches the liver. Animal research suggests the intestine clears roughly 90% of low-dose fructose on its own, converting it to glucose and organic acids before it hits the portal vein, the blood vessel that runs from the gut to the liver.
But pour fructose in fast and concentrated, the way a glass of juice, a soda, or the added sugars in ultra-processed foods deliver it, and the intestinal system can’t keep up. Fructose spills past the overwhelmed intestine, floods the portal vein, and arrives at the liver in exactly the form that feeds the fat-manufacturing pathway described above.
Consider the numbers. A whole medium apple contains roughly 10 to 13 grams of fructose (depending on the variety) packaged inside about 4 grams of fiber, a cup of water, and intact cell walls. That fructose trickles into the system over the time it takes to chew and digest a solid food. Extract that same fructose into a glass of apple juice and it arrives stripped of its fiber, with nothing to slow it down. You drink it in minutes. A can of soda pushes 30 to 40 grams of sugar into the system even faster, roughly double what a whole apple delivers, and without a single gram of fiber to buffer the load.
Same molecule. Completely different metabolic event.
The research that links fructose to liver fat did not remove whole fruit from the diet. It removed added sugars, sugar-sweetened beverages, and juice. One of those trials defined its target as “free sugars,” a category that includes sugars added during food processing and sugars naturally present in fruit juice but does not include the sugars naturally locked inside intact whole fruit. Whole fruit was not restricted, and liver fat still dropped.
Population data tell the same story. Whole fruit consumption tracks with neutral or slightly reduced risk of fatty liver disease. Sugar-sweetened beverage consumption tracks with a dose-dependent increase.
Everything above explains why your liver backs up. What follows is how to reverse it. Researchers changed one thing about what people ate, kept the calories the same, and measured what happened to liver fat in nine days. The result, the full reversal protocol, and a printable tracking worksheet are below.
Upgrade now to access.
Comments
Nothing yet. Say the first thing.
Sign in to join the conversation.