
Part 3 of the neocloud series · $IREN · $CRWV · $NBIS · Research locked 11 August 2026, before the August results cycle.
In March I said these three companies were not the same. In May I admitted my system could not price them. This time I rebuilt the valuation engine—and it changed my answer.
Disclosure upfront: I own a lot of CoreWeave. I am holding it through 2028 unless the operating thesis breaks. That position does not change the model below, but it belongs at the top—before the conclusion.
So my model told me Nebius was worth $438 a share.
The stock was trading around $185. For a second, my stomach dropped. Had I been wrong? Had I missed the double everyone else could see?
I didn’t believe the number. Good thing.
The capex line was dividing dollars-in-millions by shares-in-raw-units. Tens of billions of annual datacentre spending effectively disappeared. The model priced Nebius as if the build cost nothing. The same bug flattered CoreWeave to $446 and IREN to $121.
Refinitiv data going in. Garbage coming out. Good data, broken pipe.
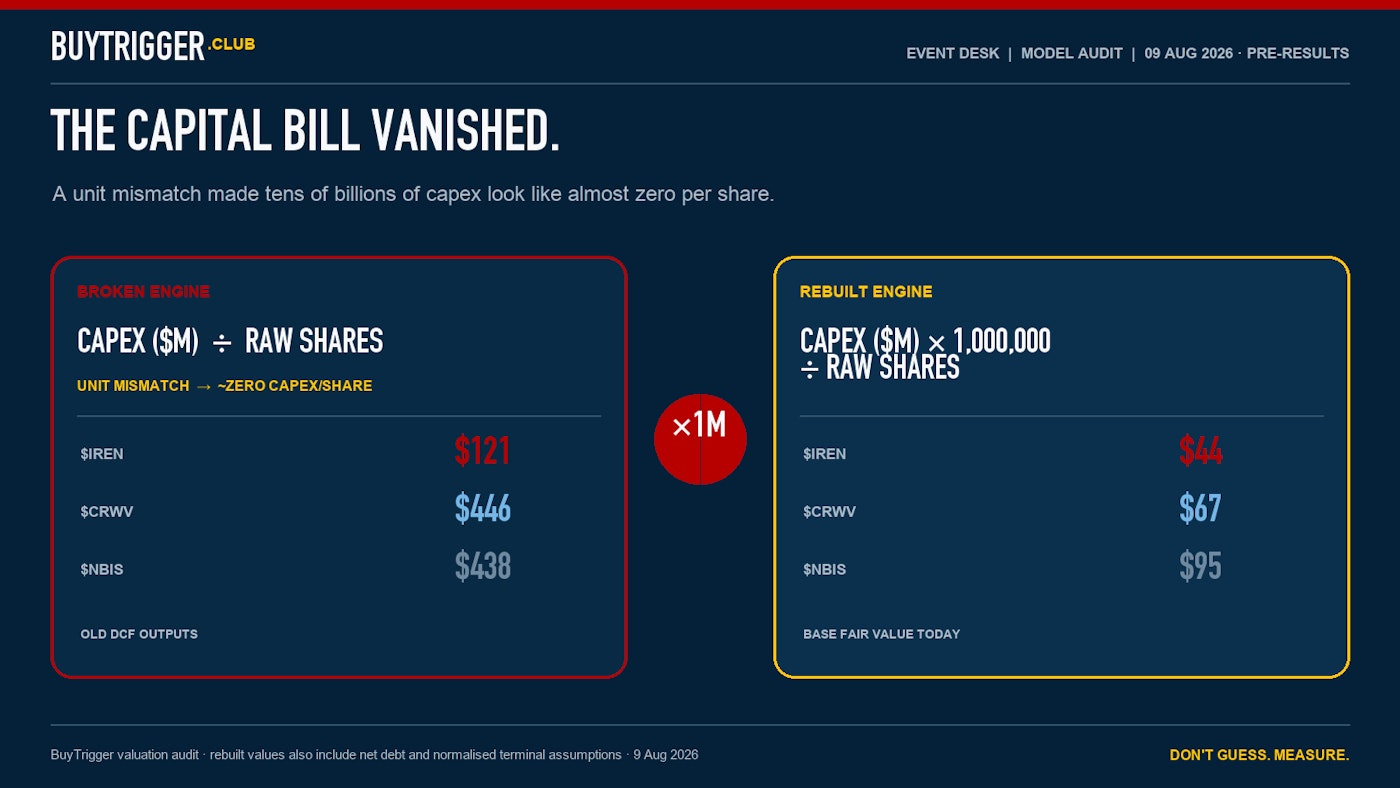
The broken DCF versus the rebuilt model. The new fair values also include net debt and normalised terminal assumptions; this is not presented as a one-cell correction.
That was the moment I stopped patching the old model and rebuilt the machinery around how these companies actually work.
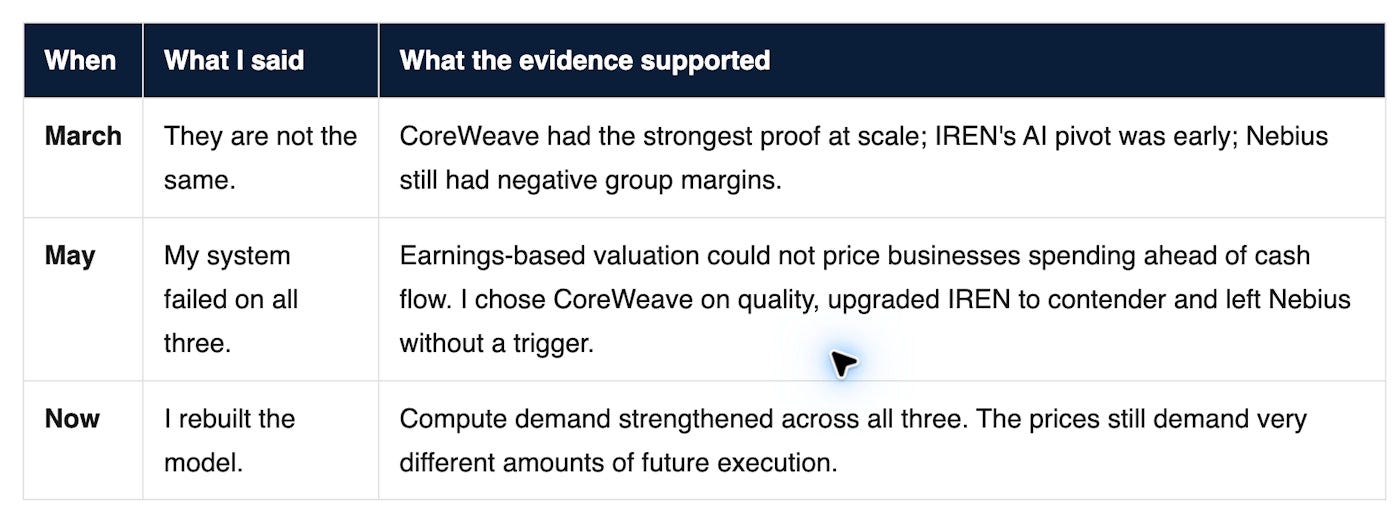
The series did not need a new opinion. It needed a better machine.
I want these in one place because they change the comparison.
Nebius was not debt-free. It carried about $8.45bn of debt, mostly convertibles, at the research cut-off. My earlier “clean balance sheet” description was wrong.
IREN’s 87% was not a company EBITDA margin. It was direct contribution margin on a project, before overhead, interest and depreciation. Strong economics—wrong comparison.
CoreWeave’s Q1 revenue base was $2.078bn. Not the $1.16bn figure that circulated. Start with the wrong base and every growth calculation after it is wrong.
Power is not one number. Secured, contracted, connected and active capacity describe four different stages.
ARR is not recognised revenue. It is a year-end run-rate. The income statement records what was delivered during the year.
Nebius’s Meta opportunity was not one fixed $27bn contract. $12bn was committed capacity; up to $15bn more was an option. The distinction is central to the bull case.
I would rather correct my own work in public than quietly carry a weak assumption into the next article.
Rule of 40 was the centrepiece of Part 1. Re-run on the latest consolidated quarters, it gives:
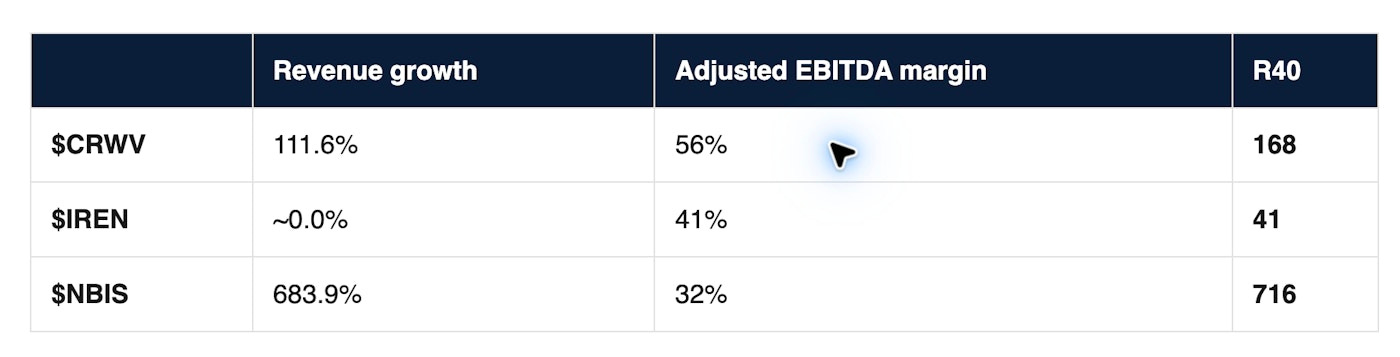
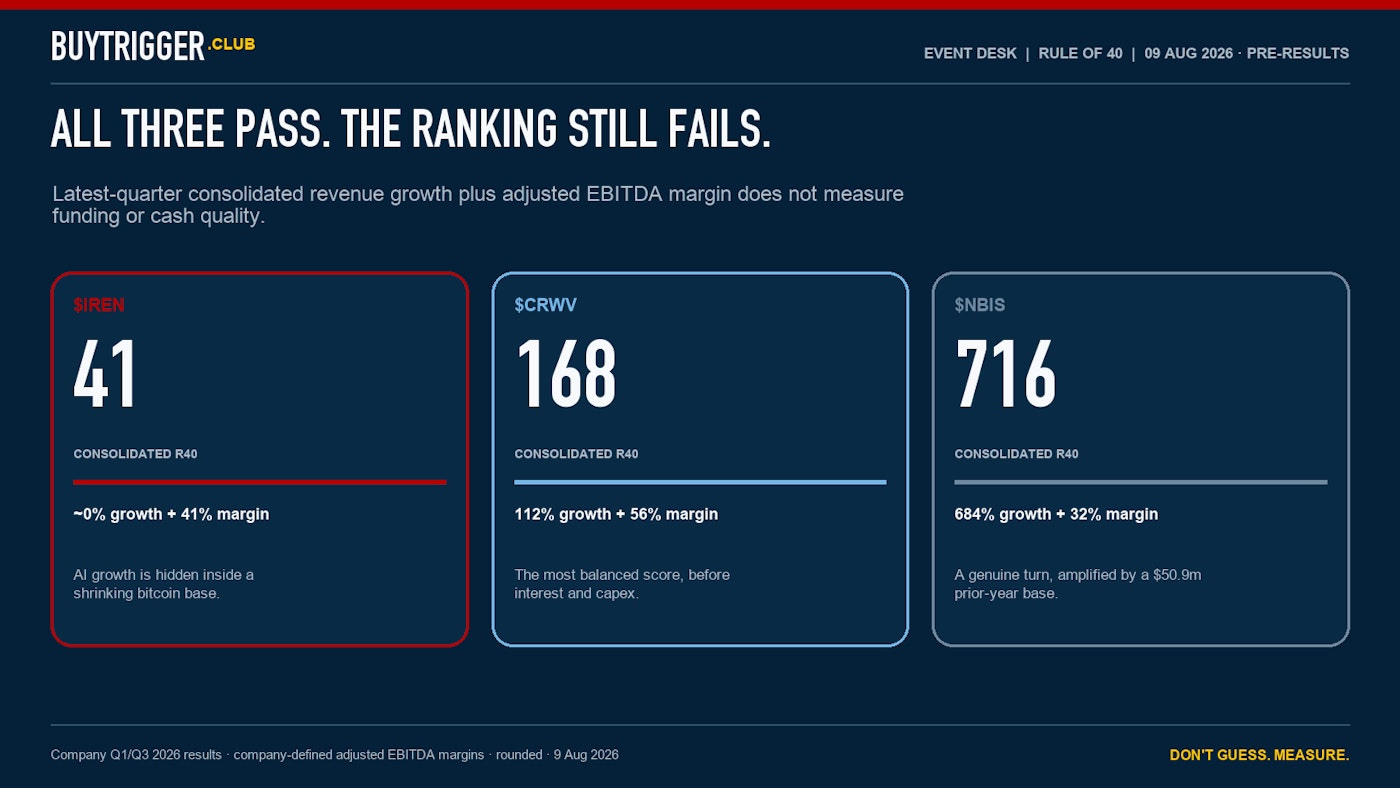
Latest-quarter consolidated Rule of 40. The scores do not capture capex, interest or funding quality.
Those numbers are not a useful leaderboard.
IREN’s group score hides an AI business growing rapidly inside a shrinking bitcoin base. Nebius’s 716 still leans on a $50.9m prior-year comparison. CoreWeave has the most balanced composition, but its interest and capex bill sit outside the metric.
Rule of 40 did not become a bad tool. It stopped answering the question I needed answered.
That is the same lesson as the capex bug: the model has to fit the thing being measured.
All three improved. None improved in the same way.
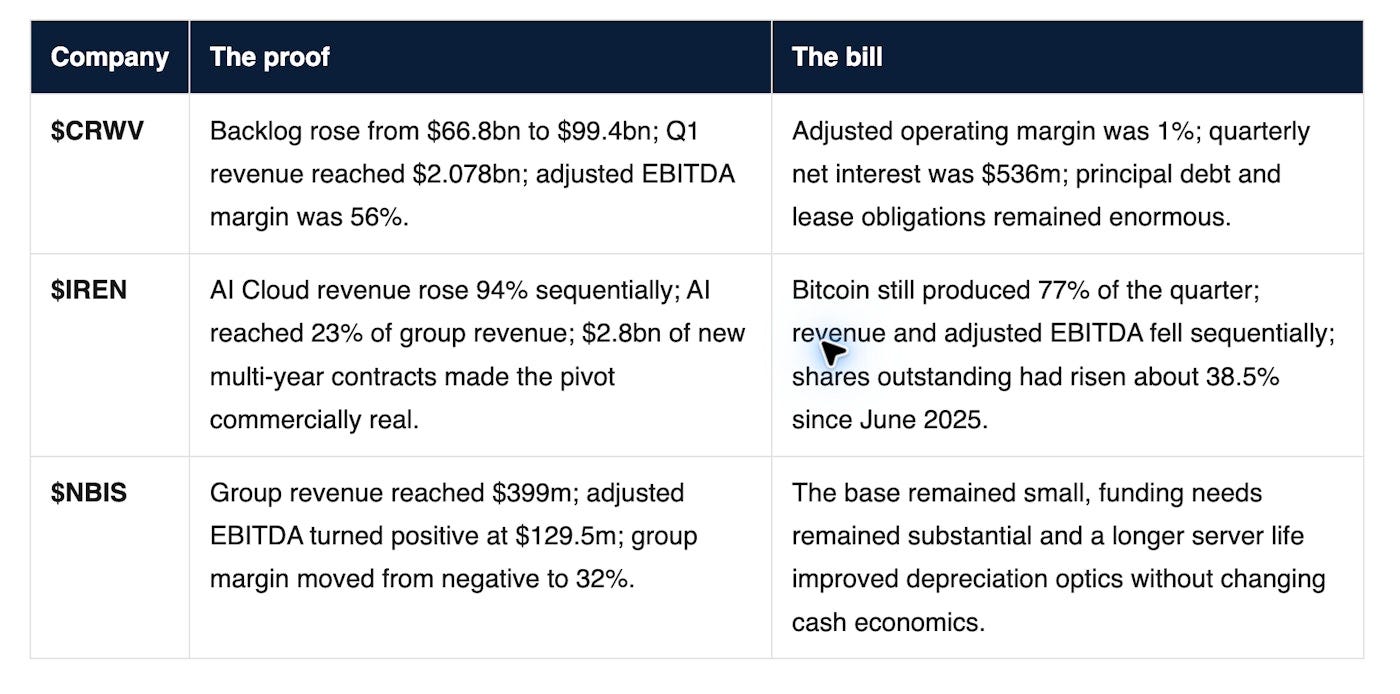
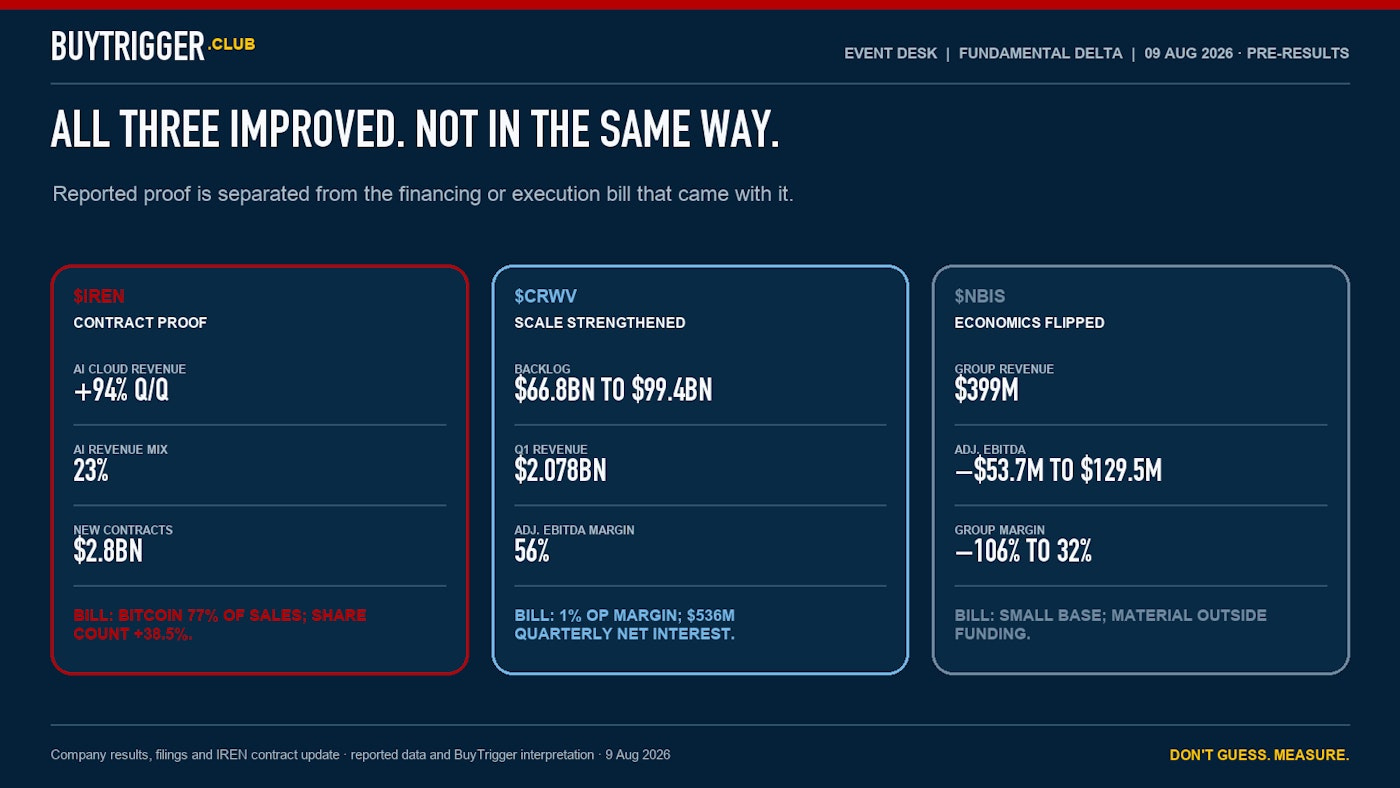
Reported operating proof versus the financing or execution bill attached to it. Company results, filings and IREN contract update, research locked 9 August 2026.
CoreWeave strengthened the scale case. IREN strengthened the contracting and funding case. Nebius killed the operating-margin objection I had in March.
The business debate got more bullish. The valuation debate got harder.
More than 100% of the modelled equity value in these companies can sit beyond 2030 because the near-term build consumes cash before the mature estate produces it. One precise-looking number hides that sensitivity.
So I split the value in two.
Layer 1 — the ink already dry. Signed backlog, equipped capacity and hard infrastructure, minus the debt raised against it. This is the part I can discount with some confidence.
Layer 2 — the bet. Renewals, uncontracted power, long-tail customers and the “serve everyone, not only the largest hyperscalers” thesis. It may become enormously valuable. It is still optionality.
The question running through the rest of the analysis is simple:
How much of today’s price is supported by ink already dry—and how much is payment for the bet?
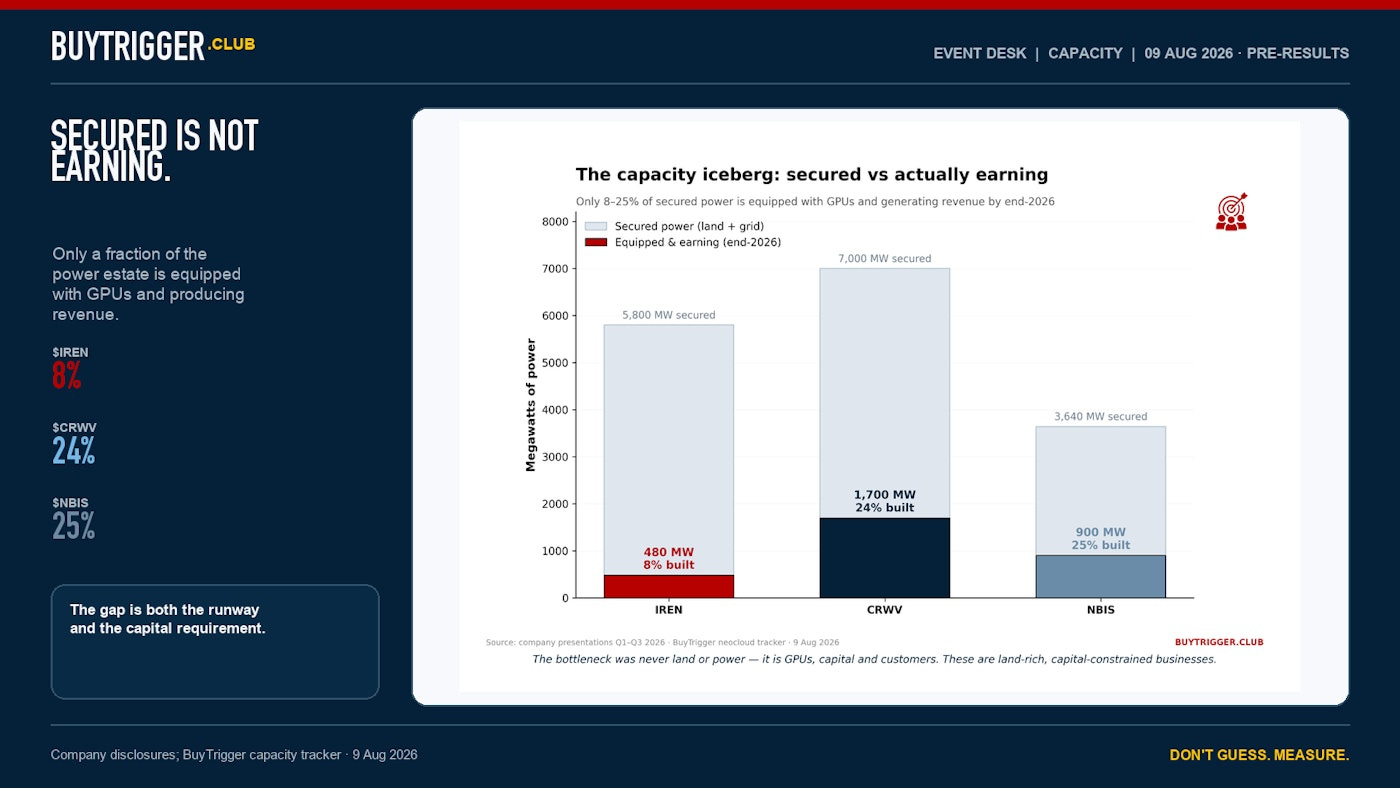
Secured power versus capacity modelled as equipped and earning by end-2026. Company disclosures and BuyTrigger neocloud tracker, 9 August 2026.
IREN had secured roughly 5.8GW. CoreWeave about 7.0GW. Nebius about 3.6GW.
But by the end of 2026, the model showed GPUs installed and earning on only 8% for IREN, 24% for CoreWeave and 25% for Nebius.
That gap is not proof the demand is fake. It is the runway.
It is also the funding requirement. Secured power does not become revenue until GPUs arrive, sites energise, customers sign and the machines start billing.
These are not power-constrained businesses. They are capital-and-execution-constrained businesses sitting on large power estates.
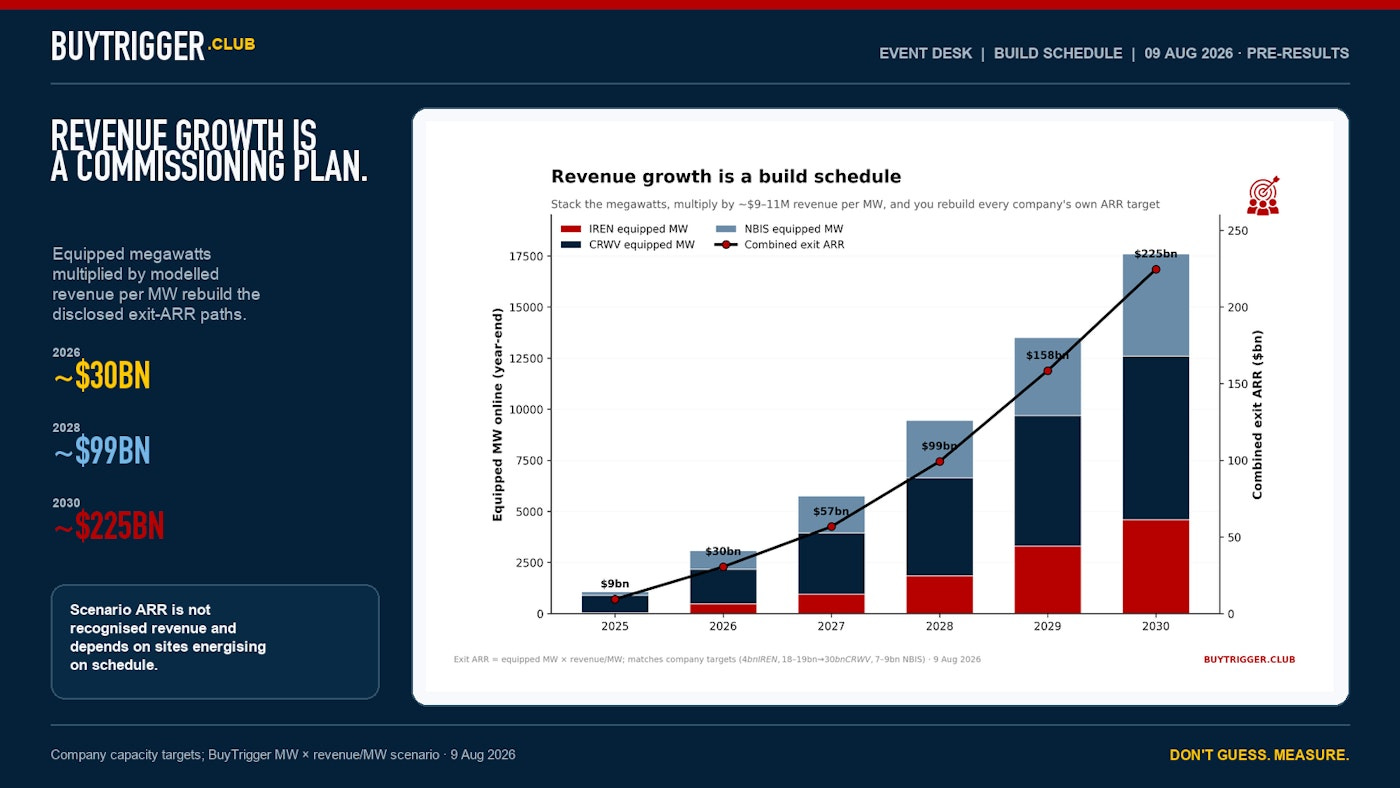
BuyTrigger capacity scenario. Exit ARR is a modelled year-end run-rate, not recognised revenue, and depends on sites energising on schedule.
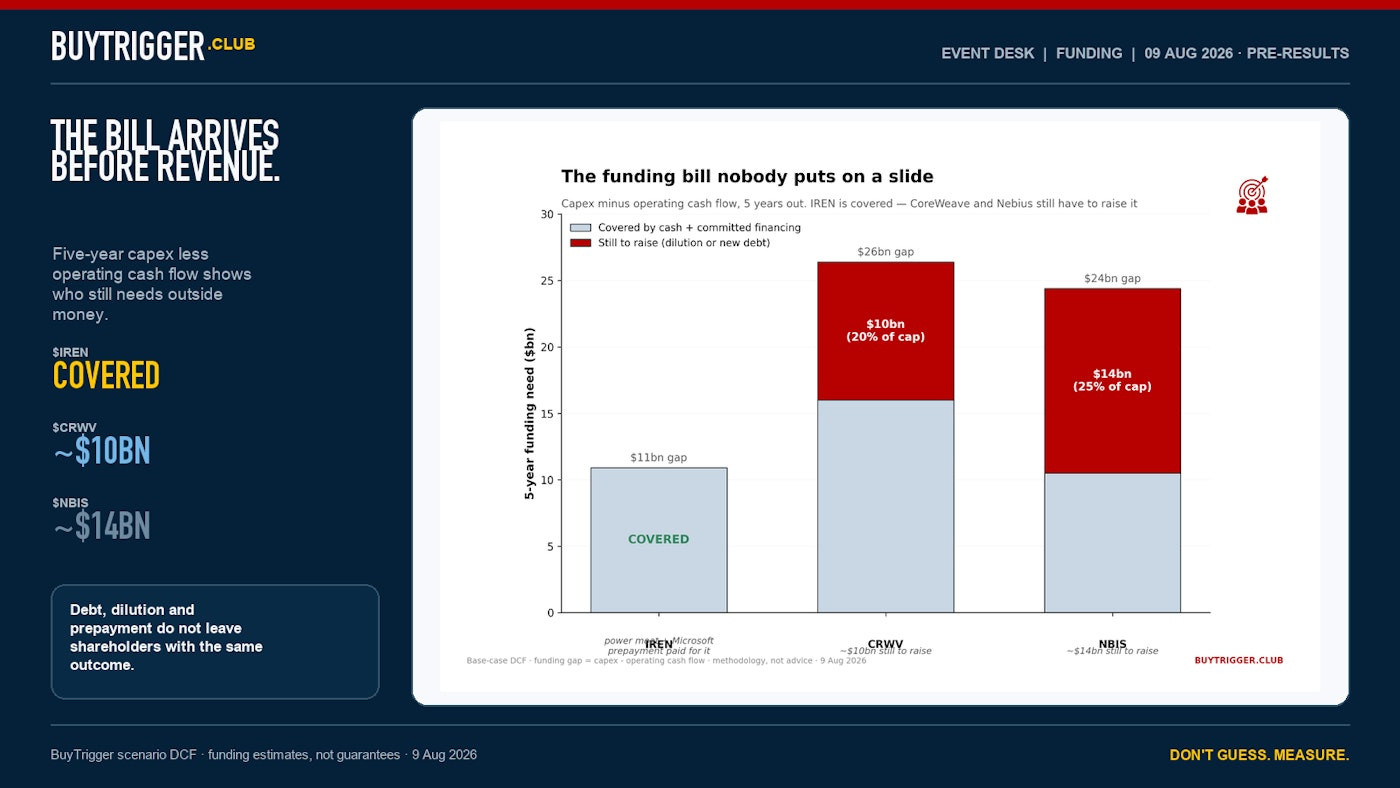
Five-year modelled capex less operating cash flow. Funding estimates are scenario outputs, not guarantees.
My five-year model produced an approximately $11bn funding requirement for IREN, $26bn for CoreWeave and $24bn for Nebius.
The difference is how much remained uncovered under the assumptions.
IREN: covered by cash and committed/customer-backed financing in the base case.
CoreWeave: roughly $10bn still to raise.
Nebius: roughly $14bn still to raise.
That outside money can arrive as debt, dilution, customer prepayment or some combination. The source matters because shareholders do not keep the same percentage of the upside under every funding route.
IREN’s self-funded appearance is one reason my view changed. CoreWeave’s debt can amplify the equity if execution holds. It can also crush it if contracted cash flow arrives late. Nebius has the strongest recent operating turn and the least forgiving relationship between its remaining funding need and its equity value.
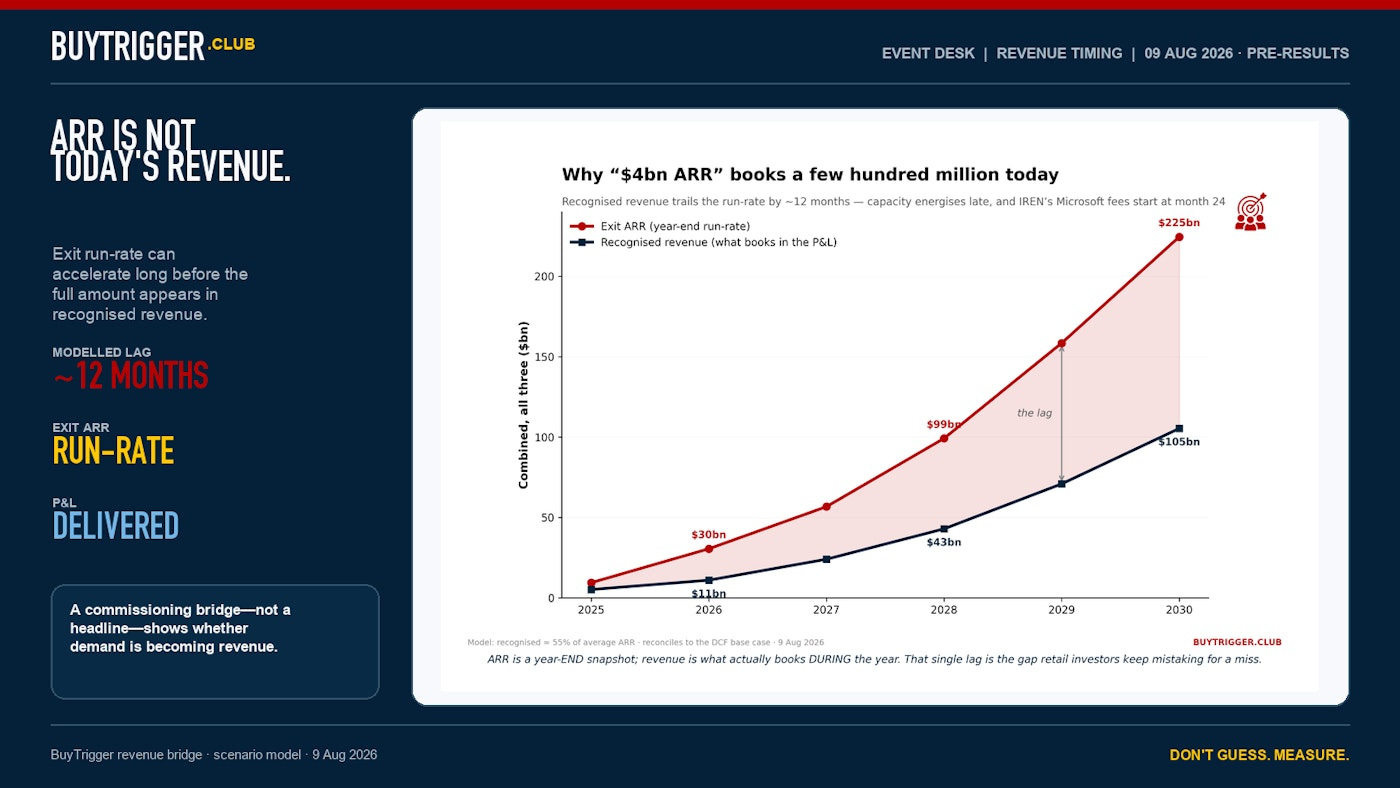
BuyTrigger model bridge. Exit ARR is a year-end run-rate; recognised revenue reflects delivery during the year.
This is the timing error behind half the arguments online.
ARR describes the revenue rate at the exit of a period. Recognised revenue is what actually booked across the period. Capacity that energises late contributes only a few months. Some contract fees begin later still.
In the model, recognised revenue trailed exit ARR by roughly twelve months.
So a company can guide to a multi-billion-dollar exit ARR and still report a much smaller revenue figure today. That is not automatically a miss. It is not automatically smoke either. It is a commissioning and contract-timing question—and each quarterly print must show the bridge becoming real.
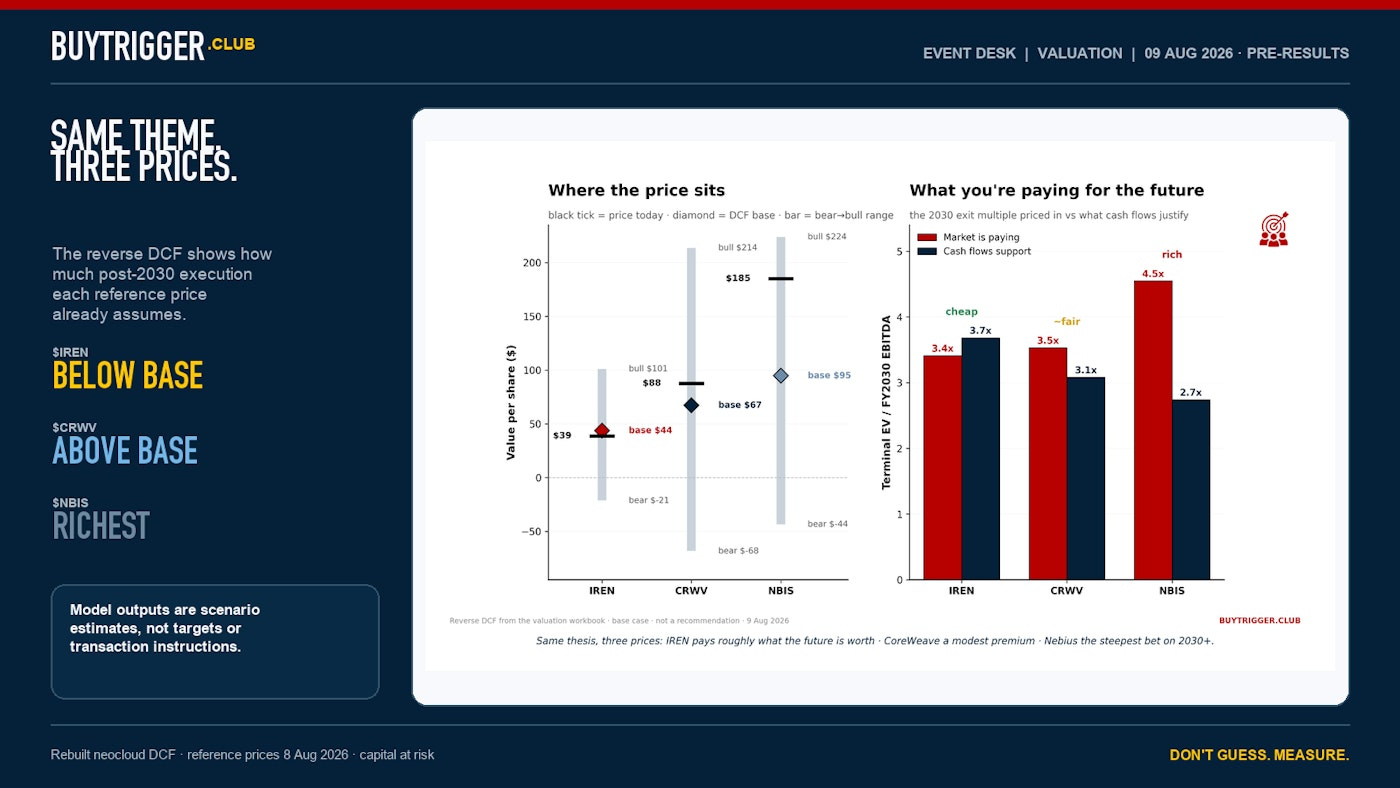
Scenario DCF and reverse-DCF comparison, research cut-off 9 August 2026. Model outputs, not price targets.
The rebuilt DCF puts capex in, takes net debt out, normalises the terminal value and discounts each company at its own cost of capital.
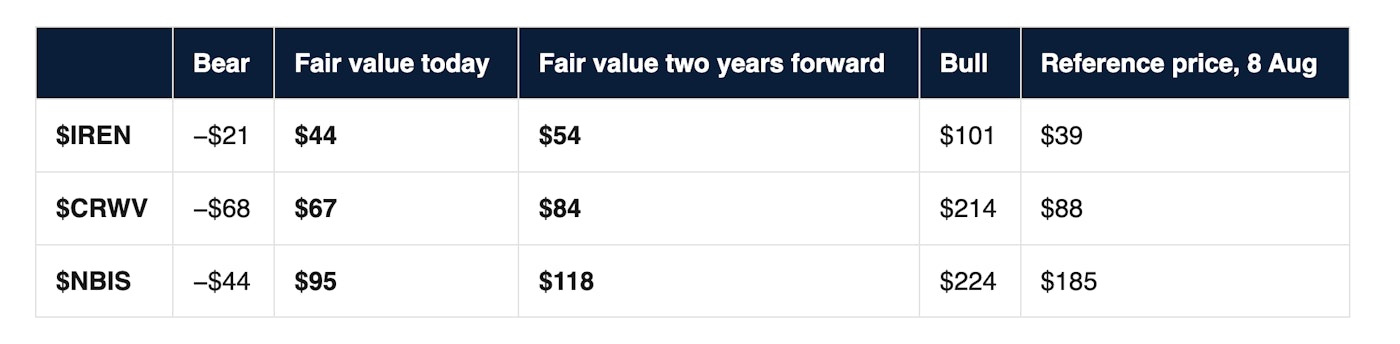
Fair value today is the base-case DCF at the research date. Fair value two years forward rolls that value through the cost of capital. It is not a promise that shareholders capture the full amount: dilution or expensive refinancing can pull realised per-share value below it.
On that locked pre-results snapshot:
IREN traded below the model’s present fair value.
CoreWeave traded above present fair value and close to the two-year-forward value.
Nebius traded far above both, requiring more of the post-2028 story to work.
The exact BuyTrigger entry levels are not reproduced in this article. They combine the model with technical structure and are versioned after each result. The table above shows the valuation machinery, not a transaction instruction.
The bear case is a total loss of equity on all three. In my framework these remain High Risk positions, with a combined allocation ceiling of 10%. That is my risk system—not a recommendation for another person’s portfolio.
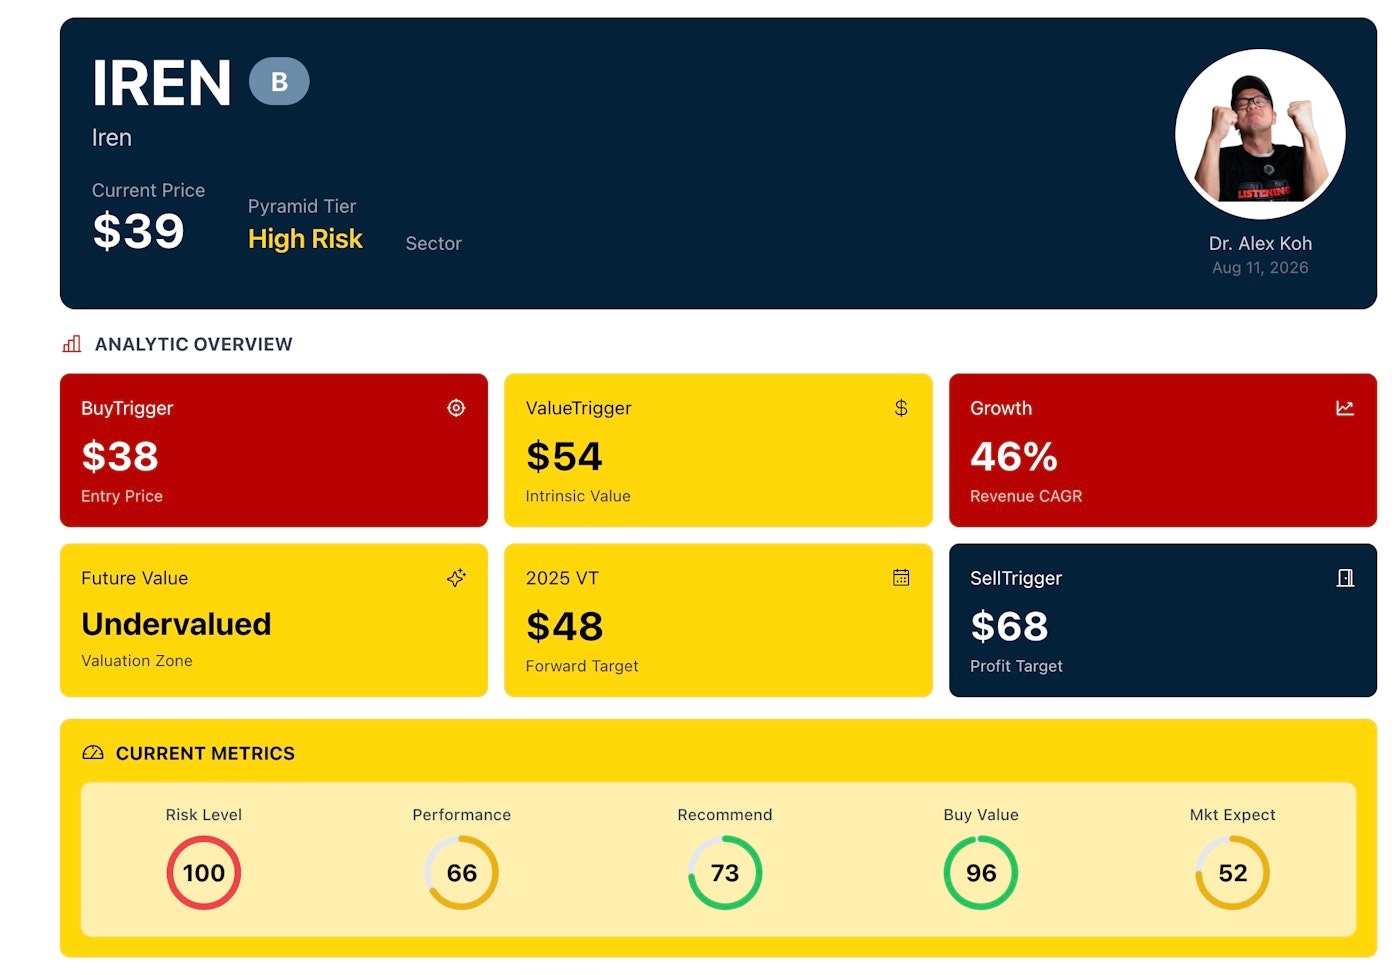
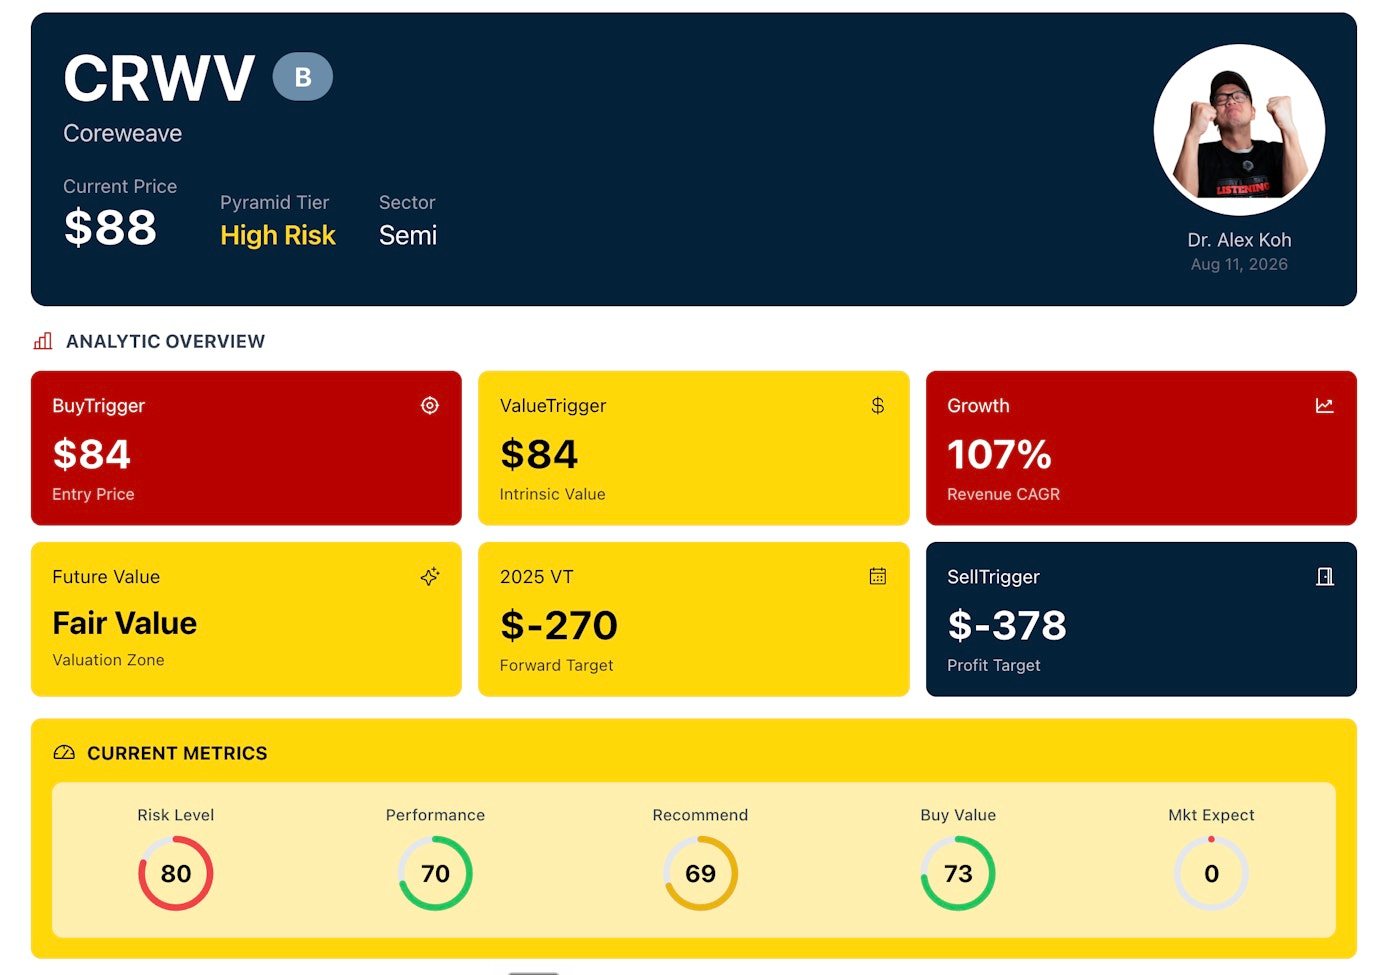
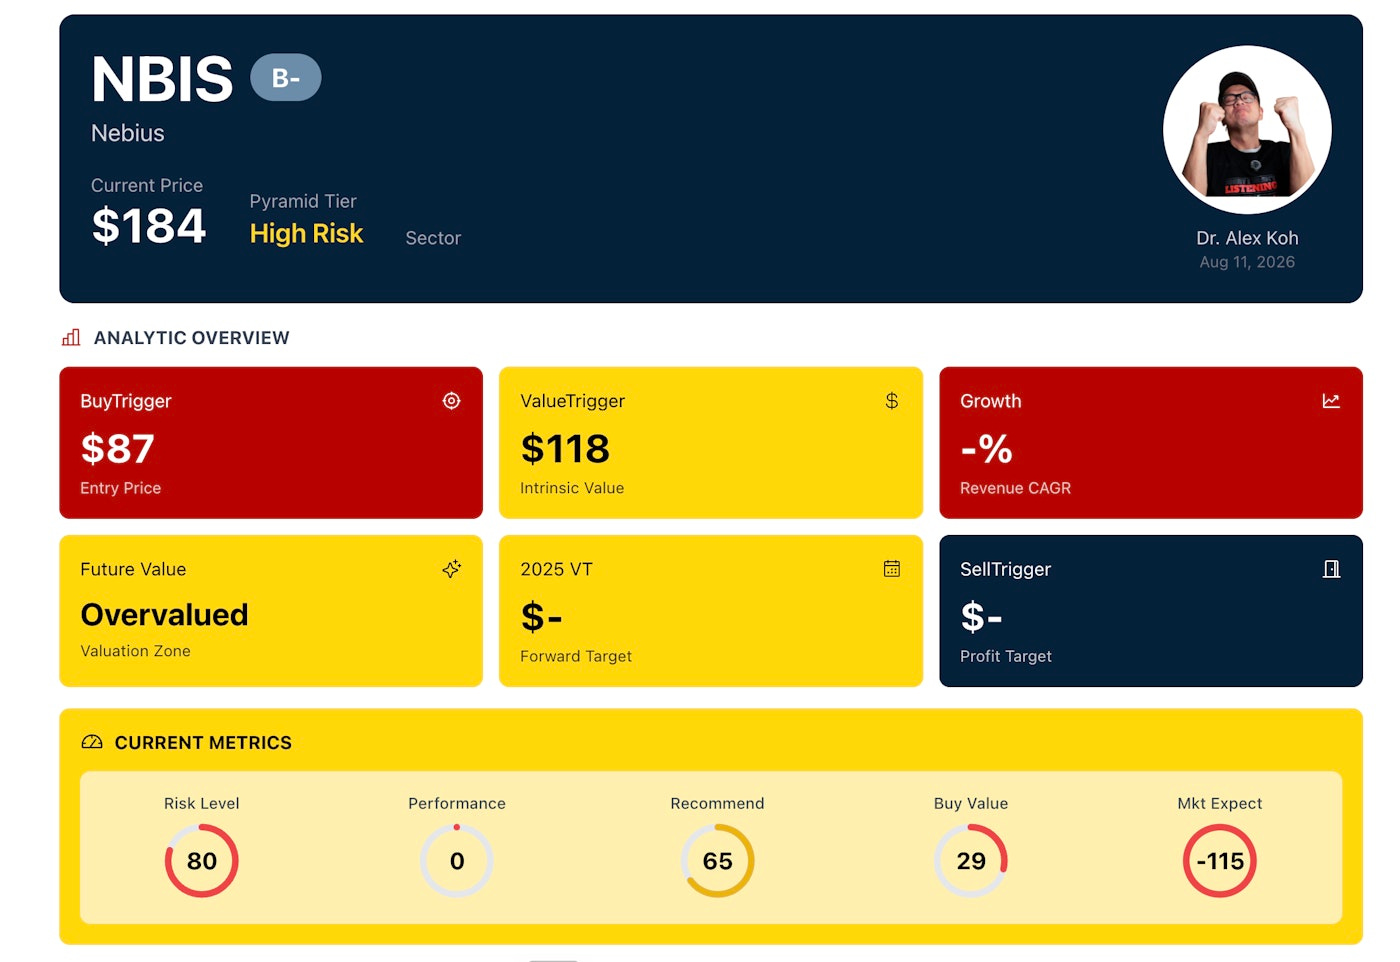
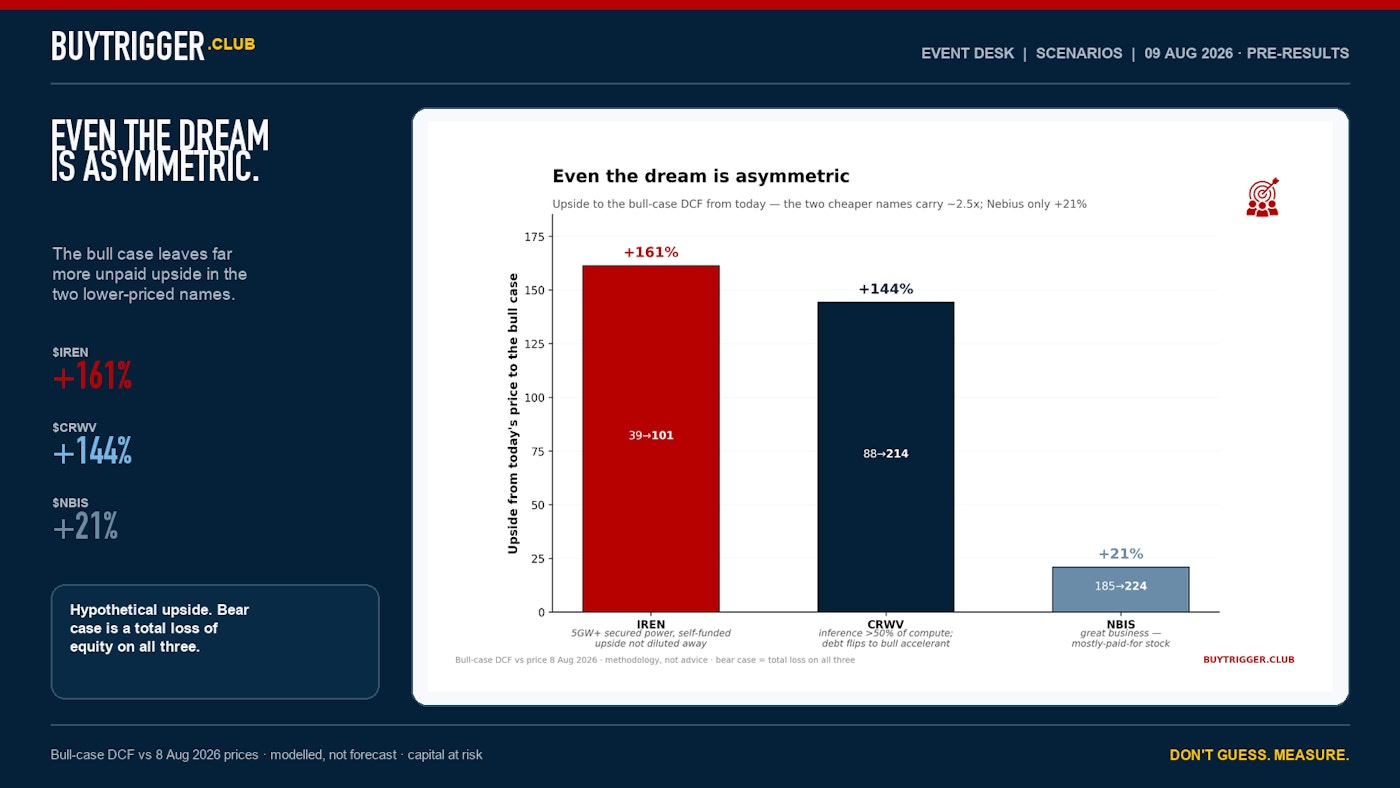
Modelled bull case versus 8 August reference prices. Hypothetical scenario, not a forecast. Bear case is total loss on all three.
If the long-tail demand arrives, renewals hold and the funded capacity fills, the bull-case model produces +161% for IREN, +144% for CoreWeave and +21% for Nebius from the reference prices.
That does not mean IREN or CoreWeave will deliver those returns. It means the price had left far more of their bull cases unpaid.
Nebius can become the best business of the three and still be the least attractive price. Quality and prospective return are related. They are not the same thing.
In March I said the AI business was too early. In May I called it a contender. Now the contracting proof, power position and funding structure have moved it again.
IREN is the only one that sat below my present fair-value model at the locked price. It also has the largest percentage of secured power still unbuilt, so the runway is enormous.
The risk is not subtle: execution and dilution. The AI business still has to replace a bitcoin-heavy income statement, Childress has to energise on time and the share count cannot keep doing all the funding work.
My conclusion is not “IREN wins.” It is that IREN had the cleanest price-to-model relationship before these results.
CoreWeave remains the proven operator. Backlog, deployment speed, NVIDIA access and current scale are why I bought it. I am not selling it because one DCF prints below the market price.
I sized the position for the risk and I am giving the operating thesis time through 2028.
But the rebuild exposed the thing I now watch most closely: CoreWeave owns less of the physical estate than the other two and carries the heaviest visible financing burden. A small number of customers sit above a large leased-and-debt-funded machine.
That structure can work beautifully. It also means CoreWeave must keep converting backlog, deploying on time and refinancing without letting interest consume the operating improvement.
My conclusion: highest operating proof, least obvious margin of safety at the locked price.
The objection I had in March is dead. Group margin turned positive. AI Cloud became almost the whole company. ARR accelerated. Nebius is now a genuinely good operating business.
The valuation problem became clearer at the same time.
At the locked price, the market had already paid for most of the modelled bull case. The funding requirement remained material, and part of the Meta opportunity was still optional rather than committed.
My conclusion: the strongest turnaround, but the most future already embedded in the price.
That is a watch conclusion in my own framework, not a claim that the business is weak.
Anyone can explain a move after the print. These were the tests locked on 9 August:
CoreWeave: Is interest still outrunning the operating improvement? Has top-two-customer concentration fallen from 65%? Is the capex basis still funded on acceptable terms?
Nebius: Is ARR tracking toward the $7–9bn path? Is long-tail cloud revenue becoming visible? Has any part of the additional $15bn Meta option been exercised?
IREN: Did Childress energise on schedule? How much did the share count grow? Is contracted AI revenue replacing the bitcoin base quickly enough?
If those tests break, the thesis moves and the model moves with it. If they hold, the share-price noise matters less.
I will grade the scorecard in Part 4. The pre-results version stays on the record.
I am bullish on compute demand across all three.
The contracts are real. The buildout is real. The capacity runway is real.
What I am not bullish on is paying any price for the theme.
Being right about compute and wrong about the entry is how you still lose money in a bull market. That is why I rebuilt the machine instead of forcing the old one to give me an answer.
March: they were not the same. May: my system could not price them. Now: the machine works, and the prices still do not say the same thing.
Compute won. Valuation didn’t reset equally.
System over emotion—even when the emotion is wanting to own all three.
See you after the prints.
— Alex
I am not a financial adviser and this is not personalised advice. This article documents my research process, model assumptions and what I am doing with my own money. The figures are scenario outputs, not price targets. Investments can lose value; the bear case in this model is a total loss of equity for all three companies. Do your own research.
No posts
Comments
Nothing yet. Say the first thing.
Sign in to join the conversation.