

The cycle is real. The price already knows.
Release data cut-off: market-price comparisons use the 7 August close and the DCF uses USD/JPY 158.78 as at 10 August 2026. The model levels have not been marked to a later price.
Let me start with the bit that isn’t about Nintendo.
I’ve been buying a Japan index for about two years now. Not a trade — a position. Slow, systematic, boring.
And Japan has done exactly what I hoped. The Nikkei is at 66,927. Up 56.7% in twelve months.
Now put Nintendo next to that. $NTDOY is down 48.9% over the same twelve months. From $24.92 to $12.72.
That’s a hundred and five points of divergence between a market I already own and the most famous company in it.
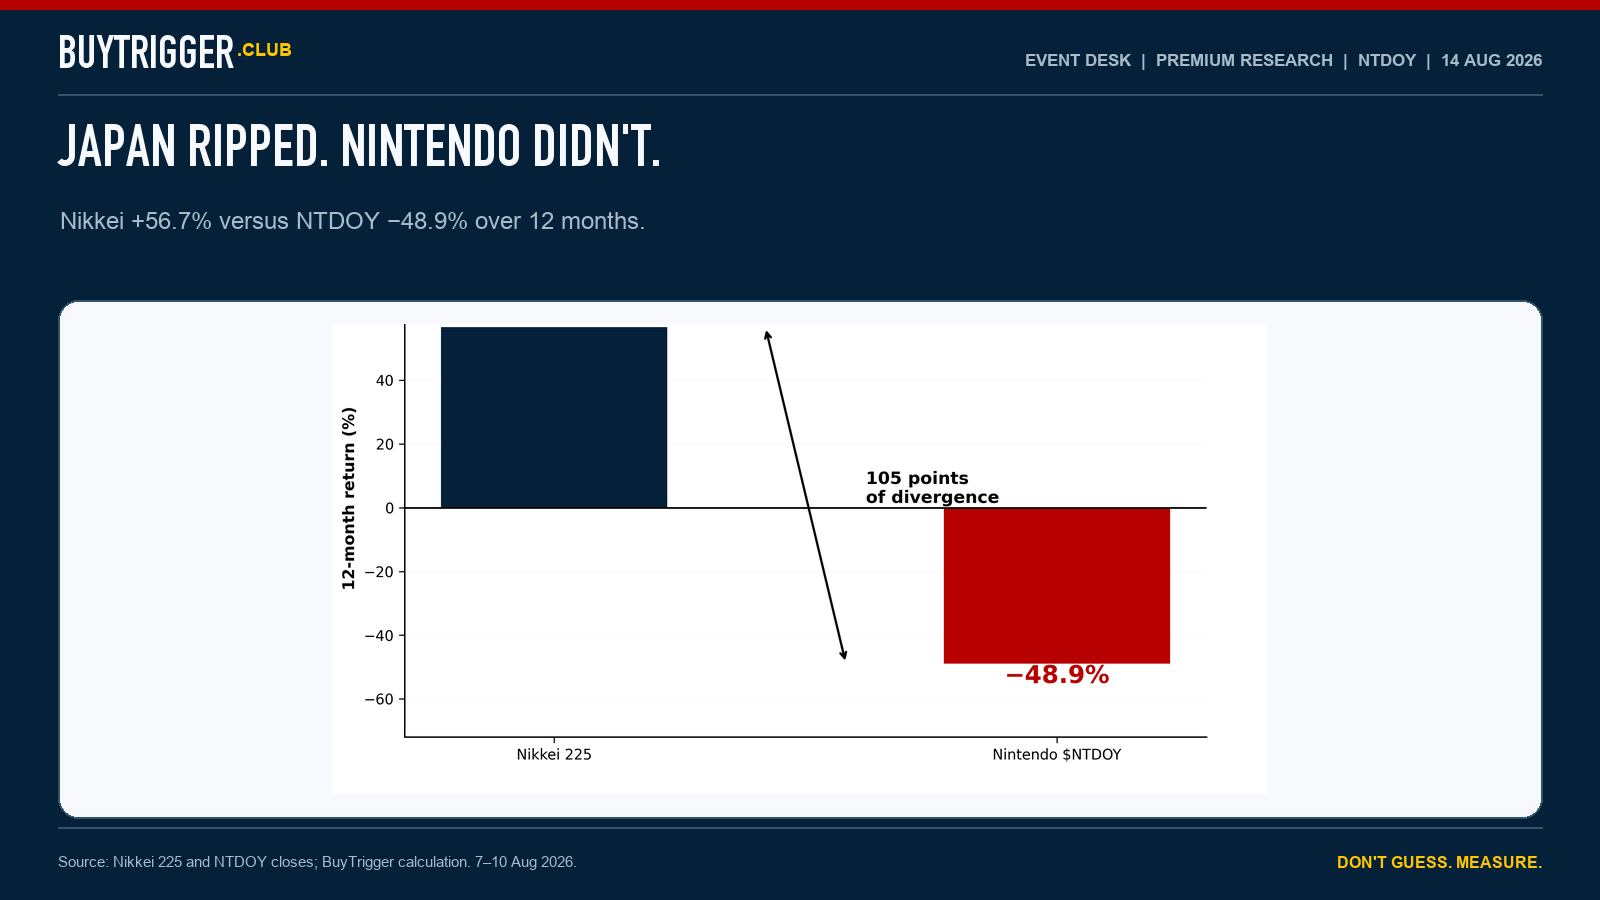
Japan and Nintendo: the 12-month divergence.
That gap is what pulled me in. Not a headline. Not a screener. A number that didn’t sit right next to another number I was already looking at every week.
June. The stock was bleeding. I started at $10.50.
Two days later it bottomed at $10.19.
I want to be clear about that, because it would be easy to dress up. I did not call the bottom. I got within three percent of it and within two days, and most of that was luck sitting on top of a level I’d written down while calm. The system got me into the right postcode. It did not get me the exact house.
At the 7 August close, that position was up roughly 21%.
Then I sat down properly with the filings. And this is where it stopped being fun.
You cannot value a console company on one year of earnings. Year one of a cycle is structurally the worst margin year there is. You sell thin-margin hardware to plant the base, then you harvest it with 80–90% margin software for five years.
So the question isn’t “what did Nintendo earn last year.” It’s “what does Nintendo earn through a cycle.”
Switch 1 just gave us a complete answer. Eight full years, FY3/2018 to FY3/2025, start to finish.
Mid-cycle operating profit: ¥416.1bn.
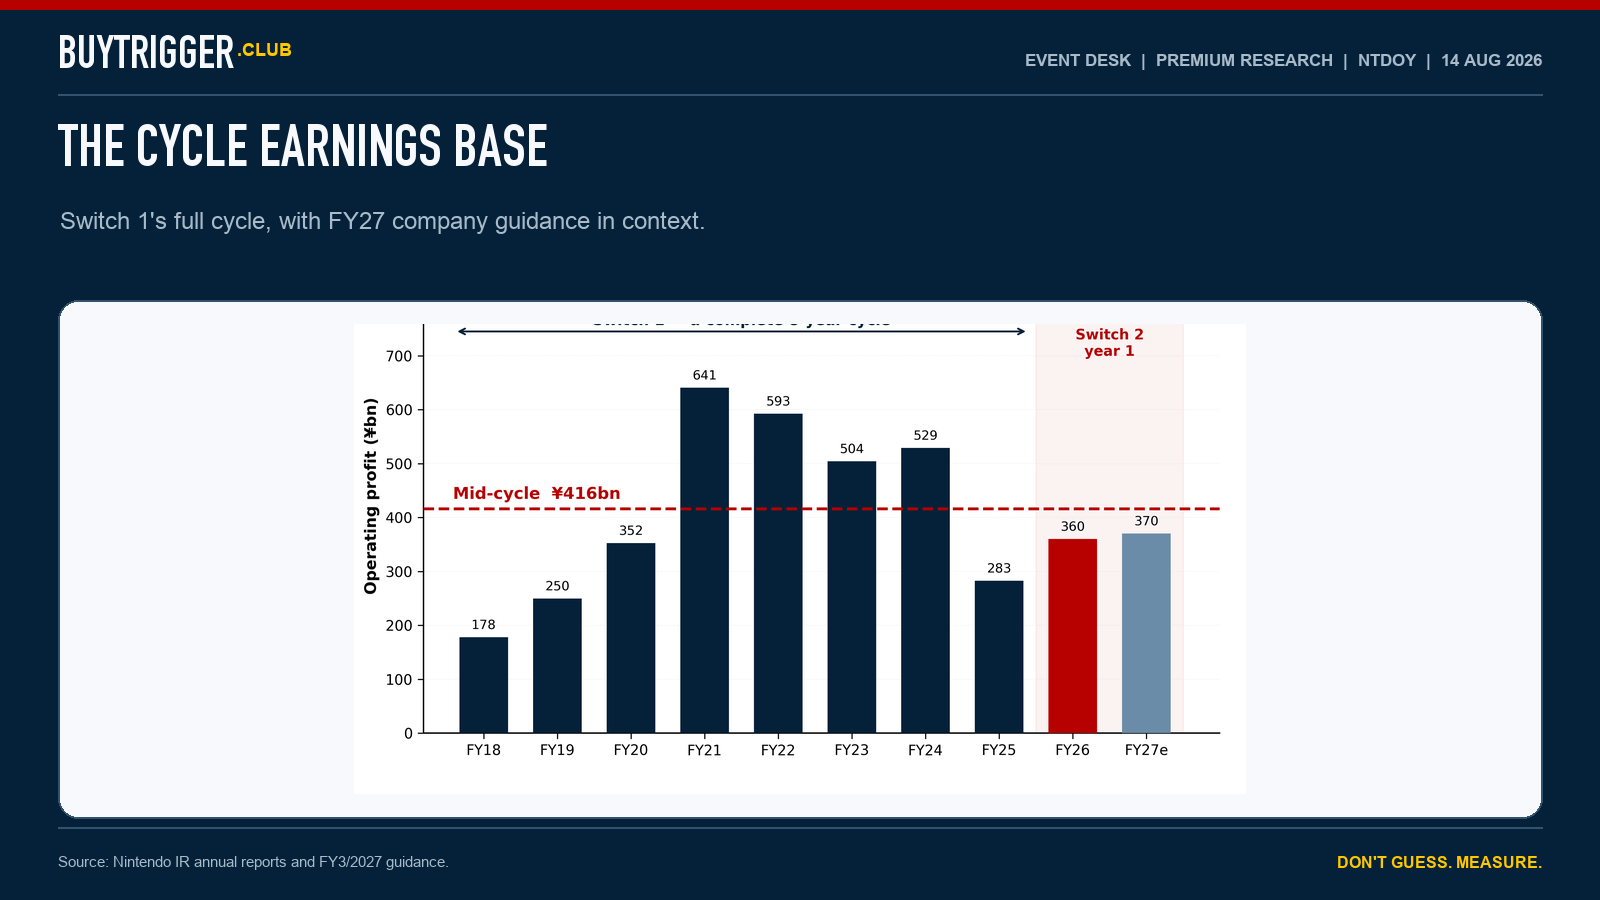
Switch 1 cycle operating profit and current guidance in context.
I checked every one of those eight years against Nintendo’s own annual reports. Not a data provider. The filings. Peak was ¥640.6bn. The launch-year trough was ¥177.6bn.
And here’s the orientation number. FY3/2026 came in at ¥360bn — that’s 0.87x the cycle average. This year’s guidance of ¥370bn is 0.89x.
Nintendo is currently earning about 88% of its own through-cycle average. That is the entire bull thesis in one line, and it’s true.
Which is why what came next annoyed me.
The story everybody is running is that the market is ignoring the console cycle. I believed it too. It’s a good story.
So I tested it. Take each year’s enterprise value, divide it by the same ¥416bn mid-cycle figure, and you get the multiple the market was actually paying for normalised earnings. Reported EV/EBIT is useless here — it goes low at the peak and high at the trough, which is backwards.
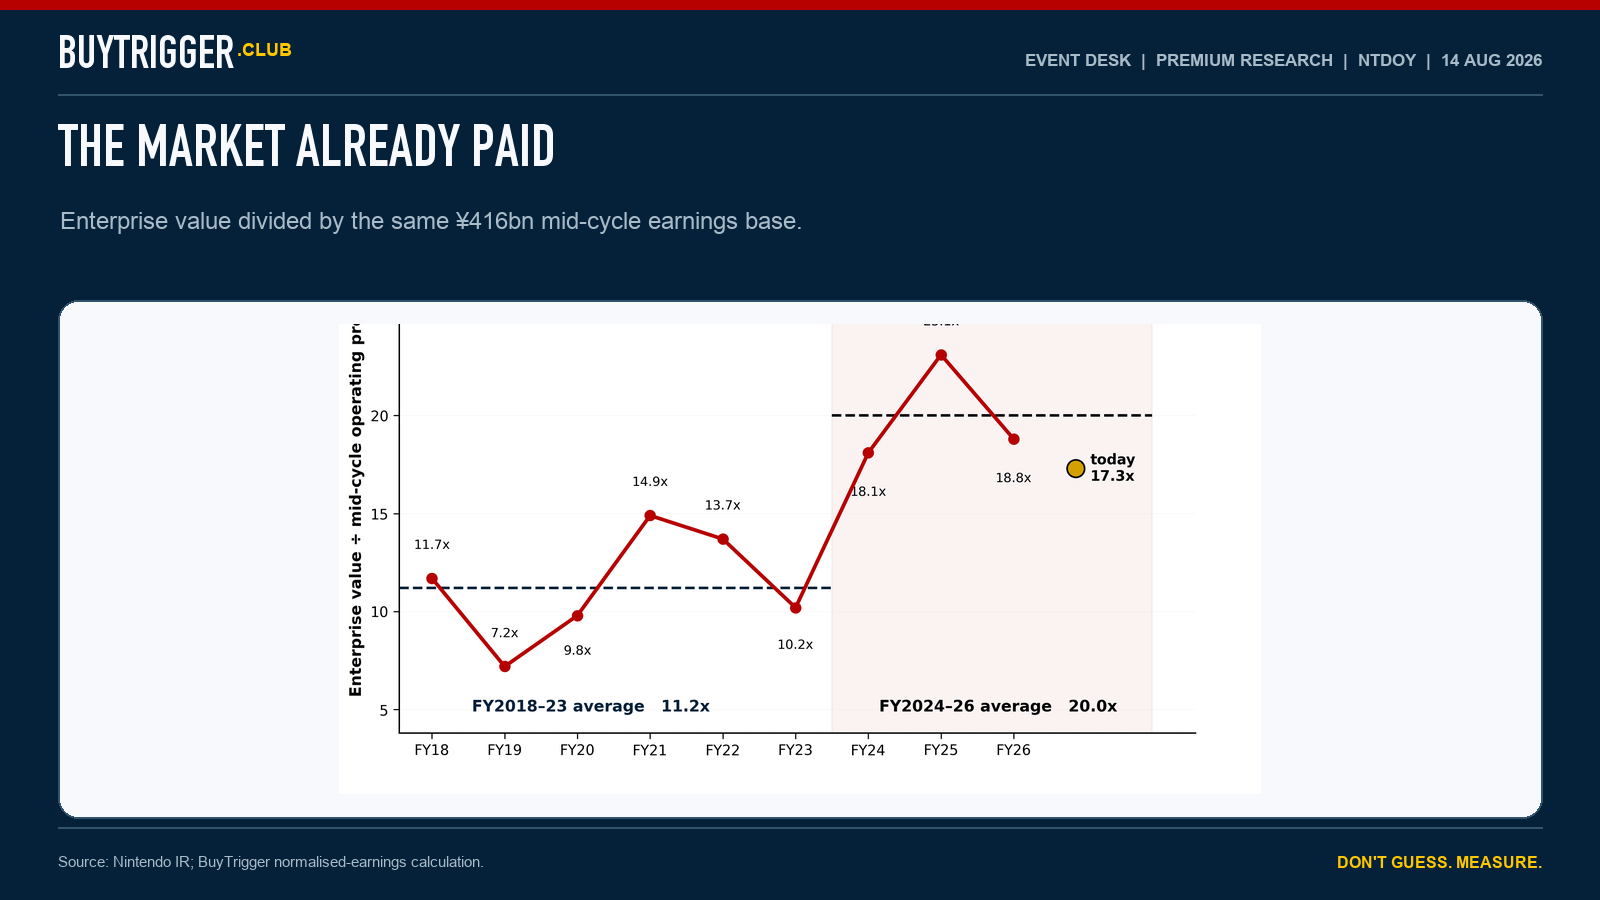
The multiple the market paid for the same mid-cycle earnings base.
FY2018 through FY2023, the market paid an average of 11.2x.
FY2024 through FY2026: 20.0x.
The multiple almost doubled. And it doubled before a single Switch 2 shipped. FY3/2025 is the giveaway — 23.1x mid-cycle earnings, the ¥14,795 high in August 2025, on trough profits.
The market did not ignore the cycle. The market paid for the cycle in advance, in 2024 and 2025, and has since handed about a quarter of it back. Today’s 17.3x is still 55% above what it paid for the eight years before Switch 2 was a story.
I’ve been telling people the opposite. That’s on me.
Now the yen. This was my own read — that a big part of the fall was currency, not company.
I was mostly wrong.
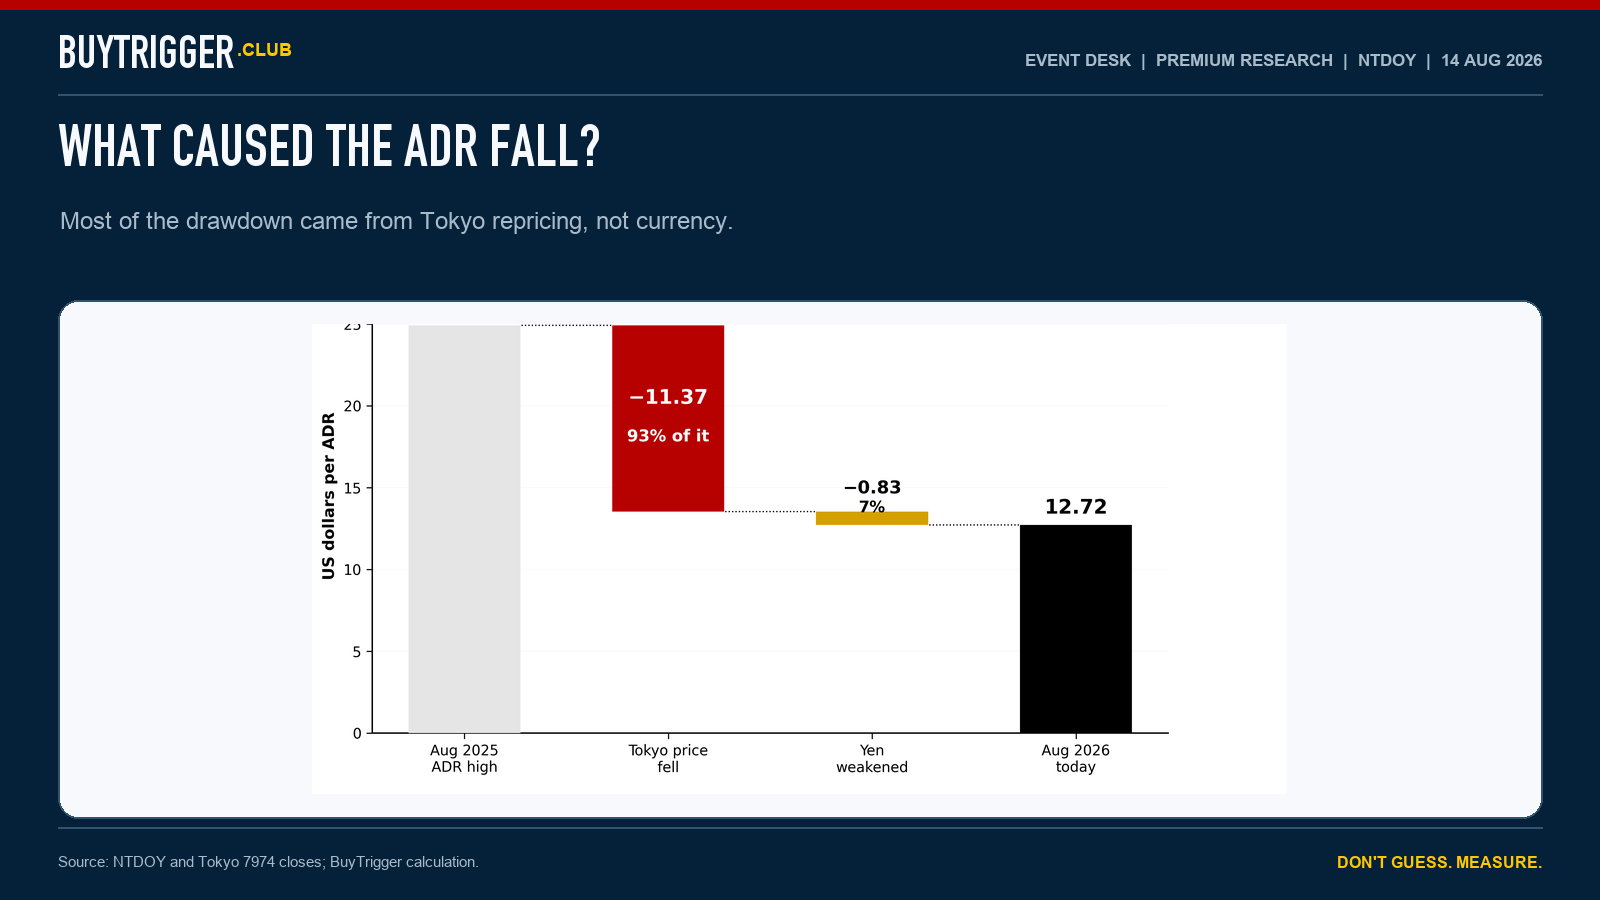
Decomposing the ADR drawdown between the Tokyo share price and FX.
Tokyo fell from ¥14,795 to ¥8,043. That’s −45.6% in yen, before a single exchange rate is involved. The yen went from about 148 to 158, which cost a dollar holder another 6.1%.
Compound them and you get −48.9%.
So of the $12.20 that came off the ADR, the yen was $0.83 of it. Seven percent. The other 93% was Tokyo repricing the company — memory costs, a hardware price rise, and that 20x multiple unwinding.
The currency is real. It is not the story. I had that weighted wrong and the data corrected me.
Where I still think currency matters is forward, not backward. The JGB 10-year is at 2.80%, up 1.31 points in a year. If the Bank of Japan keeps normalising and the yen strengthens, every yen of Nintendo’s earnings converts into more dollars. Sergio and I have been circling the carry trade for months and my view hasn’t changed — the yen is cheap and there’s upside in it.
But that’s an engine for later. It didn’t cause this.
Fair value, discounted cash flow, in yen, converted to dollars at spot.
That ordering matters. Nintendo earns yen. So you discount yen cash flows at a yen cost of equity and convert the answer at spot. Discount yen cash flows at a dollar rate and you count the interest-rate gap twice. It’s the most common mistake in valuing a Japanese exporter and it flatters the answer.
The inputs, all live:
JGB 10-year: 2.80%
Japan equity risk premium: 5.5%
Beta: 1.00
Cost of equity: 8.30%. No debt, so that’s the whole discount rate
USD/JPY: ¥158.78
Terminal growth: 1.0%
I forecast the full Switch 2 cycle out to FY3/2034, peaking at ¥640bn — the same peak Switch 1 made, no more. One thing I refuse to do is run perpetual growth off a trough year, which is how most cyclical DCFs end up 30% too low. The terminal is built on the cycle average of ¥499bn.
Equity value ¥8,099bn. Per share ¥7,025.
The stock is $12.72.
Ah. Not what I wanted.
Before anyone accuses me of being harsh — beta is doing enormous work in that number, and it’s arguable.
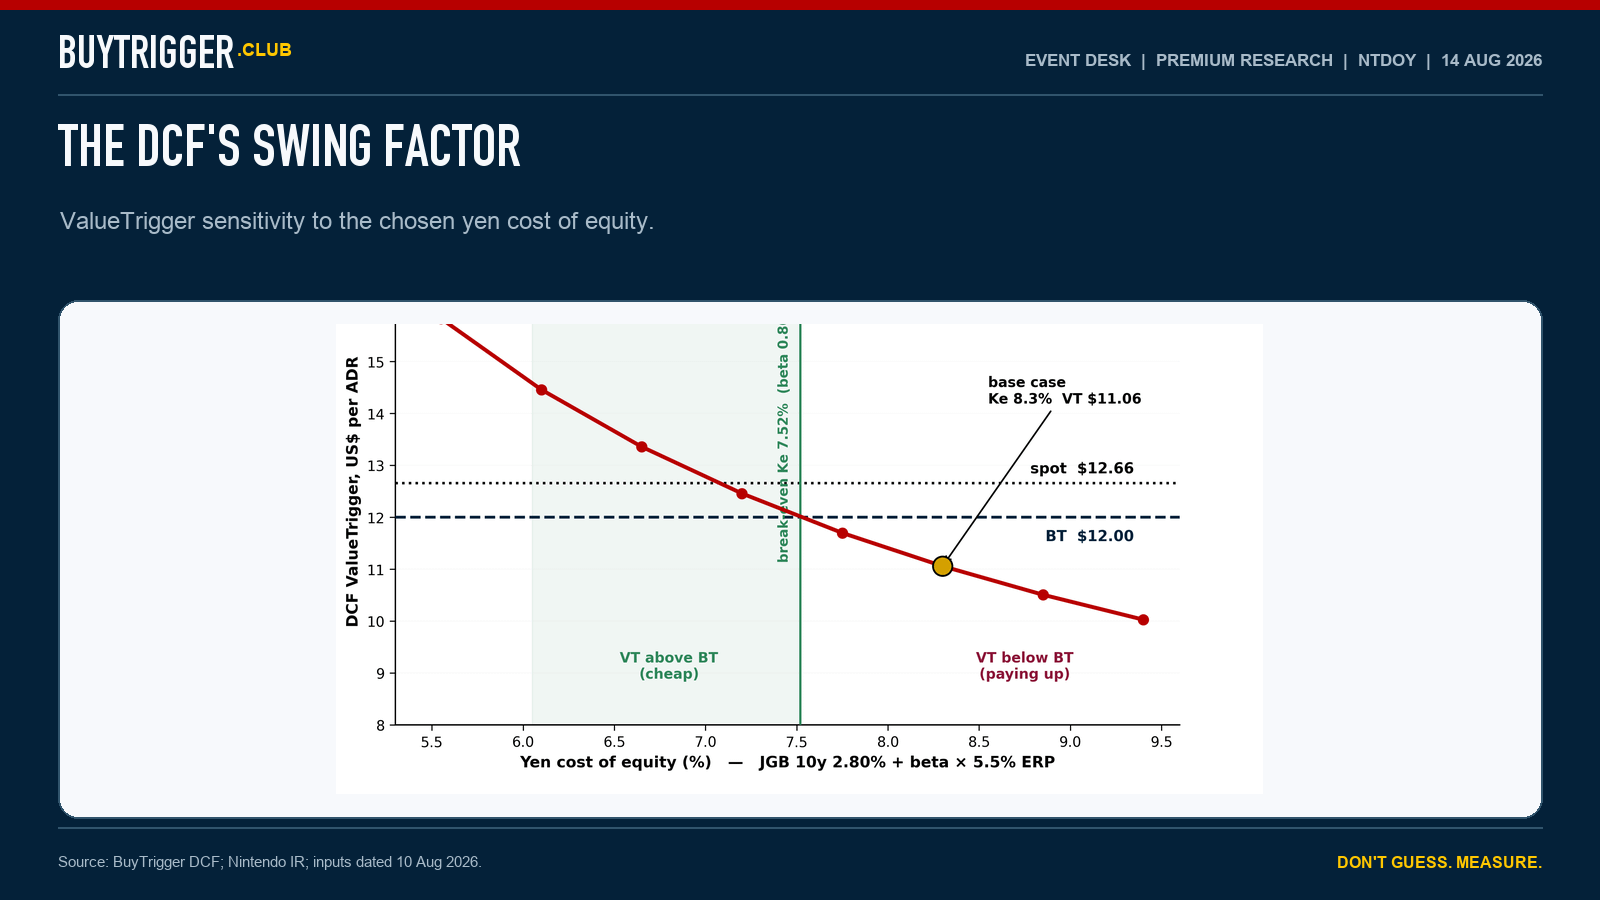
ValueTrigger sensitivity to the discount-rate assumption.
Nintendo’s reported five-year beta is 0.15. That isn’t a glitch. Nintendo moves on console cycles and Pokémon release dates, not GDP. Its correlation to the market genuinely is low. But 0.15 implies a 3.6% cost of equity and a $25 valuation, and I’m not putting my name on that.
Move beta to 0.8 — defensible for a debt-free business with ¥2.1 trillion of net cash — and the ValueTrigger is $12.46.
So the honest range is roughly $9.80 to $13.01, and where you sit inside it is a judgement about how risky you think Nintendo is. Not a fact. A judgement.
And the yen swings it as much as the beta does.
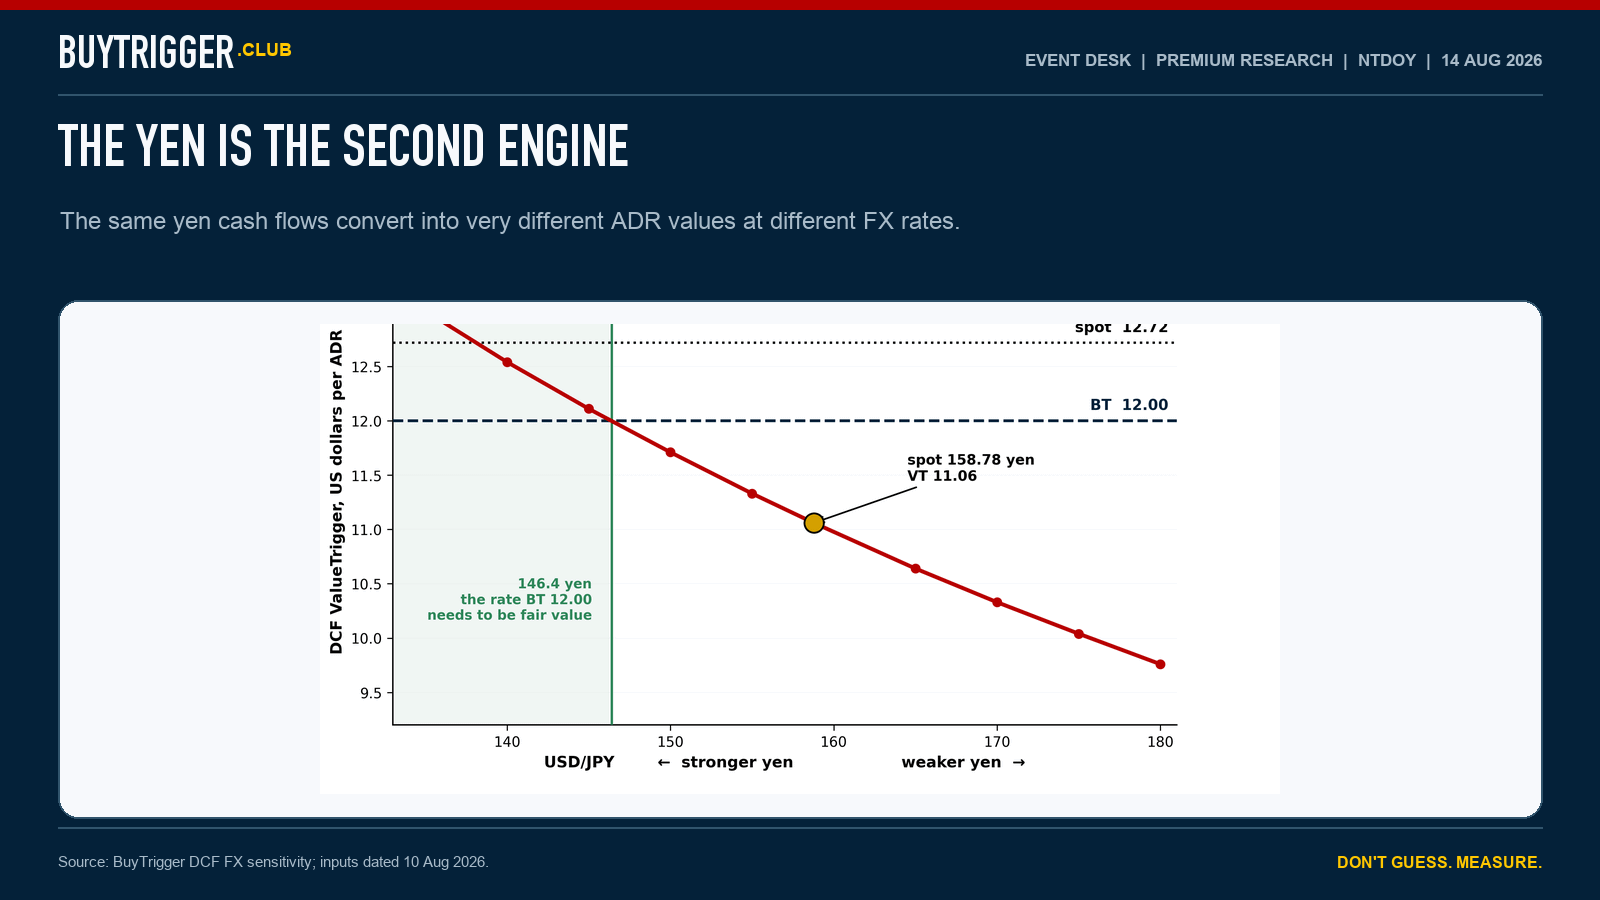
ValueTrigger sensitivity to USD/JPY.
At ¥140 the ValueTrigger is $12.54. At ¥180 it’s $9.76. Same company, same cash flows, same discount rate. That’s a $3 range from currency alone.
This is the number I’d keep if I could only keep one.
Run the DCF backwards. At $12.72, what does the market have to believe?
A Switch 2 cycle peaking at ¥801bn of operating profit — 1.25x Switch 1’s peak — and a cycle average of ¥613bn against Switch 1’s ¥416bn.
That’s the bet in the price. Not “the cycle is ignored.” The opposite: this cycle is materially bigger than the last one.
It might be. FY3/2026 revenue was a record ¥2,313bn, up 98.6%, against Switch 1’s best year of about ¥1,695bn. The attach rate says the software hasn’t happened yet — 2.46 games per console against Switch 1’s 9.80 lifetime.
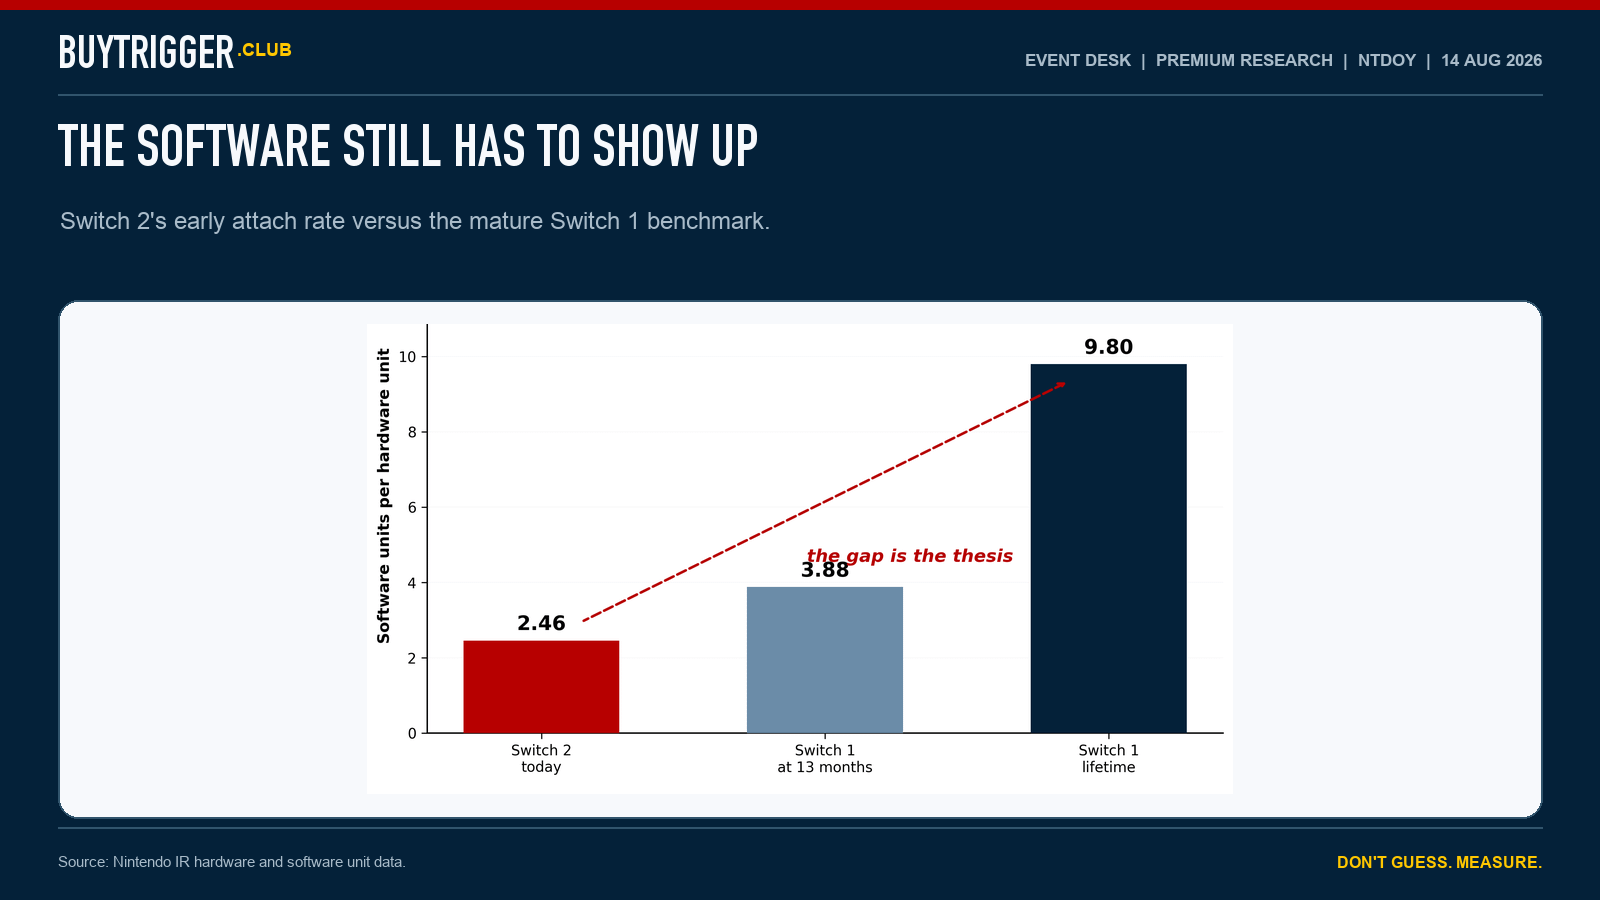
Attach rate is a live risk, not a foregone conclusion.
And the guidance itself contains the mix flip: Switch 2 hardware guided down 16.9%, Switch 2 software up 23.2%. Digital sales up about 90% year on year. That’s the highest-margin line in the business.
The machine is doing what the machine does. The price already knows.
Comments
Nothing yet. Say the first thing.
Sign in to join the conversation.